Deep SAURON Spectral-Imaging of the diffuse Lyman-alpha halo LAB1 in SSA22
Abstract
We have used the SAURON panoramic integral field spectrograph to study the structure of the Ly- emission-line halo, LAB1, surrounding the sub-millimeter galaxy SMM J221726+0013. This emission-line halo was discovered during a narrow-band imaging survey of the large-scale structure in the SSA22 region. Our observations trace the emission halo out to almost from the sub-millimeter source and identify two distinct Ly- “mini-haloes” around the nearby Lyman-break galaxies. The main emission region has a broad line profile, with variations in the line profile seeming chaotic and lacking evidence for a coherent velocity structure. The data also suggests that Ly- emission is suppressed around the sub-mm source. Interpretation of the line structure needs care because Ly- may be resonantly scattered, leading to complex radiative transfer effects, and we suggest that the suppression in this region arises because of such effects. We compare the structure of the central emission-line halo with local counter-parts, and find that the emission line halo around NGC 1275 in the Perseus cluster may be a good local analogue, although the high redshift halo is factor of 100 more luminous and appears to have higher velocity broadening. Around the Lyman-break galaxy C15, the emission line is narrower, and a clear shear in the emission wavelength is seen. A plausible explanation for the line profile is that the emission gas is expelled from C15 in a bipolar outflow, similar to that seen in M82.
1 Introduction
A great deal is now known about the properties of star forming galaxies in the early universe. Measurements of their clustering properties and their luminosity functions has shown that these galaxies are key to understanding metal enrichment history of the universe (Steidel et al., 1996, Adelberger et al., 2003), while spectroscopic studies have established the role of galactic “super-winds” in regulating the conversion of baryons into stars (Pettini et al., 1998, 2001; Teplitz et al., 2000).
One unexpected outcome of emission-line surveys for star forming galaxies at high redshift has been to establish the existence of large scale, highly luminous Ly- haloes, termed ‘blobs’ by Steidel et al. 2000. In this paper, we use the SAURON integral field spectrograph to study Ly- blob 1 in SSA22 (hereafter LAB1). This system is the brighter of two emission haloes that Steidel et al. (2000) discovered during the a survey of the conspicuous spike (at , Steidel et al., 1998) in the redshift distribution of Lyman-break galaxies in this field. Subsequently, Chapman et al. (2001) discovered the highly-obscured, very luminous sub-millimeter galaxy (SMM J221726+0013) near the centre of this halo. This is possibly a massive elliptical galaxy seen in formation (Eales et al., 1999, Smail et al., 2002).
Using SAURON, we can map the emission line profiles across the LAB1 structure. This allows us to probe the nature of the ionised gas surrounding the SCUBA source, gaining insight into the origin of the diffuse halo (is it primordial material infalling onto the central object, or material expelled during a violent star burst?), the mass of its dark matter halo, and the energetics of any super-wind being expelled from the galaxy. We can also trace the large scale structure surrounding the central source, and investigate whether similar haloes surround other galaxies in the field. The answers to these questions will allow us to understand how galaxy formation is regulated in massive galaxies in the high-redshift Universe. They offer key insight into the “feedback” process and will help explain why less than 10% of the baryon content of the universe ever forms into stars (the “cosmic cooling crisis”, White & Rees 1978, Cen & Ostriker 1999; Balogh et al. 2001; Benson et al., 2003).
The gross empirical properties of LAB1 (its spatial extent, luminosity and proto-cluster environment) are strikingly similar to those of the extended emission-line regions around luminous radio galaxies, but there is no powerful radio jet that could be stirring or ejecting the emitting gas (the radio flux is less than 44Jy at 1.4 GHz, Chapman et al., 2001; 2003). This is an important distinction: the dynamics of the LAB1 halo will give us clearer insight into the confining potential and the nature of the emitting material. Of course, it is likely that the two types of halo are related: Several authors (eg., Willott et al. 2002, Reuland et al. 2003) have suggested that systems like LAB1 are seen during an intense star burst phase that is terminated by the triggering of a powerful radio galaxy.
The layout of the paper is as follows. In §2, we describe the observations and the data reduction process. In §3, we present a quantitative analysis of the data cube, which we discuss in detail in §4. We present our conclusions in §5. Throughout, we assume a flat cosmology with , and . This gives an angular scale at of .
2 The Data-Cube
The SAURON instrument is a high through-put integral field spectrograph (Bacon et al. 2001) that is currently operating on the William Herschel Telescope, La Palma. It was designed and built by a partnership between Lyon, Durham and Leiden with the main objective of studying the dynamics and stellar populations of early-type galaxies (de Zeeuw et al., 2002). It combines wide-field ( sampled at ) with a relatively high spectral resolution (4Å FWHM, equivalent to in the target rest frame). The instrument achieves this by compromising on the total wavelength coverage, which is limited to the range from 4810 to 5400Å. This spatial and spectral sampling ensure that low surface brightness features are not swamped by read-out noise. However, the limited spectral coverage means that it is only possible to study the Ly- emission from systems at redshifts between and 3.45. Fortunately, the SSA22 supercluster lies within this redshift range. The sky background is devoid of strong night sky emission in the SAURON wavelength range. For these observations, the SAURON grating was upgraded with a volume phase holographic (VPH) grism giving an overall system throughput (including atmosphere, telescope and detector) of 20%. Because the system uses lenslets (rather than fibres) to reformat the focal plane, the field of view is fully tiled and no light is lost between adjacent spectra.
SAURON was used to observe the SSA22 source for a total of 9 hours, spread over 3 nights in July 2002. The total integration time was built up from individual 30 min exposures, the telescope being offset by a few arcsec between each observation. The raw data were reduced using the XSauron software. The XSauron software is an adaptation for the SAURON instrument of the public XOASIS software (http://www-obs.univ-lyon1.fr/oasis/home/index.html). The extraction procedure uses a model for the instrumental distortions to locate each of the spectra, and extracts them using optimal weighting, taking account of the flux overlap between adjacent spectra. An initial sky subtraction step was made using SAURON’s dedicated sky lenslets that sample a blank region 2’ away from the primary field. To remove small flat-field and sky subtraction residuals, a super-flat was created using the eighteen individual exposures. Dividing by this super-flat procedure improved the flat field accuracy to 1% RMS. Each individual datacube was then registered to a common spatial location using the faint star in the south east of the field and then merged into the final data-cube. In the merging process, we choose to set each spectral-pixel to a size of in the spatial dimensions and a size of 1.15Å in the wavelength dimension. In the combined image, the alignment star has a PSF with FWHM. Although weak, large scale residual gradients were evident in the combined frame. To produce the map of Ly- emission, we subtracted this residual continuum, using a low order polynomial fit to the full wavelength range. This greatly simplifies analysis of the emission line properties, but means that we cannot attempt to detect any continuum emission associated with the source of Ly- photons. The end result is a 3-D (x,y, ) map of the Ly- emission from the region.
3 Results
The three dimensional data produced by SAURON must be carefully visualised in order to extract the maximum information from the data. We started by creating a colour projection of the data cube shown in Figure 1. In this view, the red, green and blue colour channels have been constructed from the data in the wavelength slices centered on 4964.75, 4976.05, 4988.70. Each channel in the image is 5.6Å wide ( in the system rest frame). We have marked the positions of the Lyman-break galaxies, C11 and C15, identified by Steidel et al. 1996, 2000 and the location of the sub-mm source identified by Chapman et al. 2003 (see below). The data-cube can alternatively be viewed as a sequence of wavelength slices as shown in Fig. 2, or these slices can be combined together to make an animation (this can be viewed at http://star-www.dur.ac.uk/rgb/ssa22_movie.mpg).
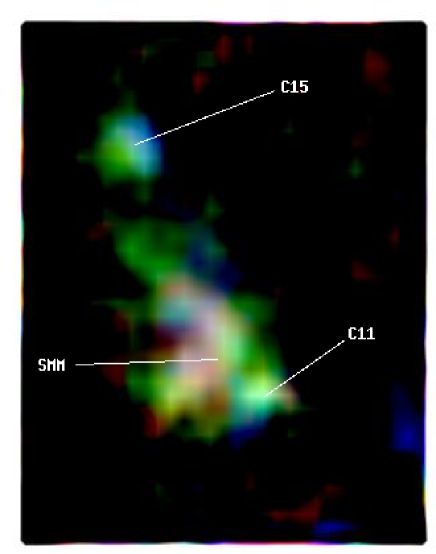
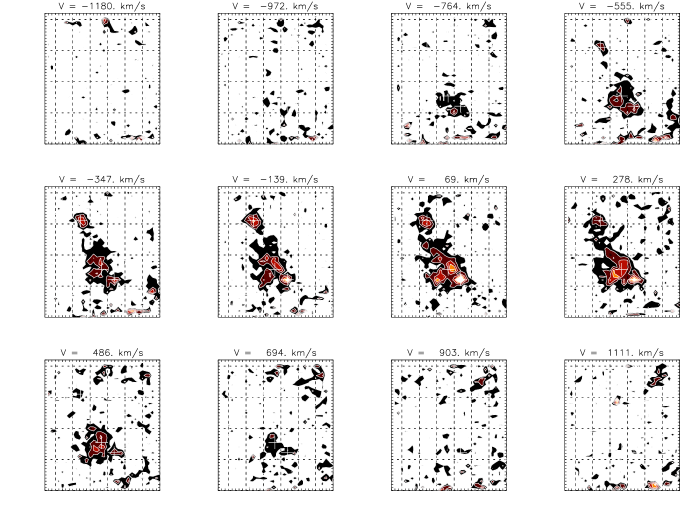
Many striking structures can be clearly seen in the main halo. The overall width of the emission line is very broad ( FWHM) but separate emission structures can be identified. There is significant velocity shear in the emission region around the Lyman-break galaxies C11 and C15, while the structure across the main halo seems more chaotic. The morphology of the diffuse emission can be seen in these velocity slices: particularly interesting is the depression seen near the centre of the halo (this is partially filled by redshifted emission), and the diffuse extension of the halo towards the near-by Lyman-break galaxy C15. C15 itself is centred in a distinct but much smaller halo. We discuss each of these features below.
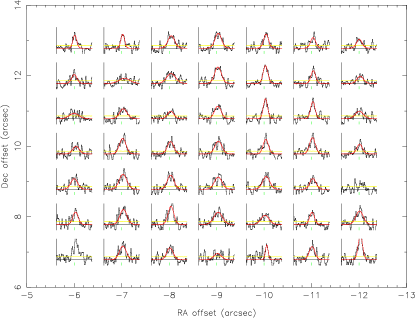
To further quantify the emission and its spatial variations, we fitted each spectrum with a single Gaussian line of variable position, width and normalisation. The best fitting parameters for each lenslet are shown in Fig. 3, while some example spectra and their associated fits are shown in Fig. 4. The limiting surface brightness at which we are able to reliably detect and fit to the line is per sq. arcsec for lines with . Clearly, fitting a single Gaussian to the emission may not correctly represent the underlying flux distribution. For this reason, the line fitting approach and the wavelength slices discussed above should be viewed as complementary rather than as alternatives.
If we concentrate on the emission in a diameter circle around the central SCUBA source, as shown in the figure, the average velocity width () is . The shifts in the central wavelength are much smaller than this: we get an rms lenslet to lenslet variation of only . Around C11, the line has similar average width (), but the rms velocity shift between lenslets is much larger (). The total flux from the complete region (including C11) that is detected by the line fitting algorithm is (in good agreement with Steidel et al. 2000), corresponding to a luminosity of in our adopted cosmology.
In the emission region around C15, the line is somewhat narrower (), and the rms shift in central velocity (), which is dominated by the velocity asymmetry that is prominent in the wavelength slices. The flux from a diameter region centered on C15 is .
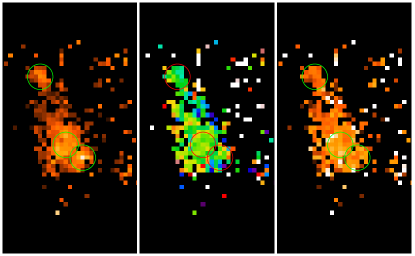
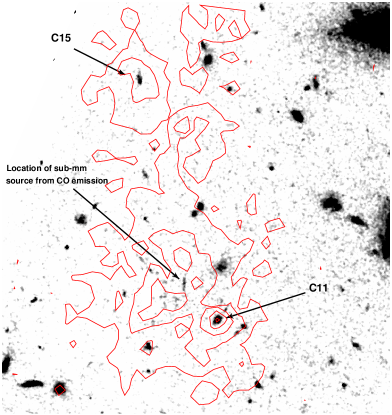
The optical counter-part of the sub-mm source has been identified by Chapman et al. (2003; see also Ohyama et al., 2003) after detecting the associated CO emission. To locate the emission relative to the SCUBA source more precisely, we aligned the IFU data cube and the HST STIS image of Chapman et al. using the positions of the alignment star and the Lyman break galaxies C11 and C15. Fig. 5 shows the STIS image overlayed with the contours of the total Ly- emission. This clearly shows the location of the sub-mm source close to the center of the ‘cavity’ in the emission structure.
4 Discussion
Below we divide our results into the separate features seen in our data and discuss some ideas for how we might interpret them. The interpretation is complicated because Ly- is a resonant line. Thus shifts in the feature can appear both because of genuine gas motion and because photons diffuse in wavelength to escape from optically thick regions: in regions where the ionised halo is dense and the gas bulk velocity is relatively constant, Ly- photons must diffuse further into the wings of the line to escape. We thus expect the changes in the profile to reflect both the bulk motion of the material and the variation of optical depth and dust obscuration with radius (eg., Meinkoln & Richling 2002). In what follows we assume that bulk or turbulent motion is the dominant source of line broadening. This seems to be an adequate approximation. Meinkoln & Richling show that in static media, the line becomes clearly double peaked before the resonant scattering can significantly boost the FWHM line width. Their simulations nevertheless show the inherent difficultly of interpreting the profiles of resonantly scattered emission lines.
4.1 The velocity structure of LAB1
The main halo has a complex structure. Within the broad emission, there are many halo components. The variations in line width and velocity are inconsistent with a simple outflowing thin shell. The distribution is better modeled as many distinct gas components, moving relative to each other with speeds of several hundred . One (certainly naive) interpretation of the wavelength variations is that they reflect the motions of separate gas clumps bound in a common gravitational potential.
If the above were true, we could use the magnitude of the velocity width to infer the halo mass within (or , the typical radius at which the emission can be fitted). If we assume that the clumps are on random orbits with a line of sight velocity dispersion of 500 km/s, the virial theorem suggests a mass of order , as expected for a small cluster with a density distribution given by the Navarro, Frenk & White (1997) parametrisation. It is likely, however, that in fact the clumps have a net outflow or inflow, or are subject to drag from the intergalactic medium (IGM). This makes the mass estimate highly uncertain.
It is interesting to compare the Ly- emission morphology to the H emission filaments seen in some local clusters such as Perseus. The seen around NGC 1275, the central galaxy of the Perseus cluster, can be traced over a radial extent of (Conselice, Gallagher & Wyse, 2001). This is comparable to the extent of the emission region around SMM J221726+0013. Diffuse Ly- was indeed detected around NGC 1275 with the IUE satellite (Fabian et al. 1984). Fabian et al., estimate a total Ly- luminosity of based on the assumption that the emission region has comparable extent to the H line filaments. This is a factor 100 smaller than the luminosity of LAB1. Concelise et al. also measure the spread of velocities of the NGC 1275 filaments (over a region). They find a generally chaotic pattern, albeit with weak evidence for rotation. The bulk velocity is comparable to the rms spread in the line centers (both are ) but the velocity scale is slower than we find around SMM J221726+0013 (although we recognise that caution is required since we have ignored the role of resonant scattering). Although the luminosity and flow velocities around the NGC 1275 system are weaker, it may still be a good local analogue for the SMM J221726+0013 system, and may give us insight into the physical origin of the higher redshift halo. Conselice et al. conclude that the emission is driven by the interaction of outflowing material (in the form of hot bubbles rising under their buoyancy) and the inflow of material cooling in the cluster potential (see also Fabian et al., 2003, Bruggen & Kaiser, 2003).
In the high redshift case, cooling alone is unlikely to explain the observed Ly- emission, because the Ly- luminosity is so high compared to the limits on the X-ray emission (, Chapman et al., 2003); in a intra-cluster medium cooling from a few keV, we would expect even if each hydrogen atom emits a Ly- photon (Cowie, Fabian & Nulsen, 1980). However, at such high redshift it is far from clear that the gas is ever heated to the virial temperature of the system. The simulations of Fardal et al. 2001 suggest that cooling is so rapid that a hydrostatic equilibrium is never established. In their interpretation, both the extent of the emission halo and the width of the emission line are due to radiative transfer effects. This seems unlikely since the line-width appears to increase with radius (rather than decline), but much more detailed radiative transfer models are needed to test this hypothesis. Our preferred explanation is that the extent and distribution of line flux reflect the underlying motion and extent of cooling gas. A powerful collimated outflow appears inconsistent with the lack of velocity shear across the halo (unless it is oriented close to the line of sight). The emission halo therefore seems best explained by the interaction of slowly rising buoyant material with cooling gas contained in the proto-cluster potential. The origin of this hot material remains unclear, however: the convection could equally well be driven by an heavily obscured AGN, or by vigorous star formation.
4.2 Relation to the sub-mm source
Figure 5 shows the relative location of the emission-line halo and the optical counter-part of the strong sub-mm source (Chapman et al., 2001; 2003). The overlay suggests that the sub-mm source may be located at the centre of a ‘cavity’ in the Ly- emission. It has already been established that the Ly- emission haloes in Perseus (Johnstone & Fabian, 1988) and high redshift radio galaxies (van Breugel et al., 2003) are ionised by a distributed source. The presence of the cavity supports this interpretation — it is hard (although not impossible) to construct emission geometries in which the central source ionises the surrounding nebulae but is itself shielded from the observer.
There are several possible interpretations of the cavity. (1) It may be a genuine cavity in the ionised gas distribution. This might be evidence for a strong wind blowing away from the central sub-millimeter source. However, we would then expect the broadest lines to be observed close to the center. This is in conflict with the situation observed. (2) Figure 5 could also suggest that we are seeing an effect similar to that responsible for Wide Angle Tail radio sources. The relative locations of the STIS continuum object compared to the contours of the Lyman emission could be consistent with an object blowing out line emitting gas that is then slowed by ram pressure, losing collimation in the process and hence producing two large trailing lobes of emission. The physical details of the emission process are clearly completely different, but the slowing of the gas by the inter-cluster medium could be similar. It is unclear, however, why the material would remain ionised (given its very high luminosity) for a sufficiently long period of time. (3) Alternatively, the cavity may occur because the ionised gas in this region contains significant dust (cf., Reuland et al. 2003). As the Ly- diffuses out of the central region, it is strongly extincted. This explanation is appealing since we know that the central SCUBA source has high extinction. If there were no dust at all, we would expect the emission to be scattered into the line wings rather than being absorbed. This scattering may be why the emission that is seen near the location of the sub-mm source tends to be redshifted.
4.3 Mini-haloes around Lyman-break galaxies
The two other Lyman-break galaxies embedded in the structure appear to have dynamically distinct haloes. This is particularly clear for C15 to the north of the main halo (although there is faint emission that bridges between C15 and the central halo). A similar halo can also be discerned around C11. This is a surprising discovery that leads us to speculate that other Lyman-break galaxies would also have extended Ly- haloes if observed to sufficiently low surface brightness.
The mini-halo around the C15 Lyman-break galaxy has its own characteristic velocity shear pattern. We can identify the morphology of this galaxy from the STIS imaging of Chapman et al. 2003. C15 is elongated at roughly 60 degrees (Fig. 5) to the velocity shear seen in Ly-; interestingly, the morphology of C15 seems somewhat more disturbed than typical Lyman-break galaxies. The orientation, together with the unflattened morphology of the emission, makes it unlikely that the shear reflects the rotation of a conventional gas disk. Instead, the shear pattern is reminiscent of the super-wind outflows predicted from proto-galactic disks (Springel & Hernquist, 2003), and observed in local starburst galaxies such as M82.
If we interpret the shear as an outflow inclined at to the line of sight, the pattern suggests a deprojected outflow velocity of , and a physical extent of . For comparison, the H emission seen in M82 indicates a deprojected outflow velocity of (Shopbell & Bland-Hawthorn, 1998), extending to above the disk (Devine & Bally, 1999). It is interesting that the dwarf galaxy M82 has a significantly larger outflow velocity than C15 even though Lyman-break galaxies are thought to have high disk circular velocities (, Pettini et al., 1998).
However, the geometry of the flow in C15 is qualitatively different, and does not share the same narrow cone shaped structure as M82 and other local starburst galaxies (as far as can be discerned from our data). It is tempting to suggest that star formation is sufficiently vigorous that the wind is being driven from across the whole galaxy disk, rather than just by the nuclear star burst as seen in M82; but examination of the observed morphology of C15 does not suggest a simple disk galaxy, and so a direct morphological comparison is, perhaps, inappropriate.
5 Conclusions
We have used the SAURON panoramic integral field spectrograph to study the structure of the Ly- emission-line halo surrounding the sub-millimetre galaxy SMM J221726+0013. The emission halo can be traced out to almost from the sub-millimetre source, and the two nearby Lyman-break galaxies are shown to have kinematically distinct emission-line haloes of their own. The main features that we can discern are:
-
•
The emission line profile around the central sub-mm source is broad, . While the line profile varies significantly around the sub-mm source, the is no coherent variation in the line centroid.
-
•
Ly- emission appears suppressed in the immediate vicinity of the sub-mm source.
-
•
The Ly-break galaxies C15 and C11 appear to be associated with enhancements in the emission. These “mini-haloes” show significant velocity shear.
If we interpret the broad width of the emission line as being due to velocity motion of individual gas clouds, we infer line of sight velocities of , suggesting a dark halo mass of as expected for a small cluster. We compare the emission halo to the emission filaments surrounding NGC 1275, the central galaxy of the Perseus cluster. The chaotic velocity structure and the extent of the emission are similar, although the Ly- luminosity of LAB1 is two orders of magnitude larger. Combined with the lack of coherent velocity shear and the high ratio of the Ly- and X-ray flux, the comparison leads us to speculate that the emission halo of SMM J221726+0013 is powered by the interaction between cooling gas and a relatively weak outflow from the central source. Our data do not distinguish whether this flow is driven by vigorous star formation or by a heavily obscured AGN. It is clear, however, this interpretation needs to be confirmed by combining radiative transfer models with realistic simulations of massive galaxy formation in the early universe.
The structure of emission halo suggests a cavity around SMM J221726+0013. While one possible explanation is that this region has been filled with hot, completely ionised material, the dip in the emission may equally be explained because of dust obscuration in the material ejected from the sub-millimeter source.
The “mini-haloes” around the two Lyman-break galaxies in the field (C11 and C15) show clear velocity shear across their emission haloes. The structure appears to be consistent with a bipolar outflow of material, similar to that seen in the star-bursting dwarf galaxy M82. If the material is an outflow, the deprojected velocity of the flow is , less than the velocity inferred for the outflow from M82, and less than the outflow velocities inferred by Pettini et al. (1998, see also Teplitz et al., 2000 and Pettini et al. 2000, 2001) from comparison of the redshifts of Ly- and nebular emission lines in the rest-frame optical.
These observations break new ground for the SAURON instrument. Although it was designed to study the dynamics and stellar populations of nearby elliptical galaxies, we have shown that it can very effectively be used to study low surface brightness emission features only detectable in long integrations. It is interesting to speculate how far this powerful technique can be taken. On the one hand it is key to establish whether the diversity of structure seen in SSA22 LAB1 is a generic property of other highly luminous sub-mm galaxies, or whether the deep potential well of the SSA22 super-cluster is necessary to produce emission of this luminosity and extent. It will also be important to determine whether other Lyman-break galaxies show mini-halos similar to C15 (cf., Fynbo et al., 2002). The observations that we have presented provide a fore-taste of the deeper observations that will be made with integral field spectrographs on 8-m telescopes such as GMOS, (Davies et al. 1987), CIRPASS (Parry et al. 2000) and SPIFFI (Eisenhauer et al. 2000, see Bunker et al., 2004 for a recent review). Of particular interest is the combination of large telescope aperture and relatively wide field that is offered by VIMOS (Le Fèvre et al., 2000) and the planned MUSE integral field spectrograph (Hénault et al., 2003). These instruments will open the way for deep blank-field surveys of emission-line galaxies in the high redshift universe.
Acknowledgements
We thank the SAURON instrument team for their support of this programme, and for creating an instrument with the superb sensitivity of SAURON. It is a pleasure to thank the ING staff, in particular Rene Rutten, Tom Gregory and Chris Benn, for enthusiastic and competent support on La Palma. The construction of SAURON was made possible through grants 614.13.003 and 781.74.203 from ASTRON/NWO and financial contributions from the Institut National des Sciences de l’Univers, the Université Claude Bernard Lyon-I, the universities of Durham and Leiden, the British Council, PPARC grant ‘Extragalactic Astronomy & Cosmology at Durham 1998-2002’ and the Netherlands Research School for Astronomy NOVA. RGB is pleased to acknowledge the support of fellowships from PPARC and the Leverhulme foundation.
References
- [1] Adelberger, K., Steidel, C., Shapley A.E., Pettini M., ApJ, 584 45
- [2] Bacon R., et al., 2001, MNRAS, 326, 23
- [3] Balogh M. L., Pearce F. R., Bower R. G. & Kay S., 2001, MNRAS, 326, 1228
- [4] Benson A. J., Bower R. G., Frenk C. S., Lacey C. G., Baugh C. M., Cole S., 2003, ApJ, 599, 38
- [5] Bruggen M., Kaiser C., 2003, Nature, 418, 301
- [6] Bunker A. J., Smith J. K., Parry I. R. et al., 2003, Astr. Nach., in press (astro-ph/0401002).
- [7] Cen R. & Ostriker J. P., 1999, ApJ, 514, 1
- [8] Chapman S., Lewis G., Scott D., et al., 2001, ApJ, 548, 17
- [9] Chapman S., Scott D., Windhorst R., Frayer D., Borys C., Lewis G., 2003, in prep.
- [10] Conselice C. J., Gallagher J.S., Wyse R.F.G., 2001, AJ, 122, 2281
- [11] Cowie L. L., Fabian A. C., Nulsen P. E. J., 1980, MNRAS, 191, 399
- [12] Davies R. L. et al., 1987, SPIE, 2871, 1099
- [13] de Zeeuw T. et al., 2002, MNRAS, 329 513
- [14] Devine D., Bally J., 1999, ApJ, 510, 197
- [15] Eales S. et al., 1999, ApJ, 515, 518
- [16] Eisenhauer F., Tecza M., Mengel S., Thatte N. A., Roehrle C., Bickert K., Schreiber J., 2000, SPIE, 4008, 289
- [17] Fabian A. C., Sanders J. S., Crawford C. S., Conselice C. J., Gallagher J. S., Wyse R. F. G., astro-ph/0306039
- [18] Fardal M. A., Katz N., Gardner J. P., Hernquist L., Weinberg D. H., Davé R., 2001, ApJ, 562, 605
- [19] Fynbo J. P. U., Moller P., Thomsen B., et al., 2002, A&A, 388, 425
- [20] Henault F. et al., 2003, SPIE, 4841, 1096
- [21] Johnstone R. M., Fabian A. C., 1988, MNRAS, 233, 581
- [22] Le Fevre O. et al., 2000, SPIE, 3355, 8
- [23] Meinköhn, E., Richling S., 2002, A&A, 392, 827
- [24] Navarro J. F., Frenk C. S., White S. D. M., 1997, ApJ, 490, 493
- [25] Ohyama Y., et al., 2003, ApJ, 591, L9
- [26] Parry I. R., Mackay C. D., Johnson R. A., et al., 2000, SPIE, 4008, 1193
- [27] Pettini M., Kellog M., Steidel C. S., Dickinson M., Adelberger K., Giavalisco M., 1998, 508, 539
- [28] Pettini M., Steidel C. S., Adelberger K., Dickinson M., Giavalisco M., 2000, ApJ, 528, 96
- [29] Pettini M., Shapley A. E., Steidel C. C., Cuby, J.-G., Dickinson M., Moorwood A. F. M., Adelberger K., Giavalisco M., ApJ, 554, 981
- [30] Reuland M., van Breugel W., Rottgering H., et al., 2003, ApJ, 592, 755
- [31] Shopbell P.L., Bland-Hawthorn J., 1998, ApJ, 493, 129
- [32] Smail I., Ivison R., Blain W.A., Kneib J.-P., 2002, MNRAS, 331, 495
- [33] Springel V., Hernquist L., 2003, 339, 312
- [34] Steidel, Giavalisco, Dickinson, Adelberger, 1996, ApJ, 462, L17
- [35] Steidel C. C., Adelberger K. L., Dickinson M., Giavalisco M., Pettini M., Kellogg M., 1998, ApJ, 492, 428
- [36] Steidel, Adelberger, Shapley, Pettini, Dickinson, Giavalisco, 2000, ApJ ,532, 170
- [37] Teplitz H.I., McLean I.S., Becklin E.E., 2000, ApJ, 533, L63
- [38] van Breugel W., Reuland M., de Vries W., et al., 2002, astro-ph/0209173
- [] White S. D. M., Rees M. J., 1978, MNRAS, 183, 341
- [39] Willott C.J., Rawlings S., Archibald E.N., Dunlop J.S., 2002, MNRAS, 331, 435