The GEMS project: X-ray analysis and statistical properties of the group sample
Abstract
The GEMS project involves a multi-wavelength study of a sample of 60 galaxy groups, chosen to span a wide range of group properties. Substantial ROSAT PSPC observations, available for all of these groups, are used to characterise the state of the intergalactic medium in each. We present the results of a uniform analysis of these ROSAT data, and a statistical investigation of the relationship between X-ray and optical properties across the sample. Our analysis improves in several respects on previous work: (a) we distinguish between systems in which the hot gas is a group-scale medium, and those in which it appears to be just a hot halo associated a central galaxy, (b) we extrapolate X-ray luminosities to a fixed overdensity radius () using fitted surface brightness models, in order to avoid biases arising from the fact that cooler systems are detectable to smaller radii, and (c) optical properties have been rederived in a uniform manner from the NASA Extragalactic Database, rather than relying on the data in the disparate collection of group catalogues from which our systems are drawn.
The steepening of the - relation in the group regime reported previously is not seen in our sample, which fits well onto the cluster trend, albeit with large non-statistical scatter. A number of biases affect the fitting of regression lines under these circumstances, and until the impact of these has been thoroughly investigated it seems best to regard the slope of the group - relation as being poorly determined. A significant problem in comparing the properties of groups and clusters is the derivation of system radii, to allow different systems to be compared within regions having the same overdensity. We find evidence that group velocity dispersion () provides a very unreliable measure of system mass (and hence radius), with a number of groups having remarkably low values of , given that they appear from their X-ray properties to be collapsed systems. We confirm that the surface brightness profiles of groups are significantly flatter than those of clusters – the maximum value of the parameter for our sample is 0.58, lower than the typical value of 0.67 seen in clusters – however, we find no significant tendency within our sample for cooler groups to show flatter profiles. This result is inconsistent with simple universal preheating models. The morphology of the galaxies in the GEMS groups is correlated to their X-ray properties in a number of ways: we confirm the very strong relationship between X-ray emission and a dominant early-type central galaxy which has been noted since the early X-ray studies of groups, and also find that spiral fraction is correlated with the temperature of the hot gas, and hence the depth of the gravitational potential. A class of spiral-rich groups with little or no X-ray emission, probably corresponds to groups which have not yet fully collapsed.
keywords:
X-rays: galaxies: clusters - galaxies: clusters: general - galaxies: general - galaxies: intergalactic medium - galaxies: formation - galaxies: evolution1 Introduction
The principle that we are nowhere special, which is fundamental to cosmology, also applies to galaxies. The majority of galaxies are, like our own, located within bound systems, mostly containing just a handful of bright galaxies (Tully, 1987). These are characterised as galaxy groups, which are distinguished rather arbitrarily from richer and rarer galaxy clusters. These systems are evolving, as they turn round from the Hubble expansion, virialise, and grow through mergers and accretion. This dynamical evolution modifies the environment of their constituent galaxies, and can in turn have profound effects on the evolution of the galaxies themselves. On the other hand, energetic galaxy winds can have a substantial impact on the surrounding intergalactic medium (IGM) within groups and clusters (e.g Ponman, Cannon & Navarro, 1999), so that there is a two-way interaction between the structure of galaxies and galaxy systems. The picture which emerges is that galaxies and the systems in which most of them are located co-evolve, and a full understanding of the evolution of either galaxies or galaxy clusters must take into account the two-way interactions which couple the development of both.
Galaxy groups have received far less attention from astronomers than either galaxies or galaxy clusters, and their properties are clearly very diverse, in terms of structure, dynamics and the types of galaxies they contain (Hickson, 1997; Zabludoff & Mulchaey, 1998; Mulchaey, 2000). Any meaningful study of the relationship between groups and galaxies needs to acknowledge this fact. We have therefore commenced a study of the properties of a substantial sample of 60 galaxy groups, and the galaxies they contain, with a view to clarifying the different stages of group evolution, and the ways in which this is related to galaxy properties. This GEMS (Group Evolution Multi-wavelength Study) project involves optical photometry and spectroscopy to study the galaxies, radio observations to explore the HI content of galaxies and to look for cool intergalactic gas, and X-ray studies to probe the hot gas which dominates the baryonic content of at least some galaxy groups, and also provides a valuable indicator that a group is truly a dense system in 3-dimensions.
Given the value of X-ray data, all groups in our sample have been selected to have high quality ROSAT observations available – though we have not selected only groups which are detected in the X-ray. The present paper describes the analysis of these ROSAT PSPC data, and the properties derived from them, and combines these with other properties of these systems and their galaxies drawn from the literature, and in particular from the NASA-IPAC Extragalactic Database (NED). There have been a number of previous studies of samples of galaxy groups based primarily on pointed ROSAT observations (e.g. Pildis, Bregman & Evrard 1995; Mulchaey et al. 1996; Ponman et al. 1996; Mulchaey & Zabludoff 1998; Helsdon & Ponman 2000a, b; Mulchaey et al. 2003).
The present work improves on these in a number of respects:
-
•
it is one of the largest samples for which the X-ray data have been analysed in a uniform manner,
-
•
it includes systems with low X-ray luminosity, and some which are entirely undetected in the X-ray,
-
•
systems showing intergalactic X-ray emission have been distinguished from those in which the X-ray emitting gas appears to constitute only hot halo associated with the central galaxy,
-
•
galaxy membership and internal velocity dispersion of the groups have been rederived in a consistent way, using NED data and a sigma-clipping approach, within a projected overdensity radius,
-
•
fitted models have been used to extrapolate X-ray luminosity to a fixed overdensity radius, to compensate for systematic trends with temperature in the radial extent to which X-ray data are available.
The only other studies which share some (but not all) of these features, are those of Helsdon & Ponman (2000a, b) and Mulchaey et al. (2003), with which we make a number of comparisons below.
Throughout this paper we use = 70 , and all errors correspond to 1.
2 The Sample
We have sought to assemble the largest sample of galaxy groups for which an X-ray analysis can be performed. We have therefore compiled a list of 4320 groups from 10 optical catalogues (Hickson 1982; Huchra & Geller 1982; Geller & Huchra 1983; Fouque et al. 1992; Garcia 1993; Nolthenius 1993; Barton et al. 1996; Ramella, Pisani & Geller 1997; Giudice 1999; White et al. 1999) and compared it to the ROSAT PSPC observation log. Groups with a recessional velocity in the range 1000 3000 were then selected from this list if there was a PSPC pointing with t 10000 s, within 20′ of the group position. This was to ensure the availability of good quality ROSAT data and that the system was neither so close as to overfill the PSPC field of view nor so distant as to make an X-ray detection unlikely.
Duplicate entries resulting from the overlap between catalogues were removed, along with 7 groups in or around the Hydra and Virgo clusters. One further system, NGC 7552 (drawn from Huchra & Geller (1982)), was excluded after a calculation of the optical membership described in Section 3 revealed that, although the catalogued group position adhered to all of the above criteria, the group galaxies are all located at radii 20′ from the ROSAT PSPC pointing, so that none of them actually lie within the mirror shell support ring of the PSPC.
To the resulting sample of 45 selected groups, we added a further 13 which had previously been studied with the PSPC by Helsdon & Ponman (2000a), who in turn assembled their sample from those of Nolthenius (1993); Ledlow et al. (1996); Mulchaey & Zabludoff (1998), and two additional Hickson compact groups (HCG 4 and HCG 40) for which we had collected useful optical data. The resulting ensemble of groups is clearly not a true statistical sample, but is chosen to represent a wide range of group properties.
Details of the full sample of 60 groups can be found in Table 1, where the names given are taken from the optical catalogues which have been used, and generally (apart from the Hickson compact groups) correspond to the name of a prominent galaxy within the group. The group positions given in Table 1, were defined in the following way: (a) where X-ray emission is present (i.e. most cases) the position is that of the galaxy most centrally located within this emission, (b) where no X-rays are detected, the catalogued group position was used. Note that, following these rules, group positions do not always correspond to the location of the galaxy whose name appears in the first column of Table 1.
We have further segregated our sample into 3 subsamples according to the presence and nature of their X-ray emission, since it is important to distinguish between emission which is genuinely intergalactic, and that which appears to be associated with the halo of an individual galaxy. It has been shown that the emission from X-ray bright groups is typically characterised by a two-component surface brightness profile (Mulchaey & Zabludoff, 1998), where the extended component corresponds to the group emission, and the central component to either the central galaxy, or a bright group core. Therefore, the presence of two such components confirms that a group contains intergalactic hot gas. Unfortunately, poor statistics can often make fitting a two-component model difficult, even if the distribution is truly two-component, and in such cases a one-component model may be all that is available. Hence some other criterion is required, which can discriminate between group-scale and galaxy halo emission, even in the case of poor quality data. Two simple criteria were investigated: the detectable extent of group emission (, Section 4.1), and the ratio of X-ray luminosity, to the luminosity of the central BGG (). The former was found to give more satisfactory results, in that a simple threshold in of 60 kpc was found to result in the classification all two-component systems as X-ray groups. We therefore assumed that any systems with one-component fits, which had emission more extensive than 60 kpc, also possessed intergalactic gas, but that poor quality data did not permit a two-component fit.
The implication of our extension threshold, is that individual galaxies should not have X-ray halos extending to more than 60 kpc in radius. To check this, it would be useful to compare our threshold value of with the radii derived from a sample of isolated early-type galaxies (late-type galaxies have much less extended hot gas halos). Unfortunately, isolated early-type galaxies are rare, and very few have been studied with X-ray instruments. O’Sullivan et al. (2003) studied ROSAT data from a sample of 39 early-type galaxies, of which 8 were neither BGGs, nor brightest cluster galaxies. The X-ray radii of these galaxies ranged from 3 to 9 kpc - much smaller than our threshold. A recent study, by O’Sullivan & Ponman (2004), of a rather X-ray bright isolated elliptical galaxy, NGC 4555, detected emission extending to just 60 kpc. Hence this would have (just) been correctly classified by our extension criterion.
As a further check, we also examined for all groups, and found one case in which we felt that our extension criterion had failed. In HCG 22, the X-ray emission is centred on a rather faint elliptical ( = 109.29 ), and the BGG lies outside the main X-ray emitting region. Using this dimmer central galaxy to calculate , results in a value of 1031.39 , which is significantly higher than the maximum value for any other galaxy halo system ( = 1030.75 ). We have therefore altered the classification of this system from galaxy halo to group emission, to reflect its high value of , relative to its optically dim central galaxies.
Finally, groups with an X-ray flux (, Section 4.2) less than 3 above the background level, have been classed as X-ray undetected groups. We therefore have the following 3 subsamples:
-
•
G-sample: 37 groups (36 with 60 kpc + HCG 22)
-
•
H-sample: 15 groups with 60 kpc
-
•
U-sample: 8 groups with bg + 3(bg)
Selection effects in our sample originate from the requirement to have ROSAT archive data available, the velocity cut we have used, and the sample of Helsdon & Ponman (2000a) from which a large fraction of our groups have been taken. It is not clear what biasing is inherent in the ROSAT pointing agenda. Some of our targets were observed serendipitously by ROSAT, which reduces any bias involved, but most were the subject of direct pointed observations. Our sample should therefore be viewed as diverse (and in particular it is not restricted to X-ray bright systems) rather than statistically representative. Details of the 60 groups in our full sample are given in Table 1.
| Group | Catalogue | |||||
|---|---|---|---|---|---|---|
| Name | (J2000) | (J2000) | () | () | ||
| HCG 4 | 00 34 13.8 | -21 26 21 | 8394 | n/a | 5 | Hickson (1982) |
| NGC 315 | 00 57 48.9 | +30 21 09 | 4920 | 122 | 4 | *Nolthenius (1993) |
| NGC 383 | 01 07 24.9 | +32 24 45 | 5190 | 466 | 29 | *Ledlow et al. (1996) |
| NGC 524 | 01 24 47.8 | +09 32 19 | 2632 | 167 | 9 | Garcia (1993) |
| NGC 533 | 01 25 31.3 | +01 45 33 | 5430 | 464 | 36 | *Mulchaey & Zabludoff (1998) |
| HCG 10 | 01 25 40.4 | +34 42 48 | 4827 | 240 | 4 | Hickson (1982) |
| NGC 720 | 01 53 00.4 | -13 44 18 | 1760 | 162 | 4 | Garcia (1993) |
| NGC 741 | 01 56 21.0 | +05 37 44 | 5370 | 432 | 41 | *Mulchaey & Zabludoff (1998) |
| HCG 15 | 02 07 37.5 | +02 10 50 | 6835 | 457 | 6 | Hickson (1982) |
| HCG 16 | 02 09 24.7 | -10 08 11 | 3957 | 135 | 4 | Hickson (1982) |
| NGC 1052 | 02 41 04.8 | -08 15 21 | 1477 | 93 | 14 | Garcia (1993) |
| HCG 22 | 03 03 31.0 | -15 41 10 | 2700 | 13 | 5 | Hickson (1982) |
| NGC 1332 | 03 26 17.1 | -21 20 05 | 1499 | n/a | n | Barton et al. (1996) |
| NGC 1407 | 03 40 11.8 | -18 34 48 | 1695 | 151 | 8 | Garcia (1993) |
| NGC 1566 | 04 20 00.6 | -54 56 17 | 1292 | 99 | 6 | Garcia (1993) |
| NGC 1587 | 04 30 39.9 | +00 39 43 | 3660 | 106 | 4 | *Nolthenius (1993) |
| NGC 1808 | 05 07 42.3 | -37 30 46 | 1141 | 213 | 6 | Giudice (1999) |
| NGC 2563 | 08 20 35.7 | +21 04 04 | 4890 | 336 | 29 | *Mulchaey & Zabludoff (1998) |
| HCG 40 | 09 38 54.5 | -04 51 07 | 6685 | 162 | 6 | Hickson (1982) |
| HCG 42 | 10 00 14.2 | -19 38 03 | 3840 | 240 | 4 | Hickson (1982) |
| NGC 3227 | 10 23 30.6 | +19 51 54 | 1407 | 118 | 4 | Ramella et al. (1997) |
| HCG 48 | 10 37 49.5 | -27 07 18 | 2818 | 355 | 4 | Hickson (1982) |
| NGC 3396 | 10 49 55.2 | +32 59 27 | 1578 | 96 | 6 | Garcia (1993) |
| NGC 3557 | 11 09 57.4 | -37 32 17 | 2635 | 377 | 11 | Garcia (1993) |
| NGC 3607 | 11 16 54.7 | +18 03 06 | 1232 | 245 | 10 | Ramella et al. (1997) |
| NGC 3640 | 11 21 06.9 | +03 14 06 | 1260 | 178 | 6 | Garcia (1993) |
| NGC 3665 | 11 24 43.4 | +38 45 44 | 2076 | 65 | 5 | Garcia (1993) |
| NGC 3783 | 11 39 01.8 | -37 44 19 | 2819 | 169 | 4 | Giudice (1999) |
| HCG 58 | 11 42 23.7 | +10 15 51 | 6206 | 178 | 5 | Hickson (1982) |
| NGC 3923 | 11 51 02.1 | -28 48 23 | 1376 | 103 | 5 | Garcia (1993) |
| NGC 4065 | 12 04 06.2 | +20 14 06 | 7050 | 495 | 9 | *Ledlow et al. (1996) |
| NGC 4073 | 12 04 27.0 | +01 53 48 | 6120 | 607 | 22 | *Ledlow et al. (1996) |
| NGC 4151 | 12 10 32.6 | +39 24 21 | 1358 | 95 | 3 | Ramella et al. (1997) |
| NGC 4193 | 12 13 53.6 | +13 10 22 | 2695 | 168 | 4 | Nolthenius (1993) |
| NGC 4261 | 12 19 23.2 | +05 49 31 | 2355 | 120 | 18 | Garcia (1993) |
| NGC 4325 | 12 23 06.7 | +10 37 16 | 7560 | 256 | 18 | *Mulchaey & Zabludoff (1998) |
| NGC 4589 | 12 21 45.0 | +75 18 43 | 2027 | 147 | 11 | Garcia (1993) |
| NGC 4565 | 12 36 20.8 | +25 59 16 | 1245 | 62 | 3 | Giudice (1999) |
| NGC 4636 | 12 42 50.4 | +02 41 24 | 1696 | 475 | 12 | Nolthenius (1993) |
| NGC 4697 | 12 48 35.7 | -05 48 03 | 1363 | 241 | 7 | Giudice (1999) |
| NGC 4725 | 12 50 26.6 | +25 30 06 | 1495 | 17 | 4 | Ramella et al. (1997) |
| HCG 62 | 12 53 05.8 | -09 12 16 | 4380 | 324 | 4 | Hickson (1982) |
| NGC 5044 | 13 15 24.0 | -16 23 06 | 2460 | 129 | 9 | Garcia (1993) |
| NGC 5129 | 13 24 10.0 | +13 58 36 | 6960 | 294 | 33 | *Mulchaey & Zabludoff (1998) |
| NGC 5171 | 13 29 21.6 | +11 44 07 | 6960 | 424 | 8 | *Ledlow et al. (1996) |
| HCG 67 | 13 49 11.4 | -07 13 28 | 7345 | 240 | 4 | Hickson (1982) |
| NGC 5322 | 13 49 15.5 | +60 11 28 | 2106 | 176 | 8 | Garcia (1993) |
| HCG 68 | 13 53 26.7 | +40 16 59 | 2400 | 170 | 5 | Hickson (1982) |
| NGC 5689 | 14 34 52.0 | +48 39 36 | 2226 | n/a | 3 | White et al. (1999) |
| NGC 5846 | 15 06 29.2 | +01 36 21 | 1890 | 368 | 20 | *Mulchaey & Zabludoff (1998) |
| NGC 5907 | 15 15 53.9 | +56 19 46 | 1055 | 56 | 4 | Geller & Huchra (1983) |
| NGC 5930 | 15 26 07.9 | +41 40 34 | 2906 | 70 | 3 | Ramella et al. (1997) |
| NGC 6338 | 17 15 22.9 | +57 24 40 | 8490 | 589 | 7 | *Ledlow et al. (1996) |
| NGC 6574 | 18 12 00.7 | +14 02 44 | 2435 | 34 | 4 | Garcia (1993) |
| NGC 7144 | 21 52 42.9 | -48 15 16 | 1855 | 105 | 5 | Garcia (1993) |
| HCG 90 | 22 02 08.4 | -31 59 30 | 2640 | 110 | 4 | Hickson (1982) |
| HCG 92 | 22 35 58.4 | +33 57 57 | 6446 | 447 | 5 | Hickson (1982) |
| IC 1459 | 22 57 10.6 | -36 27 44 | 1707 | 144 | 5 | Garcia (1993) |
| NGC 7714 | 23 36 14.1 | +02 09 19 | 2908 | 152 | n/a | Fouque et al. (1992) |
| HCG 97 | 23 47 22.9 | -02 18 02 | 6535 | 407 | 5 | Hickson (1982) |
3 Optical Properties
Our groups have been assembled from a large number of catalogues, and in order to reduce the inhomogeneity in our optical data, we have rederived their galaxy membership in a uniform manner. Group galaxies were selected from the NASA-IPAC Extragalactic Database (NED) using the algorithm described below, and optical properties such as total B-band luminosity, morphological type, velocity and position were extracted. There will however remain a degree of inhomogeneity in the NED data, due to the range of sources from which the NED data have been compiled. We discuss some checks on the effects of this heterogeneity, later in this section.
For each group we have searched NED for galaxies within a projected radius of the group position, defined above, and in a velocity range of 3. Values of were calculated from temperature (, Section 4.2) using a relation derived from simulations by Evrard, Metzler & Navarro (1996),
| (1) |
where is the temperature in keV and is the Hubble constant in . Where no value of was available, a relation between and was derived using Equation 1 and a regression fit in the - plane for the systems with group-scale emission (Section 4.3),
| (2) |
A value of can also be estimated from galaxy velocity dispersion, using the virial theorem. Assuming energy equipartition between gas and galaxies (i.e. = 1, see Section 4.2), Equation 1 can be rewritten in terms of ,
| (3) |
where is the velocity dispersion in . However we find evidence that this method is unreliable at low values of , as discussed in Section 6.
Starting values of and were taken from the respective catalogues. It has been shown that a virialised group should have 100 (Mamon, 1994), and as such we have constrained our starting value of to be no less than this. In cases where no value of velocity dispersion was available from the source catalogue we have used 200 .
Optical data resulting from the galaxy extraction were used to recalculate and , where
| (4) |
and the updated values used to redefine our search criteria. The denominator includes a correction for the effects of biasing in systems with a small number of galaxies (Helsdon & Ponman, 2004). The selection and recalculation were then repeated until the values of and became stable. If the final number of galaxies within a group was less than 3, then the membership calculation was repeated with the starting value of set to 200 . Distances () were calculated from velocities after correcting for infall into Virgo and the Great Attractor.
For two of our systems it was necessary to adjust the membership calculation in order to reduce contamination from nearby clusters. NGC 4261 is in the vicinity of two clusters (WBL 392 & WBL 397) and to prevent the from increasing to include cluster galaxies, we have used only one iteration of the membership calculation. HCG 48 is falling into the cluster Abell 1060, and to reduce contamination we have used a group radius equivalent to the distance away of the minimum in the galaxy density distribution between the centre of the two systems.
We improve the completeness of our sample by applying a luminosity cut to the optical selection. The value of luminosity was chosen so as to include 90% of the B-band luminosity of the galaxy population, as described by a Schechter function of the form:
| (5) |
where is the galaxy luminosity and () is the number of galaxies with a luminosity between and + per . Free parameters are the slope at the faint end (), the characteristic Schechter luminosity () and the normalisation (). We have taken values of and from Zabludoff & Mulchaey (2000), and applied a correction of B-R = 1.57 to convert from R-band to B-band magnitudes (Fukugita, Shimasaku & Ichikawa, 1995) giving = -1.3, = 1.601010 , and a minimum luminosity of = 5.28108 (corresponding to = -16.32). We investigate the completeness obtained by applying this cut in our comparison with Miles et al. (2004) below. The assumed value of B-R is appropriate for early-type galaxies, and in the case of late types, it will typically result in a luminosity cut which is too low by about 0.5 magnitudes. However, no correction has been applied for the effects of extinction on our galaxy magnitudes, and for typical spirals this amounts to 0.5 in the B-band. Hence the two effects approximately cancel, and our galaxy membership cut should be reasonably accurate.
We have applied this cut following the membership calculation, and as such it does not affect the calculated values of and , which are based on the full sample of galaxies associated with each group. Data surviving the cut were used to calculate total optical luminosity , corrected for the effect of the magnitude cut, spiral fraction by number, , and mean galaxy density, , assuming a spherical volume of radius . The brightest galaxy within 0.25 of the the group position was designated as the brightest group galaxy (BGG) and its luminosity () was divided by the luminosity of the second brightest galaxy to define the dominance of the BGG (). The results of the membership calculation are shown in Table 2. The number of galaxies () is quoted both before and after the luminosity cut. Systems with 4 before the luminosity cut have been excluded from the statistical analysis, on the grounds that (a) many of the optical properties of interest to us are poorly defined for these systems, and (b) such very poor systems are quite likely to be line-of-sight projections, rather than genuinely overdense in 3-dimensions (Frederic, 1995). This richness cut excludes 6 groups, two of which have group-scale X-ray emission, but with statistical quality too poor to derive an X-ray temperature. These 6 systems are included in the main data tables, but are flagged with daggers in Tables 2, 3 and 4.
Hence our sample for statistical analysis in the present paper consists of 54 GEMS groups, which are divided into three subsets according to their X-ray properties. We refer to these below as the G-sample (35 systems) which have group-scale emission, the H-sample (13 systems) with galaxy halo emission, and the U-sample (6 systems) which are undetected in X-rays.
As discussed above, the optical data drwan from NED are inevitably inhomogeneous. To invesitigate the effects of this on our optical luminosities, we have compared our optical results to those of Miles et al. (2004), who obtained B-band photometry for a subset of 25 of the GEMS groups. Figure 1 shows a comparison between our galaxy luminosities and those of Miles et al. for each galaxy that appears in both samples. Assuming the Miles et al. data to be accurate, we find that our luminosities appear to be biased high (by 20%) for the brightest galaxies, and low (by 50%) for faint ones. However, agreement for = 10.20, where most of the total optical luminosity resides, is good, so that our estimates of total optical luminosity for groups should be substantially unbiased.
We also derive a luminosity function from our data using galaxies that are associated with groups in the Miles et al. subsample, and are situated within their extraction radii of r = 0.3. Figure 2 shows a comparison of this luminosity function with that derived by Miles et al. We find 81 galaxies above our luminosity cut of = -16.32 compared to the 90 found by Miles et al. Since it is clear from Figure 2 that the Miles et al. luminosity function is complete to a magnitude much fainter than our cut, we conclude that our sample is approximately 90% (81/90) complete, down to our cut.

A further check on the completeness of our sample close to the cut is obtained by comparing the total light in galaxies above two different cuts. Using Equation 5 we calculate the luminosity above which 50% of the optical light should lie, to be 1.341043 ( = -20.55). If our sample were complete to the 90% cut then we would expect the ratio of total light above the two cuts to be (90%)/(50%) = 1.8. In practice this ratio is found to be 1.9 for our data, suggesting that our completeness is still very high down to the 90% cut, under the assumption that our galaxy luminosity function is well represented by the adopted Schechter function.

| Group | ||||||||||||
|---|---|---|---|---|---|---|---|---|---|---|---|---|
| Name | () | () | (Mpc) | (Mpc) | () | (log ) | (log ) | |||||
| HCG 4† | 2 | 2 | 8138 146 | 207 207 | 115 | 0.36 | 10 7 | 10.85 | 0.50 | 10.73 | 5.45 | Late |
| NGC 315 | 5 | 4 | 5141 173 | 387 146 | 72 | 0.55 | 6 3 | 11.19 | 0.33 | 11.03 | 5.25 | Early |
| NGC 383 | 33 | 27 | 5174 8 | 450 57 | 73 | 0.69 | 20 4 | 11.54 | 0.20 | 10.56 | 1.22 | Early |
| NGC 524 | 10 | 10 | 2470 55 | 175 42 | 35 | 0.45 | 26 8 | 11.01 | 0.40 | 10.77 | 9.46 | Early |
| NGC 533 | 28 | 21 | 5413 3 | 439 60 | 76 | 0.58 | 25 6 | 11.52 | 0.55 | 10.99 | 1.14 | Early |
| HCG 10 | 5 | 5 | 4843 103 | 231 87 | 68 | 0.24 | 84 38 | 11.01 | 0.50 | 10.60 | 1.06 | Early |
| NGC 720 | 4 | 4 | 1640 136 | 273 122 | 23 | 0.40 | 15 7 | 10.55 | 0.50 | 10.46 | 23.55 | Early |
| NGC 741 | 33 | 15 | 5595 79 | 453 57 | 79 | 0.62 | 15 4 | 11.41 | 0.46 | 11.11 | 8.09 | Early |
| HCG 15 | 7 | 7 | 6742 153 | 404 122 | 95 | 0.54 | 11 4 | 10.85 | 0.43 | 10.26 | 1.15 | Early |
| HCG 16 | 7 | 6 | 3956 30 | 80 24 | 57 | 0.32 | 45 18 | 10.95 | 0.83 | 10.44 | 1.58 | Late |
| NGC 1052 | 5 | 4 | 1366 41 | 91 35 | 20 | 0.36 | 21 10 | 10.37 | 0.50 | 9.97 | 1.47 | Early |
| HCG 22 | 4 | 4 | 2599 13 | 25 11 | 39 | 0.29 | 40 20 | 10.57 | 0.25 | 10.42 | 9.12 | Early |
| NGC 1332 | 10 | 9 | 1489 59 | 186 45 | 23 | 0.42 | 29 10 | 10.55 | 0.56 | 10.06 | 1.42 | Early |
| NGC 1407 | 20 | 18 | 1682 71 | 319 52 | 26 | 0.57 | 24 6 | 11.05 | 0.33 | 10.74 | 5.55 | Early |
| NGC 1566 | 9 | 9 | 1402 61 | 184 47 | 21 | 0.47 | 21 7 | 11.27 | 0.33 | 10.70 | 1.43 | Late |
| NGC 1587 | 7 | 6 | 3671 43 | 115 35 | 55 | 0.55 | 9 4 | 11.07 | 0.40 | 10.60 | 1.10 | Early |
| NGC 1808 | 4 | 4 | 1071 52 | 104 47 | 17 | 0.32 | 29 15 | 10.73 | 1.00 | 10.35 | 1.11 | Late |
| NGC 2563 | 32 | 31 | 4688 68 | 384 49 | 73 | 0.57 | 39 7 | 11.45 | 0.53 | 10.63 | 1.80 | Early |
| HCG 40 | 6 | 6 | 6596 64 | 157 52 | 102 | 0.45 | 16 6 | 11.08 | 0.33 | 10.71 | 3.10 | Early |
| HCG 42 | 23 | 19 | 3801 59 | 282 43 | 64 | 0.48 | 40 9 | 11.33 | 0.36 | 10.95 | 5.40 | Early |
| NGC 3227 | 6 | 5 | 1265 69 | 169 56 | 27 | 0.34 | 29 13 | 10.80 | 0.80 | 10.60 | 3.02 | Late |
| HCG 48 | 4 | 2 | 2587 158 | 316 141 | 41 | 0.23 | 39 28 | 10.39 | 0.50 | 9.44 | n/a | Late |
| NGC 3396 | 12 | 11 | 1595 31 | 106 23 | 31 | 0.48 | 24 7 | 10.89 | 1.00 | 10.22 | 1.24 | Late |
| NGC 3557 | 14 | 11 | 2858 80 | 300 60 | 39 | 0.27 | 132 40 | 11.12 | 0.40 | 10.82 | 4.33 | Early |
| NGC 3607 | 13 | 11 | 1099 78 | 280 58 | 23 | 0.33 | 72 22 | 11.02 | 0.33 | 10.61 | 2.25 | Early |
| NGC 3640 | 8 | 7 | 1509 75 | 211 59 | 29 | 0.35 | 37 14 | 10.83 | 0.43 | 10.56 | 4.17 | Early |
| NGC 3665 | 4 | 3 | 2043 43 | 87 39 | 37 | 0.38 | 13 7 | 10.81 | 0.00 | 10.62 | 3.40 | Early |
| NGC 3783† | 1 | 1 | 2917 | n/a | 36 | 0.25 | n/a | 10.29 | 1.00 | 10.25 | n/a | Late |
| HCG 58 | 7 | 7 | 6269 70 | 184 55 | 98 | 0.51 | 12 5 | 11.23 | 0.67 | 10.59 | 1.18 | Late |
| NGC 3923 | 8 | 4 | 1764 85 | 239 66 | 22 | 0.40 | 15 7 | 10.80 | 0.50 | 10.54 | 2.58 | Early |
| NGC 4065 | 13 | 13 | 6880 125 | 450 94 | 106 | 0.62 | 13 4 | 11.57 | 0.31 | 10.81 | 1.41 | Early |
| NGC 4073 | 32 | 31 | 6042 100 | 565 72 | 96 | 0.69 | 22 4 | 11.70 | 0.13 | 11.19 | 4.57 | Early |
| NGC 4151 | 6 | 4 | 1023 42 | 102 34 | 23 | 0.29 | 38 19 | 10.62 | 1.00 | 10.31 | 1.29 | Late |
| NGC 4193 | 7 | 6 | 2159 76 | 202 61 | 39 | 0.39 | 24 10 | 10.93 | 0.83 | 10.11 | 3.02 | Late |
| NGC 4261 | 29 | 25 | 2332 37 | 197 27 | 41 | 0.64 | 23 5 | 11.47 | 0.21 | 10.86 | 2.17 | Early |
| NGC 4325 | 16 | 16 | 7632 94 | 376 70 | 117 | 0.51 | 29 7 | 11.06 | 0.20 | 10.61 | 1.53 | Early |
| NGC 4589 | 10 | 9 | 1640 90 | 284 69 | 29 | 0.43 | 26 9 | 10.69 | 0.67 | 10.15 | 1.25 | Early |
| NGC 4565† | 2 | 2 | 1318 50 | 71 71 | 27 | 0.34 | 13 9 | 10.93 | 1.00 | 10.87 | 27.04 | Late |
| NGC 4636 | 9 | 4 | 936 95 | 284 73 | 10 | 0.51 | 7 4 | 10.45 | 0.00 | 10.04 | 1.07 | Early |
| NGC 4697 | 6 | 5 | 1404 49 | 120 40 | 20 | 0.32 | 38 17 | 10.88 | 0.75 | 10.74 | 5.06 | Early |
| NGC 4725 | 4 | 2 | 1228 25 | 49 22 | 25 | 0.40 | 8 5 | 11.02 | 1.00 | 10.95 | 13.80 | Late |
| HCG 62 | 35 | 33 | 4291 71 | 418 51 | 74 | 0.67 | 26 5 | 11.50 | 0.33 | 10.54 | 1.20 | Early |
| NGC 5044 | 18 | 18 | 2518 100 | 426 74 | 33 | 0.62 | 18 4 | 11.18 | 0.31 | 10.50 | 1.43 | Early |
| NGC 5129 | 23 | 23 | 7012 71 | 342 52 | 108 | 0.51 | 40 8 | 11.54 | 0.60 | 11.05 | 2.31 | Early |
| NGC 5171 | 14 | 12 | 6924 132 | 494 99 | 107 | 0.58 | 15 4 | 11.28 | 0.00 | 10.76 | 2.65 | Early |
| HCG 67 | 10 | 10 | 7455 83 | 261 63 | 115 | 0.46 | 24 8 | 11.32 | 0.60 | 10.94 | 4.29 | Early |
| NGC 5322 | 5 | 3 | 2032 74 | 166 63 | 35 | 0.27 | 37 22 | 10.90 | 0.33 | 10.82 | 22.08 | Early |
| HCG 68 | 17 | 16 | 2407 46 | 191 34 | 41 | 0.43 | 50 12 | 11.41 | 0.67 | 10.64 | 1.19 | Early |
| NGC 5689 | 5 | 4 | 2240 36 | 80 30 | 38 | 0.26 | 57 29 | 10.48 | 0.75 | 9.51 | 1.74 | Late |
| NGC 5846 | 25 | 14 | 1866 69 | 346 51 | 30 | 0.48 | 30 8 | 11.24 | 0.27 | 10.72 | 1.57 | Early |
| NGC 5907 | 6 | 3 | 768 29 | 72 24 | 17 | 0.24 | 50 29 | 10.42 | 1.00 | 10.23 | 2.75 | Late |
| NGC 5930 | 4 | 4 | 2500 75 | 150 67 | 41 | 0.55 | 6 2 | 10.32 | 1.00 | 9.98 | 1.58 | Late |
| NGC 6338 | 37 | 36 | 8789 107 | 651 77 | 127 | 0.88 | 13 2 | 11.80 | 0.44 | 11.05 | 1.37 | Early |
| NGC 6574† | 2 | 1 | 2266 21 | 29 29 | 35 | 0.16 | 56 56 | 10.00 | 1.00 | 9.96 | n/a | Late |
| NGC 7144† | 2 | 2 | 1912 29 | 41 41 | 27 | 0.41 | 7 5 | 10.65 | 0.00 | 10.36 | 1.37 | Early |
| HCG 90 | 15 | 9 | 2559 34 | 131 25 | 36 | 0.38 | 39 13 | 10.87 | 0.62 | 10.37 | 1.60 | Early |
| HCG 92 | 5 | 5 | 6347 209 | 467 176 | 88 | 0.47 | 11 5 | 11.06 | 0.40 | 10.52 | 1.19 | Late |
| IC 1459 | 8 | 7 | 1835 79 | 223 62 | 26 | 0.35 | 39 15 | 10.93 | 0.86 | 10.62 | 3.40 | Early |
| NGC 7714† | 2 | 2 | 2784 20 | 28 28 | 39 | 0.22 | 48 34 | 10.30 | 1.00 | 10.17 | 4.70 | Late |
| HCG 97 | 14 | 14 | 6638 114 | 425 85 | 92 | 0.51 | 26 7 | 11.07 | 0.50 | 10.39 | 1.15 | Early |
4 X-ray Data Analysis
ROSAT PSPC datasets were prepared for analysis by first eliminating sources of contamination such as particle emission and solar X-ray emission scattered from the Earth’s atmosphere. Detectors aboard the spacecraft identify and exclude over 99% of these events and record them in a master veto file. Times for which this master veto rate exceeded 170 counts were considered significantly contaminated and excluded from our analysis. Further contamination from reflected solar X-rays can be identified by an increase in the total X-ray event rate. To remove this contamination we have excluded all times for which the total event rate exceeded the mean by greater than 2. The remaining counts were binned into a 3-dimensional x,y,energy data cube. Images were created by projecting the data cube along its energy axis, and smoothed images generated by convolving with a 2-dimensional Gaussian with = 0.05′.
The background for each dataset was estimated from an annulus, the radius of which was chosen so as to place it approximately in the region of lowest flux. Diffuse emission was removed from this annulus by extracting an azimuthal profile and masking regions with a number of counts greater than 4 above the mean. A background model could then be constructed and subtracted from the datasets.
Point sources within the image were found using maximum likelihood searching and removed to 1.2 times the 95% radius for 0.5 keV photons. The background subtraction and point source searching were then repeated until the same number of sources were found upon successive iterations. Extended sources such as background clusters were manually identified and removed to the radius at which their contribution became approximately equal to the surrounding emission. Extended emission co-incident with the BGG has been shown to exhibit properties which correlate with the properties of the surrounding group emission (Helsdon & Ponman, 2000a), and is hence best identified with the group rather than the central galaxy. We have therefore included any such emission in our analysis. Each exposure was further corrected for dead time effects, vignetting and the shadow formed by the mirror shell support ring, and finally divided by the exposure time to produce a map of spectral flux.
4.1 Spatial Analysis
On completion of the data reduction, a radial profile centred on the group position was examined, and the radius at which the group emission fell to the background level was used to define an extent radius (), and hence a radius () from within which X-ray data are extracted for analysis. The radii are given in Table 4. In the case of HCG 48, included emission from the nearby cluster Abell 1060 and we have therefore reduced to a value which only includes regions in which the group emission dominates over the cluster emission. In all other detected groups = . In cases where no emission was evident, an value of 50 kpc was used to calculate upper limits. The number of source counts within this region was then calculated by subtracting the background contribution, as predicted by the background model. In cases where the number of source counts was greater than 3 above background, the dataset was deemed to contain detected X-ray emission.
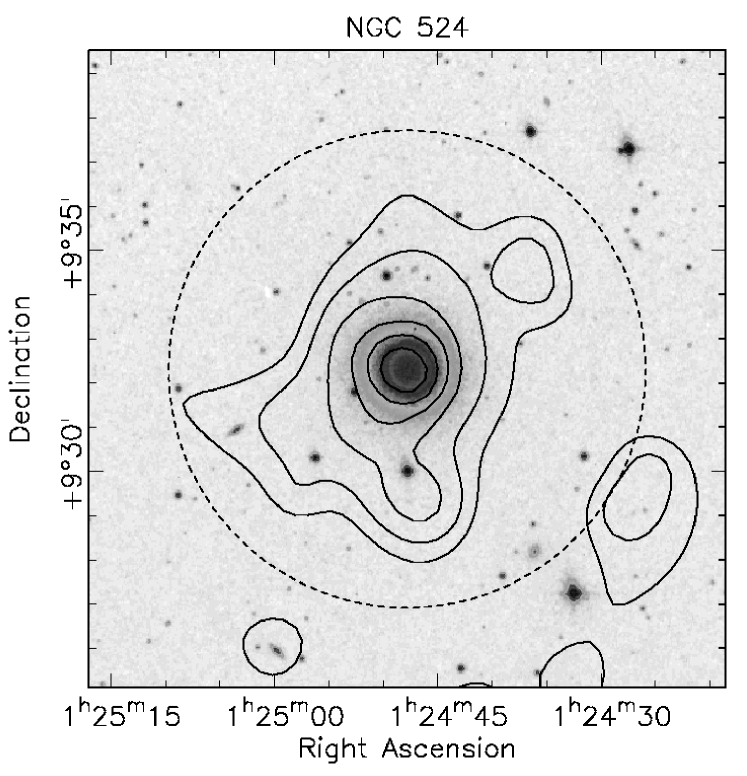
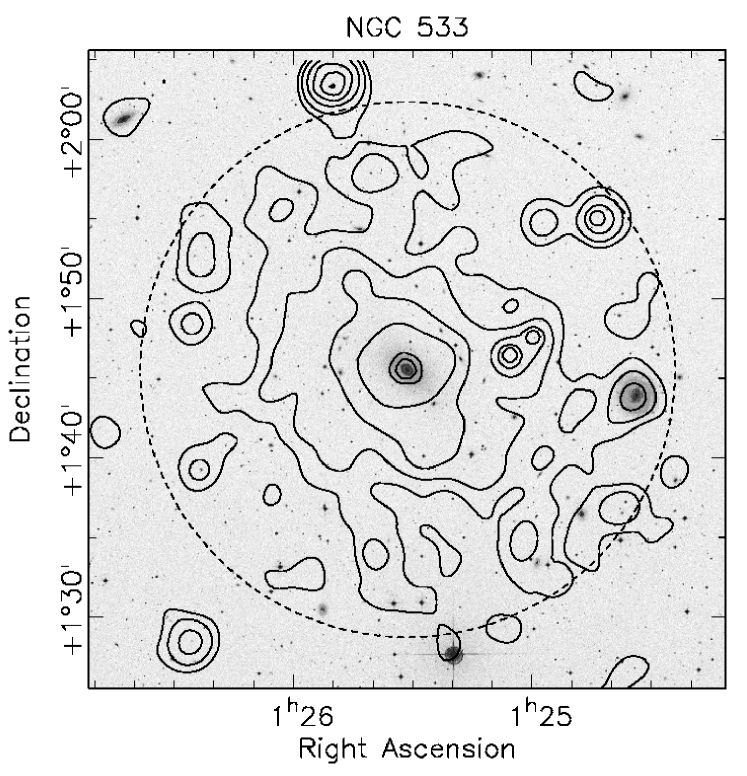
It was often useful during the course of this data reduction to examine images of the groups in question. Quantitative results, such as the emission radii calculated in Section 4, could be examined and confirmed using such images. We have therefore produced optical images, with X-ray contours overlaid, for all of the groups in our sample. Background variance maps were created assuming Poissonian statistics, smoothed in the usual way and divided into smoothed images to produce significance maps. Contours were drawn on at 5 sigma above the background (n = 0,1..10) and overlaid onto optical images taken from the Digitised Sky Survey (DSS). Figure 4 shows an X-ray/optical overlay of NGC 524 which has = 56 kpc (represented by the dashed circle) and as such is identified with emission from a galactic halo. NGC 533 (Figure 4) has = 372 kpc indicating group-scale emission.
We have sought to characterise the surface brightness properties of our sample of groups by fitting their emission with a 2-dimensional -model, of the form
| (6) |
It has been shown that fitting such a profile in one dimension can lead to an overestimate of the parameter in systems with particularly elongated or offset components (Helsdon & Ponman, 2000a). An image in the band 0.5 to 2 keV was extracted from all datasets containing a detection, and data outside removed. Remaining data were then fitted with a single component -model.
Models were convolved with the PSF at an energy determined from the mean photon energy of the data, and free parameters were the central surface brightness , core radius (), slope () and the co-ordinates of the centre of emission. We also allowed our fits to be elliptical by introducing the axis ratio () and position angle as additional free parameters.
In cases where a single component -model was inadequate in describing the emission, a second component was added to the model. Such an inadequacy was identified by examining a radial profile for each group in the G-sample, and looking for a shoulder in which the single -model significantly departed from the data. In marginal cases a fit using the two component model was attempted. In order to limit the number of free parameters in our two-component fits, we have fixed the axis ratio and position angle of the central component, thus constraining it to be circular.
Surface brightness models were used to correct bolometric fluxes for the removal of point sources and other contamination. For each group the fitted -model (two-component where available) was taken and used to generate a model image from which a count rate was extracted. Regions of contamination, as defined in Section 4, were then removed, and the reduced count rate combined with the original count rate to derive a correction factor for the luminosity. Groups with no fitted -model were corrected by taking an image with the regions removed and patching over the holes using a local mean. A correction factor was obtained and applied in the same way. Results of the spatial analysis are presented in Table 3.
| Group | Extended | Central | |||||
| Name | |||||||
| (kpc) | (kpc) | ||||||
| HCG 4† | n/a | n/a | n/a | n/a | n/a | ||
| NGC 315 | n/a | n/a | n/a | n/a | n/a | ||
| NGC 383 | 2.11 0.21 | 0.36 0.00 | 1.08 0.03 | 0.41 0.43 | 0.60 0.15 | ||
| NGC 524 | n/a | n/a | n/a | n/a | n/a | ||
| NGC 533 | 2.21 1.68 | 0.42 0.01 | 1.50 0.03 | 2.52 0.83 | 0.59 0.06 | ||
| HCG 10 | n/a | n/a | n/a | n/a | n/a | ||
| NGC 720 | 1.15 0.20 | 0.47 0.01 | 1.21 0.06 | n/a | n/a | ||
| NGC 741 | 2.30 0.18 | 0.44 0.01 | 1.30 0.09 | n/a | n/a | ||
| HCG 15 | n/a | n/a | n/a | n/a | n/a | ||
| HCG 16 | n/a | n/a | n/a | n/a | n/a | ||
| NGC 1052 | n/a | n/a | n/a | n/a | n/a | ||
| HCG 22 | 1.34 4.75 | 0.44 0.20 | 1.37 0.77 | n/a | n/a | ||
| NGC 1332 | 0.07 0.16 | 0.52 0.01 | 1.19 0.12 | n/a | n/a | ||
| NGC 1407 | 0.08 0.15 | 0.46 0.01 | 1.22 0.06 | n/a | n/a | ||
| NGC 1566 | n/a | n/a | n/a | n/a | n/a | ||
| NGC 1587 | 4.34 4.34 | 0.46 0.09 | 1.26 0.45 | n/a | n/a | ||
| NGC 1808 | n/a | n/a | n/a | n/a | n/a | ||
| NGC 2563 | 2.14 0.12 | 0.37 0.01 | 1.26 0.06. | n/a | n/a | ||
| HCG 40 | n/a | n/a | n/a | n/a | n/a | ||
| HCG 42 | 4.69 0.72 | 0.56 0.02 | 1.29 0.08 | n/a | n/a | ||
| NGC 3227 | 0.77 0.60 | 0.57 0.02 | 1.21 0.09 | n/a | n/a | ||
| HCG 48 | 1.20 1.56 | 0.48 0.02 | 1.62 0.30 | n/a | n/a | ||
| NGC 3396 | n/a | n/a | n/a | n/a | n/a | ||
| NGC 3557 | 1.13 0.21 | 0.52 0.03 | 1.93 0.34 | n/a | n/a | ||
| NGC 3607 | 1.98 0.93 | 0.39 0.02 | 2.06 0.18 | 5.16 2.73 | 0.60 0.21 | ||
| NGC 3640 | 0.08 0.19 | 0.43 0.05 | 2.31 0.84 | n/a | n/a | ||
| NGC 3665 | 1.08 1.31 | 0.47 0.03 | 1.67 0.40 | n/a | n/a | ||
| NGC 3783† | n/a | n/a | n/a | n/a | n/a | ||
| HCG 58 | n/a | n/a | n/a | n/a | n/a | ||
| NGC 3923 | 0.63 0.06 | 0.55 0.01 | 1.18 0.08 | n/a | n/a | ||
| NGC 4065 | 3.08 0.51 | 0.36 0.01 | 2.75 0.35 | 6.68 7.86 | 0.37 0.03 | ||
| NGC 4073 | 9.42 2.89 | 0.43 0.01 | 1.20 0.03 | 3.72 1.50 | 0.53 0.07 | ||
| NGC 4151 | n/a | n/a | n/a | n/a | n/a | ||
| NGC 4193 | n/a | n/a | n/a | n/a | n/a | ||
| NGC 4261 | 40.08 12.01 | 0.44 0.09 | 1.17 0.12 | 3.31 1.26 | 1.17 0.44 | ||
| NGC 4325 | 27.56 4.97 | 0.58 0.01 | 1.16 0.05 | n/a | 0.49 0.03 | ||
| NGC 4589 | 9.33 0.83 | 0.52 0.07 | 2.65 0.39 | 3.41 2.04 | n/a | ||
| NGC 4565† | n/a | n/a | n/a | n/a | n/a | ||
| NGC 4636 | 0.30 0.06 | 0.47 0.00 | 1.08 0.02 | 2.67 0.25 | 0.79 0.04 | ||
| NGC 4697 | 1.25 0.29 | 0.46 0.02 | 1.37 0.10 | n/a | n/a | ||
| NGC 4725 | n/a | n/a | n/a | n/a | n/a | ||
| HCG 62 | 2.44 0.26 | 0.48 0.01 | 1.12 0.03 | 10.75 0.60 | 1.00 0.05 | ||
| NGC 5044 | 5.96 0.16 | 0.51 0.00 | 1.04 0.01 | 11.04 0.66 | 0.80 0.06 | ||
| NGC 5129 | 3.14 1.71 | 0.43 0.02 | 1.18 0.18 | n/a | n/a | ||
| NGC 5171 | n/a | n/a | n/a | n/a | n/a | ||
| HCG 67 | 4.77 1.57 | 0.54 0.07 | 3.16 0.05 | n/a | n/a | ||
| NGC 5322 | n/a | n/a | n/a | n/a | n/a | ||
| HCG 68 | 5.97 3.43 | 0.45 0.05 | 1.63 0.07 | n/a | n/a | ||
| NGC 5689 | n/a | n/a | n/a | n/a | n/a | ||
| NGC 5846 | 2.19 0.26 | 0.51 0.01 | 1.13 0.04 | n/a | n/a | ||
| NGC 5907 | n/a | n/a | n/a | n/a | n/a | ||
| NGC 5930 | n/a | n/a | n/a | n/a | n/a | ||
| NGC 6338 | 3.72 0.98 | 0.44 0.01 | 1.30 0.05 | 10.32 4.35 | 0.86 0.34 | ||
| NGC 6574† | n/a | n/a | n/a | n/a | n/a | ||
| NGC 7144† | 0.77 1.41 | 0.45 0.03 | 5.03 3.65 | n/a | n/a | ||
| HCG 90 | 0.91 1.54 | 0.41 0.03 | 1.69 0.26 | 3.89 1.12 | 1.00 0.20 | ||
| HCG 92 | n/a | n/a | n/a | n/a | n/a | ||
| IC 1459 | 0.74 2.26 | 0.45 0.02 | 1.26 0.07 | n/a | n/a | ||
| NGC 7714† | n/a | n/a | n/a | n/a | n/a | ||
| HCG 97 | 2.73 3.06 | 0.44 0.01 | 1.53 0.13 | 4.31 1.22 | 0.50 0.03 | ||
4.2 Spectral Analysis
We have performed a spectral analysis for all pointings containing a detected galaxy group. A spectrum was obtained by removing all data outside , and projecting the cube along its spatial axes. Each spectrum was then fitted with a single component MEKAL hot plasma model (Mewe, Lemen & van den Oord, 1986), and a multiplicative absorption component with the neutral hydrogen column density fixed at a value taken from radio observations (Dickey & Lockman, 1990).
A spectral fit was considered reliable if the error on the temperature was less than the fitted value of temperature. Where this was not the case, the value of metal abundance was fixed at 0.3 and the fitting repeated. If the fit remained unreliable then the value of temperature was fixed at 1 keV and the normalisation fitted. Unabsorbed bolometric fluxes were obtained from all spectral models by setting the neutral hydrogen column density to zero. We have calculated an upper limit on the flux from undetected groups, by taking the same fixed model and fitting the normalisation to 3 above the background level. Values of flux were then converted to luminosities, , using the optically derived distance, (Section 3). Results of the spectral analysis are presented in Table 4.
The poor spectral resolution of the ROSAT PSPC means that values of metal abundance () can often be misleading, even when the value of temperature is deemed reliable. However simulations have shown us that fixing this value can bias the fitted temperature by up to approximately 20%. We found that fitting a one-component spectral model to variable temperature emission results in a greatly underestimated metal abundance, whilst still producing a reliable value for temperature.
We have produced simple projected temperature profiles for all groups with sufficiently good statistics. For each group we extracted spectra from concentric annuli of increasing radius from the group position, and fitted MEKAL hot plasma models to them. The neutral hydrogen column density was fixed as before, and was allowed to vary in cases where the data quality had allowed a global value to be fitted. Spectral profiles including more than 3 bins, and showing a significant drop in temperature in the centre were deemed to demonstrate a cool core. In these cases (9 systems), data within the central cool region were removed and the global spectrum refitted, to derive a “cooling-corrected” temperature. This correction was found to be small – the average drop in being only 4%, and lying well within the statistical error on . In these cases the X-ray luminosity was corrected for any central data excised, using the fitted surface brightness model.
Spectral data were combined with optical data to calculate two compound parameters: the ratio of X-ray luminosity to optical luminosity (), and the spectral index () defined by
| (7) |
where is the line-of-sight velocity dispersion in , and the temperature in keV.
We have used the fitted -models to calculate a luminosity within , and Figure 5 shows this extrapolated luminosity () plotted against . Errors in plotted in the Figure, and listed in Table 4, are extrapolated from errors in , ignoring any errors arising from uncertainties in or . In cases where no fitted -model was available, a standard model with the average values of = 6 kpc and = 0.5 (Table 5), was used instead. As expected, the greatest correction to the luminosity occurs within the lowest luminosity systems, where it can be as large as a factor of 3.
To investigate the impact on of errors in and , we peformed a full Monte-Carlo analysis, incorporating a Gaussian spread in normalisation, and , for the system (NGC 720), which has fairly typical parameter values. The total derived error on was 8%, a factor of 2 greater than the value of 4% based on the normalisation error alone.

| Group | log | log | log | Sample | ||||||
|---|---|---|---|---|---|---|---|---|---|---|
| Name | (keV) | () | () | () | () | (∘) | (kpc) | (1021 ) | ||
| HCG 4† | n/a | n/a | 41.48 0.19 | 41.62 0.19 | 30.64 0.19 | n/a | 0.06 | 120 | 0.15 | G |
| NGC 315 | 0.97 0.22 | 0.30 0.98 | 41.21 0.10 | 41.41 0.10 | 30.02 0.10 | 0.46 0.43 | 0.08 | 98 | 0.59 | G |
| NGC 383 | 1.51 0.06 | 0.42 0.08 | 43.07 0.01 | 43.10 0.01 | 31.53 0.01 | 0.84 0.22 | 0.50 | 633 | 0.54 | G |
| NGC 524 | 0.65 0.07 | 0.22 0.15 | 41.05 0.05 | 41.33 0.05 | 30.03 0.05 | 0.30 0.15 | 0.09 | 56 | 0.48 | H |
| NGC 533 | 1.08 0.05 | 0.68 0.23 | 42.67 0.03 | 42.73 0.03 | 31.16 0.03 | 1.12 0.31 | 0.28 | 372 | 0.31 | G |
| HCG 10 | 0.19 0.07 | 0.00 0.01 | 41.70 0.14 | 41.82 0.14 | 30.69 0.14 | 1.79 1.51 | 0.08 | 95 | 0.50 | G |
| NGC 720 | 0.52 0.03 | 0.18 0.02 | 41.20 0.02 | 41.43 0.02 | 30.65 0.02 | 0.90 0.80 | 0.16 | 65 | 0.15 | G |
| NGC 741 | 1.21 0.09 | 2.00 0.67 | 42.44 0.06 | 42.50 0.06 | 31.03 0.06 | 1.07 0.28 | 0.28 | 386 | 0.44 | G |
| HCG 15 | 0.93 0.13 | 0.05 0.03 | 42.12 0.05 | 42.25 0.05 | 31.26 0.05 | 1.10 0.68 | 0.10 | 166 | 0.32 | G |
| HCG 16 | 0.32 0.07 | 0.13 0.13 | 41.30 0.11 | 41.43 0.11 | 30.35 0.11 | 0.12 0.08 | 0.12 | 119 | 0.22 | G |
| NGC 1052 | 0.41 0.15 | 0.00 0.02 | 40.08 0.15 | 40.53 0.15 | 29.70 0.15 | 0.13 0.11 | 0.07 | 25 | 0.31 | H |
| HCG 22 | 0.26 0.04 | 2.00 0.51 | 40.68 0.13 | 41.03 0.13 | 30.11 0.13 | 0.01 0.01 | 0.07 | 47 | 0.42 | G* |
| NGC 1332 | 0.56 0.03 | 0.15 0.03 | 40.81 0.02 | 40.93 0.02 | 30.27 0.02 | 0.39 0.19 | 0.07 | 28 | 0.22 | H |
| NGC 1407 | 1.02 0.04 | 0.23 0.05 | 41.69 0.02 | 41.92 0.02 | 30.64 0.02 | 0.62 0.20 | 0.23 | 105 | 0.54 | G |
| NGC 1566 | 0.70 0.11 | 0.00 0.02 | 40.41 0.05 | 40.85 0.05 | 29.14 0.05 | 0.30 0.16 | 0.08 | 29 | 0.13 | H |
| NGC 1587 | 0.96 0.17 | 0.47 1.24 | 41.18 0.09 | 41.53 0.09 | 30.11 0.09 | 0.09 0.05 | 0.08 | 77 | 0.68 | G |
| NGC 1808 | n/a | n/a | 40.10 | 40.59 | 29.37 | n/a | 0.07 | 21 | 0.27 | U |
| NGC 2563 | 1.05 0.04 | 0.64 0.20 | 42.50 0.03 | 42.66 0.03 | 31.05 0.03 | 0.88 0.23 | 0.28 | 359 | 0.42 | G |
| HCG 40 | n/a | n/a | 41.04 | 41.30 | 29.96 | n/a | 0.04 | 64 | 0.35 | U |
| HCG 42 | 0.75 0.04 | 0.29 0.10 | 41.99 0.02 | 42.07 0.02 | 30.66 0.02 | 0.67 0.21 | 0.10 | 112 | 0.48 | G |
| NGC 3227 | n/a | n/a | 41.23 0.05 | 41.28 0.05 | 30.43 0.05 | n/a | 0.12 | 56 | 0.21 | H |
| HCG 48 | n/a | n/a | 41.09 0.04 | 41.30 0.04 | 29.65 0.08 | n/a | 0.06 | 43 | 0.51 | G |
| NGC 3396 | 0.74 0.14 | 0.15 0.10 | 40.53 0.08 | 40.99 0.08 | 30.70 0.04 | 0.10 0.04 | 0.05 | 27 | 0.20 | H |
| NGC 3557 | 0.24 0.02 | 0.00 0.01 | 42.04 0.04 | 42.11 0.04 | 30.93 0.04 | 2.40 0.98 | 0.14 | 95 | 0.74 | G |
| NGC 3607 | 0.35 0.04 | 0.23 0.10 | 41.05 0.05 | 41.50 0.05 | 30.02 0.05 | 1.40 0.60 | 0.15 | 62 | 0.15 | G |
| NGC 3640 | n/a | n/a | 40.37 | 40.74 | 29.54 | n/a | 0.11 | 55 | 0.43 | U |
| NGC 3665 | 0.47 0.10 | 0.17 0.14 | 41.11 0.08 | 41.32 0.08 | 30.30 0.08 | 0.10 0.09 | 0.11 | 71 | 0.21 | G |
| NGC 3783† | n/a | n/a | 40.76 0.11 | 40.94 0.11 | 30.46 0.11 | n/a | 0.11 | 69 | 0.85 | G |
| HCG 58 | n/a | n/a | 41.33 | 41.50 | 30.11 | n/a | 0.07 | 120 | 0.32 | U |
| NGC 3923 | 0.52 0.03 | 0.18 0.05 | 40.98 0.02 | 41.07 0.02 | 30.18 0.02 | 0.69 0.38 | 0.09 | 34 | 0.62 | H |
| NGC 4065 | 1.22 0.08 | 0.97 0.48 | 42.64 0.05 | 42.78 0.05 | 31.08 0.05 | 1.04 0.44 | 0.23 | 425 | 0.24 | G |
| NGC 4073 | 1.52 0.09 | 0.70 0.15 | 43.41 0.02 | 43.48 0.02 | 31.71 0.02 | 1.32 0.34 | 0.28 | 470 | 0.19 | G |
| NGC 4151 | n/a | n/a | 40.20 | 40.51 | 29.58 | n/a | 0.10 | 40 | 0.20 | U |
| NGC 4193 | n/a | n/a | 40.63 0.08 | 41.06 0.08 | 29.70 0.08 | n/a | 0.04 | 27 | 0.26 | H |
| NGC 4261 | 1.30 0.07 | 1.23 0.42 | 41.92 0.03 | 42.30 0.03 | 30.46 0.03 | 0.19 0.05 | 0.18 | 112 | 0.15 | G |
| NGC 4325 | 0.82 0.02 | 0.50 0.08 | 43.15 0.01 | 43.18 0.01 | 32.09 0.01 | 1.08 0.40 | 0.15 | 307 | 0.22 | G |
| NGC 4589 | 0.60 0.07 | 0.08 0.03 | 41.61 0.05 | 41.84 0.05 | 30.92 0.05 | 0.84 0.42 | 0.24 | 122 | 0.29 | G |
| NGC 4565† | 0.36 0.14 | 0.10 0.15 | 40.44 0.14 | 40.74 0.14 | 29.51 0.14 | 0.09 0.18 | 0.10 | 46 | 0.13 | H |
| NGC 4636 | 0.84 0.02 | 0.41 0.05 | 41.49 0.02 | 41.71 0.02 | 31.04 0.02 | 0.60 0.31 | 0.30 | 68 | 0.18 | G |
| NGC 4697 | 0.32 0.03 | 0.07 0.02 | 41.01 0.02 | 41.30 0.02 | 30.13 0.02 | 0.28 0.19 | 0.15 | 53 | 0.21 | H |
| NGC 4725 | 0.50 0.07 | 0.00 0.01 | 40.63 0.06 | 41.08 0.06 | 29.61 0.06 | 0.03 0.03 | 0.06 | 26 | 0.10 | H |
| HCG 62 | 1.43 0.08 | 2.00 0.56 | 43.14 0.04 | 43.20 0.04 | 31.63 0.04 | 0.77 0.19 | 0.22 | 282 | 0.30 | G |
| NGC 5044 | 1.21 0.02 | 0.69 0.06 | 43.01 0.01 | 43.09 0.01 | 31.82 0.01 | 0.94 0.33 | 0.30 | 180 | 0.49 | G |
| NGC 5129 | 0.84 0.06 | 0.66 0.28 | 42.33 0.04 | 42.60 0.04 | 30.79 0.04 | 0.87 0.27 | 0.08 | 151 | 0.18 | G |
| NGC 5171 | 1.07 0.09 | 1.47 1.25 | 42.38 0.06 | 42.45 0.06 | 31.11 0.06 | 1.43 0.59 | 0.16 | 298 | 0.19 | G |
| HCG 67 | 0.68 0.08 | 0.22 0.13 | 42.02 0.07 | 42.07 0.07 | 30.70 0.07 | 0.63 0.31 | 0.11 | 222 | 0.25 | G |
| NGC 5322 | 0.23 0.07 | 0.00 0.02 | 40.71 0.10 | 41.00 0.10 | 29.82 0.10 | 0.76 0.62 | 0.07 | 43 | 0.18 | H |
| HCG 68 | 0.58 0.06 | 0.09 0.02 | 41.52 0.04 | 41.77 0.04 | 30.12 0.04 | 0.40 0.15 | 0.17 | 122 | 0.10 | G |
| NGC 5689 | n/a | n/a | 40.24 | 40.53 | 29.76 | n/a | 0.06 | 40 | 0.20 | U |
| NGC 5846 | 0.73 0.02 | 1.25 0.69 | 41.90 0.02 | 42.04 0.02 | 30.66 0.02 | 1.02 0.30 | 0.18 | 94 | 0.43 | G |
| NGC 5907 | n/a | n/a | 39.69 0.14 | 40.34 0.14 | 29.27 0.14 | n/a | 0.04 | 12 | 0.14 | H |
| NGC 5930 | 0.97 0.27 | 0.17 0.12 | 40.73 0.07 | 41.19 0.07 | 30.42 0.07 | 0.14 0.14 | 0.04 | 29 | 0.20 | H |
| NGC 6338 | n/a | n/a | 43.51 0.02 | 43.57 0.02 | 31.72 0.02 | n/a | 0.28 | 619 | 0.26 | G |
| NGC 6574† | n/a | n/a | 40.81 | 40.96 | 30.81 | n/a | 0.10 | 61 | 1.08 | U |
| NGC 7144† | 0.53 0.20 | 0.00 0.02 | 40.33 0.13 | 40.71 0.13 | 29.69 0.13 | 0.02 0.04 | 0.10 | 46 | 0.28 | H |
| HCG 90 | 0.46 0.06 | 0.08 0.03 | 41.49 0.05 | 41.79 0.05 | 30.62 0.05 | 0.23 0.09 | 0.16 | 101 | 0.16 | G |
| HCG 92 | 0.71 0.06 | 0.20 0.13 | 41.99 0.04 | 42.19 0.04 | 30.93 0.04 | 1.92 1.46 | 0.06 | 93 | 0.80 | G |
| IC 1459 | 0.39 0.04 | 0.04 0.01 | 41.28 0.04 | 41.46 0.04 | 30.35 0.04 | 0.80 0.45 | 0.27 | 121 | 0.12 | G |
| NGC 7714† | n/a | n/a | 40.03 | 40.48 | 29.73 | n/a | 0.03 | 20 | 0.49 | U |
| HCG 97 | 0.82 0.06 | 0.23 0.10 | 42.37 0.05 | 42.43 0.05 | 31.30 0.05 | 1.38 0.56 | 0.21 | 339 | 0.36 | G |
4.3 Correlations in Properties
We have derived 18 group parameters, listed in Table 5, which we use for our statistical analysis. All parameters were cross-correlated and any significant relationships identified by examining the resulting plots and the Kendall’s rank correlation coefficient (), which corresponds to a correlation significance in units of Gaussian sigma. Trends were parameterised by taking the bisector between two orthogonal least squares regression fits, as calculated by the SLOPES software (Feigelson & Babu, 1992). We prefer to use an unweighted orthogonal regression, since the scatter observed in the properties of galaxy groups is primarily non-statistical (Helsdon & Ponman, 2000b). It is therefore inappropriate to weight points by their statistical errors when fitting regression lines.
The regression parameters are summarised in Table 5 and relationships listed in Table 6. These results are presented and discussed in the following sections. In all figures, filled squares represent X-ray groups (G-sample), open circles X-ray galactic-halos (H-sample), and crosses X-ray non-detections (U-sample).
| Parameter | Mean | Min. | Max. | N | |
| () | 261 | 25 | 651 | 54 | |
| (Mpc) | 53 | 10 | 127 | 54 | |
| (Mpc) | 0.46 | 0.23 | 0.88 | 54 | |
| (Mpc) | 0.45 | 0.10 | 1.07 | 38 | |
| () | 30 | 6 | 131 | 54 | |
| (log ) | 11.16 | 10.32 | 11.80 | 54 | |
| 0.50 | 0.00 | 1.00 | 54 | ||
| (log ) | 10.67 | 9.44 | 11.19 | 54 | |
| 3.64 | 1.06 | 23.55 | 54 | ||
| (kpc) | 6.47 | 0.07 | 81.26 | 34 | |
| 0.47 | 0.36 | 0.58 | 34 | ||
| 1.52 | 1.04 | 3.16 | 34 | ||
| (keV) | 0.75 | 0.19 | 1.52 | 43 | |
| () | 0.46 | 0.00 | 2.00 | 43 | |
| (log ) | 42.47 | 39.69 | 43.51 | 48 | |
| (log ) | 42.55 | 40.34 | 43.57 | 48 | |
| 0.75 | 0.01 | 2.40 | 43 | ||
| (log ) | 31.07 | 29.14 | 32.09 | 48 | |
| y | x | G-Sample | H-Sample | All | Figure | |||||||||||
|---|---|---|---|---|---|---|---|---|---|---|---|---|---|---|---|---|
| Slope | Intercept | K | Slope | Intercept | K | Slope | Intercept | K | ||||||||
| log | log | 2.75 0.49 | 42.38 0.10 | 4.37 | -1.05 0.22 | 40.40 0.11 | -0.09 | 3.22 0.51 | 42.25 0.11 | 4.537 | 15 | |||||
| log | log | 2.56 0.66 | 35.73 1.68 | 4.94 | 1.90 0.62 | 36.61 1.37 | 1.46 | 3.10 0.43 | 34.27 1.05 | 6.854 | 15 | |||||
| log | 0.84 0.13 | -34.33 5.34 | 2.73 | 0.86 0.21 | -34.80 8.37 | 0.98 | 0.69 0.11 | -28.14 4.59 | 4.323 | 17 | ||||||
| log | log | 2.05 0.21 | 19.13 2.41 | 4.78 | 1.28 0.34 | 26.82 3.66 | 0.12 | 2.47 0.19 | 14.25 2.15 | 5.978 | 19 | |||||
| log | log | 1.28 0.20 | 11.33 0.04 | 3.95 | -1.12 0.31 | 10.48 0.16 | -0.27 | 1.37 0.17 | 11.30 0.04 | 4.055 | 19 | |||||
| log | -0.93 0.11 | 0.26 0.04 | -2.64 | 1.32 0.19 | 1.01 0.11 | 0.76 | -1.03 0.09 | 0.27 0.04 | -2.554 | 26 | ||||||
| log | -0.88 1.88 | 2.56 4.63 | -1.78 | -1.28 0.21 | 3.43 0.45 | -1.67 | -0.93 0.10 | 2.68 0.24 | -3.918 | 26 | ||||||
| log | -0.55 0.22 | 23.47 9.32 | -1.03 | -0.84 0.21 | 34.92 8.63 | -0.64 | -0.34 0.04 | 14.68 1.87 | -3.503 | 26 | ||||||
| log | -0.53 0.08 | 0.16 0.06 | -3.17 | 0.36 0.19 | 1.07 0.17 | -0.31 | -0.54 0.10 | 0.13 0.06 | -3.877 | 26 | ||||||
| log | 0.78 0.09 | -0.68 0.13 | 2.53 | -1.00 0.10 | 2.02 0.16 | -0.52 | 0.98 0.04 | -0.85 0.06 | 1.943 | 26 | ||||||
| log | log | 0.96 0.15 | -0.08 1.73 | 4.86 | 1.22 0.17 | -2.70 1.82 | 2.68 | 0.99 0.11 | -0.38 1.19 | 6.236 | 30 | |||||
| log | log | 1.09 0.19 | 7.95 0.52 | 1.92 | -1.09 0.38 | 12.77 0.82 | -0.37 | 1.14 0.14 | 7.89 0.36 | 2.772 | 30 | |||||
5 Comparison With Previous Work
We compare our derived values of and to those given in the group catalogues from which our groups are drawn. Figure 9 shows a reasonable agreement between values of in all but the compact groups, where we typically find many more galaxy members, since the original compact group search included only a compact core of galaxies in what is generally a much larger group (e.g Zabludoff & Mulchaey, 1998). We also find a reasonable match between our values of , and those taken from the source catalogues (Figure 9).
The recently published atlas by Mulchaey et al. (2003, hereafter referred to as MDMB), includes 109 ROSAT-observed groups, larger than present sample, with X-ray emission detected from 61. X-ray fluxes in this study have not been corrected to , and optical properties have been drawn from a variety of group catalogues, rather than re-extracted in a uniform manner as in our sample. However, Mulchaey et al. subject all their groups to a uniform X-ray data analysis similar in many ways to ours, so that comparisons with our results provide a valuable check. In particular they adopt the same procedure for choosing , and quoted luminosities are bolometric. In the spectral fitting the netural hydrogen column density is fixed at the galactic value and unconstrained metallicities are fixed at 0.3 solar.
There is an overlap of 43 groups between the two samples. Plotting against (Figure 9) shows a good agreement for X-ray bright groups, and reasonable agreement amongst groups with lower luminosity, but with a good deal of scatter in the latter. The reason for this scatter is not clear. It does not, in general, appear to be related to the radius out to which emission has been integrated in the two studies, nor (see below) to systematic differences in the spectral properties derived. We explored the comparison in more detail for three of the groups for which the disagreement with MDMB was strongest. NGC 315 has a value of which is a factor of 5 less than the MDMB value of = 1041.88 . However this difference is accounted for by the removal of the central AGN in our analysis (Section 4). Our for HCG 48 is a factor of 2 less than the MDMB value of 1041.70 . This value has been extracted from a circular region with a value of equivalent to 60% of the MDMB radius of 72 kpc. We have used a smaller radius in order to minimise X-ray contamination from the nearby cluster Abell 1060 and it is this difference which accounts for the deficit in . NGC 4636 has a factor of 5 less than the MDMB value of 1042.19 , and is extracted from a similar size region. Furthermore the diffuse emission is so extensive that replacing the central AGN only changes the overall by a small proportion. The value of derived by Helsdon & Ponman (2000a) for the same system is 1042.18 , in good agreement with the MDMB value. However both of these studies take the group velocity from the source catalogue, and applying our iterative membership calculation decreases this catalogued value (and hence the distance inferred from it) by a factor of 2, accounting for the majority of the discrepancy in . Our value of distance is also in much better agreement with that of the BGG, NGC 4636 ( = 10 Mpc).
We find a good agreement between our values of and those taken from MDMB (Figure 9), though the latter have not been corrected for cool cores. Since the MDMB study is based on the same ROSAT data that we are using, this comparison does not address the issue of the whether ROSAT spectra yield reliable temperatures. The results of Hwang et al. (1999) suggest that for hot plasmas with 1.5 keV, ROSAT PSPC temperatures are biased low (by about 30%) relative to those derived using the superior spectral capabilities of ASCA, whilst for cooler systems temperatures from the two instruments are in reasonable agreement. Since the hottest system in our sample has = 1.52 keV, any such bias should have only minor effects on our study.


6 The Radii of Galaxy Groups
As discussed in Section 3, we have sought in this study to extract group properties within a consistently defined overdensity radius, corresponding to 500 times the critical density of the Universe at the current epoch. The best way to define such a radius for each group would be to derive total mass profiles, to directly measure the radius within which the desired mean density is obtained. This could be done (under the assumption of hydrostatic equilibrium) if gas density and temperature profiles could be extracted from our data. Unfortunately, the quality of the data does not permit reliable gas temperature profiles to be extracted for most of these groups, and in no case could such a profile be extended to . Failing this, three methods for estimating were considered, as described in Section 3, based on the use of X-ray temperature, galaxy velocity dispersion or total optical (blue) luminosity. The principle behind all these, is that a system virialising at = 0 should have a given mean density within its virial radius, and hence all overdensity radii should scale as the third power of system mass. Total optical luminosity () can be used to estimate system mass under the assumption that star formation efficiency, and mean mass-to-light ratio of galaxies, are independent of other group properties.
Unfortunately, these assumptions are debatable. Semi-analytical models of galaxy formation predict a correlation between and halo size. For example, Benson et al. (2000) find that drops by a factor 3 in their models, between halos of mass 1014 and 1012 , i.e. in the group and galaxy regime. Observational evidence on this issue is mixed. Most X-ray studies, such as those by Hradecky et al. (2000) and Sanderson & Ponman (2003), have found the mass-to-light ratio and star formation efficiency in groups and clusters to be essentially independent of temperature. However, the study of Hoekstra et al. (2001), based on the weak lensing signal from a set of stacked groups, found lower than that in clusters, and a compilation of a variety of measurements on group to cluster scales, led Bahcall & Comerford (2002) to conclude that rises gently, as 0.3, across the temperature range from 1 keV to 12 keV.
Alternatively, for a system in virial equilibrium, the characteristic velocity dispersion of the galaxies, and the gas temperature, should be related to system mass via the virial theorem. This leads to
| (8) |
where the final step involves the assumption of constant mean density for newly-virialised systems. Results from cosmological simulations suggest that a scaling relation 1.5 can give a robust and reliable measure of mass. Evrard et al. (1996), in an analysis of an ensemble of simulated clusters (including some incorporating feedback), found that mass estimates using a 1.5 formula with an appropriate normalisation, scattered about the true masses, with a standard deviation of only 15%. On the other hand, a number of studies (e.g. Finoguenov, Reiprich & Böhringer, 2001) find that the - relation has a slope steeper than 1.5, and Sanderson et al. (2003) find observational evidence, by comparing X-ray derived masses with the results obtained from simple scaling formulae, that a 0.5 scaling can overestimate virial radii, especially in cool systems, by up to 40%, leading to a corresponding overestimate in virial mass.
It is known from previous studies (c.f. Section 7.3) that the energy per unit mass in gas tends to be higher than that in galaxies (i.e. 1) for poor clusters and groups, and that in groups there appears to be a great deal of scatter in . This implies that either or (or both) is an unreliable indicator of system mass. A priori one could think of reasons to suspect either parameter: is usually statistically poorly determined in groups, due to the low number of galaxy redshifts available, and might also be affected by a variety of biases and physical effects, whilst could be vulnerable to the effects which are believed to have raised the entropy of the gas in groups relative to that expected on the basis of what is seen in clusters (Ponman et al., 1999).
To explore this further, we tried both methods (Equations 1 and 3) for the evaluation of , and extracted the group members for each of the two resulting definitions. It is instructive to consider the mean density of galaxies,
| (9) |
for the GEMS sample, computed by each method. Histograms showing the distribution of values obtained are shown in Figure 10. For comparison, we calculated the expected mean galaxy density within from the average Sloan Digital Sky Survey (SDSS) luminosity function of Blanton et al. (2003), by integrating their Schechter function down to our luminosity cut, giving a predicted mean galaxy density
| (10) |
where is the density of ordinary matter, as a fraction of the critical density, and is assumed to be 0.3. The predicted mean galaxy density is marked in Figures 10 and 11.
It can be seen that using the -based estimate of , the expected density is close to the median of our derived values ( = 25), whilst the -based estimates lead to a much wider scatter in , with some values (mostly for very poor groups) over an order of magnitude higher than expected. The standard deviations in the distributions for the and -based estimates are 21 and 115 , respectively.
In Figure 11, we compare the derived densities for the two methods, plotted against total optical luminosity of the groups. It can be seen that not only does the -based analysis give a smaller scatter in , but that the inferred densities show no discernable trend with . It seems that any effects of non-self-similar entropy scaling are not acting to systematically raise in lower mass systems, otherwise we would see a trend towards lower apparent in the poorest systems.
The good agreement between our observed and expected galaxy densities, appears to conflict with the conclusions of the Sanderson et al. (2003) analysis, discussed above, since a 40% overestimate in would lead to our densities being underestimated by a factor of 2.7, which does not seem consistent with the results shown in Figure 11. Moreover a number of recent studies (e.g. Nevalainen, Markevitch & Forman 2000; Sato et al. 2000; Finoguenov et al. 2001), have indicated that the - relation for clusters and groups is significantly steeper than the self-similar ( 1.5) relation, although Allen, Schmidt & Fabian (2001) find a relation consistent with self-similarity from a high-quality Chandra study of a small sample of rich, relaxed clusters, with a 2500 overdensity radius. If the - relation does have a slope steeper than 1.5, then it follows that the 0.5 scaling for is too flat, and will presumably tend to overestimate the radius in the group regime.
It should be noted that the good agreement between our median value of galaxy density and the expected value, assumes that galaxies are not biased relative to mass on group scales. Recent results from the 2dF galaxy redshift survey (Verde et al., 2002) suggest that light is essentially unbiased relative to mass on scales larger than 5 Mpc. However, as we discussed earlier in this section, there is some evidence from both observations and simulations (e.g. Bahcall & Comerford, 2002; Benson et al., 2000) that light may be biased on smaller scales. A recent study of the K-band mass-to-light ratio (Lin, Mohr & Stanford, 2003), based on 2MASS luminosities which provide a measure of the stellar mass relatively unaffected by recent star-formation history, coupled with mass estimates based on X-ray temperatures, found that dropped by a factor 2 over the mass range () 1015 to 1014 . It may therefore be that the apparent good agreement between our derived galaxy densities and the prediction from the universal mean is fortuitous, and that our application of Equation 1 leads to an overestimate of , and hence an underestimate of , which cancels the factor of 2-3 by which these densities are biased upward relative to the Universal mean. Derivation of reliable X-ray masses with XMM-Newton may eventually resolve this issue.
Our conclusion is that the use of Equation 1 appears to provide a more stable estimate of than the use of a -based scaling relation, although there is some danger that all our radii may be somewhat overestimated by the 0.5 formula. Where no value of is available, we adopt an estimate based on the scaling of scaling of mass with , using Equation 2. In the latter case, an iterative process is involved, since depends upon the group membership within , whilst , in turn, depends on .


7 Global Scaling Relations
Scaling relations between the major global parameters of galaxy systems – , , and – are of great interest in studying the extent to which groups are related to clusters through simple similarity scalings. Previous work (Helsdon & Ponman, 2000a, b; Xue & Wu, 2000; Mulchaey, 2000) has shown that even where scaling relations follow self-similar forms for rich clusters, this behaviour does not usually extend to the group regime. In terms of X-ray properties, we are interested here in the scaling properties of the hot IGM, so we concentrate primarily on those systems designated as having “group” emission. In order to compare with cluster properties, we make use of the sample of Horner (2001), based on a homogeneous analysis of data from the ASCA observatory. We remove cool ( 2 keV), low luminosity ( 21043 ) groups from the systems studied by Horner, to give a sample of 230 clusters, 105 of which have velocity dispersions available. The X-ray luminosities for these systems were corrected to by Horner, assuming a standard -model with = 0.67, and core radius which scales as 0.28, following the empirical result of Böhringer et al. (2000). We have used the same model to correct each of these cluster luminosities instead to , for comparison with our group values. Temperatures for these clusters have been derived by Horner from MEKAL model fits to integrated ASCA spectra from within some extraction radius. Although no attempt was made to remove any emission from a central cool core, we have seen that this has had only a small effect on our own temperatures, so that the two samples can reasonably be compared. Velocity dispersions for a subset of his clusters were collected by Horner from the literature. These will therefore be derived in a heterogeneous fashion. However, for all but three of the clusters, these velocity dispersions are based on more than 10 redshifts.
7.1 The - Relation
Strong correlations exist between X-ray luminosity and both gas temperature and velocity dispersion, reflecting the fact that deeper potential wells generally contain more hot gas. It has been clear for many years that the - relation for clusters does not follow the 2 law expected for self-similar systems radiating bremsstrahlung X-rays. Most authors (e.g. White, Jones & Forman 1997; Arnaud & Evrard 1999) have found logarithmic slopes close to 3 in the cluster regime, though attempts to remove the effects of central cooling flows (Allen & Fabian, 1998; Markevitch, 1998) have produced rather flatter relations. Studies of the relation for galaxy groups have mostly found considerably steeper slopes. Helsdon & Ponman (2000a, b) obtained a slope of 4.90.8 for a sample of X-ray bright loose groups, and 4.30.5 for a larger sample (36 systems) including both loose and compact groups. Xue & Wu (2000), found a slope of 5.61.8 from data for 38 groups drawn from the literature.
Our result from the GEMS sample, shown in Table 6 and Figure 15, for the subsample of 45 groups with fitted temperatures, is significantly flatter than the above group results, and appears close to the slope seen in clusters. This is especially striking if we restrict our attention to G-sample systems (slope = 2.750.46) and flattens still further (2.500.42) if we use values extrapolated to . In Figure 15, we plot the G-sample systems, with extrapolated luminosities, alongside the Horner cluster sample. The parameters for the three trend lines are given in Table 7, and that for the G-sample groups is actually somewhat flatter than the cluster relation. Can we conclude from this that the earlier results of a steeper - relation in groups were incorrect?
| Relation | Groups | Clusters | All | Figure | ||||||||
|---|---|---|---|---|---|---|---|---|---|---|---|---|
| Slope | Intercept | Slope | Intercept | Slope | Intercept | |||||||
| log | log | 2.50 0.42 | 42.51 0.09 | 3.26 0.12 | 42.44 0.10 | 3.23 0.10 | 42.46 0.07 | 15 | ||||
| log | log | 2.31 0.61 | 36.53 1.54 | 3.94 0.33 | 33.24 0.97 | 4.55 0.25 | 31.34 0.72 | 15 | ||||
| log | log | 1.15 0.26 | 2.60 0.03 | 0.78 0.05 | 2.36 0.04 | 0.71 0.05 | 2.43 0.03 | 16 | ||||


To explore the origin of the differences from our own earlier results, we examined the subset of 16 of our GEMS groups which overlap with the sample of 24 groups studied by Helsdon & Ponman (2000a). Our regression line through these 16 systems has a slope of 4.30.9, close to the result of Helsdon & Ponman (2000a). The use of luminosities extrapolated to flattens this regression line only slightly, to a slope of 3.71.0. These tests strongly suggest that the flatter slope from our G-sample systems is primarily related to differences in the group sample used here, rather than in the analysis techniques employed. The systems studied by Helsdon & Ponman (2000a) were selected on the basis of significant X-ray flux, and therefore constitute a sample of X-ray bright groups, whereas the GEMS sample was deliberately designed to cover a wider spectrum of X-ray properties, as discussed in Section 2. As a result, our present sample includes a much larger number of cool groups ( 0.7 keV) than that of Helsdon & Ponman (2000a), and most other previous studies. Two groups in particular, HCG 10 and NGC 3557, have 0.25 keV, and yet have moderately high X-ray luminosities.
In the present study, we are also pushing closer to the statistical limits of what can be achieved with ROSAT data. It is well-established that there is considerably larger real scatter in the scaling relations for galaxy groups than is seen in clusters. This scatter introduces three sources of bias into our regression process. Firstly, the result of truncating this scattered trend at low (since we will either reject systems with very low as galaxy halo sources, or fail to detect them altogether) will be to flatten the fitted relation. Secondly there is a ‘logarithmic bias’ whereby the scatter in log (which dominates the statistical scatter about the trend line) will be asymmetric (if the scatter in is fairly symmetric) with larger scatter towards low log . Since the statistical errors are largest in systems with lowest , this will also tend to flatten the regression line. Thirdly, there is an additional bias which couples with the scatter in . At temperatures towards the bottom of the ROSAT bandpass, and close to the absorption cut-off due to interstellar gas and dust, the unabsorbed bolometric flux corresponding to a given PSPC count rate rises quite sharply as falls (e.g. for an absorbing column of 41020 it rises by 67% as falls from 0.6 keV to 0.3 keV). Thus it follows that points in the - plane which scatter down in temperature, will also scatter up in , which further magnifies the flattening effect discussed above. Since all three of these biases are related to the large scatter in the data, we investigated the effect of clipping the outliers. Iteratively discarding G-sample points which lie more than 2 sigma from the regression line does indeed steepen the fitted slope, from 2.5 to 3.0 where 8 of the 33 points are clipped in this analysis. Note, however, that this steeper slope is still fully consistent with the cluster - relation.
One final source of bias which becomes important when pushing the sample down to very poor groups, is the impact of contamination from point sources which are unresolved by ROSAT. Since the fractional contribution of such sources will tend to be larger in the lowest luminosity groups, it will tend to flatten the - relation. Helsdon, Ponman & Mulchaey (2004) find, from a comparison of Chandra and ROSAT results for two very cool groups, that the level of unresolved point source contribution to the diffuse flux derived from the PSPC analysis is 30-40%. So this effect is smaller than the correction (a factor 2-3 for such poor systems) arising from extrapolation to , and works in the opposite direction.
A further difference in our present analysis, compared to earlier studies, is that we separate off systems in which the X-ray emission appears to be related to a central galaxy, rather than to the group as a whole. In studying the properties of groups, for comparison with clusters, this seems the appropriate thing to do. As can be seen from Figure 15 and Table 6, these halo sources do fall at the bottom of the - plot, and their inclusion steepens the fitted - relation. However, this will have had little impact on the earlier work of Helsdon & Ponman (2000a), since their X-ray bright sample contained very few objects which might be classified as galaxy halo sources.
In summary, we conclude that although the - relation obtained from our G-sample groups is close to continuous with the cluster relation, albeit with increased scatter, this may be a misleading result, since we have identified a number of biases, all of which work towards flattening the fitted - relation in the low , low regime. Extension of the data towards lower would be necessary to reduce these biases and establish definitively whether the - relation does steepen in groups. This may ultimately be possible with XMM-Newton, but will not be straightforward, in a regime where luminosities are comparable to those of individual halos around early-type group member galaxies. What is clear from our results, is that groups show a considerably larger real scatter about the mean - trend than is seen in clusters – spanning at least a factor of 30 in , at a given value of , or a factor 3-4 in at given .
7.2 - relation
Our relationship between and (Figure 15) has a slope of 2.560.56 for the G-sample, which is flatter than the value of 4.51.1 found by Helsdon & Ponman (2000a). Although there is general agreement that the - relation does not steepen in groups, unlike the - relation, there is disagreement between studies (e.g Ponman et al., 1996; Mulchaey & Zabludoff, 1998; Helsdon & Ponman, 2000a; Mahdavi, 2001) which find that groups are consistent with the cluster-relation slope of 4, and those (Mahdavi et al., 1997; Xue & Wu, 2000; Helsdon & Ponman, 2000b; Mahdavi et al., 2000) which find significantly flatter relations in groups. The result from the GEMS sample is clearly (Figure 15) substantially flatter than the cluster trend, and has a slope in good agreement with that of Helsdon & Ponman (2000b) (2.40.4) and Xue & Wu (2000) (2.350.21). Extrapolation of the luminosity to results, as expected, in a slightly lower slope, of 2.310.62 (Table 7).
As with the - relation, biases are at work which will tend to lead to some spurious flattening of our regression results. Since the groups with lowest tend to be the poorest, and hence to have the largest fractional errors in , three of the four sources of bias discussed in the last section (the truncation and logarithmic biases, and point source contamination) will also apply to the - relation. Nonetheless, there are some groups in our sample with remarkably low velocity dispersion, which appear to show group-scale emission. This is hard to understand, since such X-ray emission presumably implies that a group is collapsed, if not virialised, and as Mamon (1994) has argued, the requirement that collapsed systems should have some minimum overdensity sets a lower bound (at a given mass or radius) to the velocity dispersion which they can have. This bound is 100-200 for poor groups. A study with Chandra (Helsdon et al., 2004), of two of the low systems in our sample, NGC 1587 and NGC 3665, has confirmed that the diffuse X-ray emission identified by ROSAT is not grossly misleading, although point source contamination and inaccurate spectral characterisation can lead to overestimation of by 30-40%.
The fact that groups with such low values of can contain a significant IGM, with properties which accord reasonably with those of other groups, strongly suggests that the observed values of are not reflecting the depth of the potential well in the way one expects. We will return to this in the following section.
7.3 - and
A number of previous studies have found that the relationship between velocity dispersion and gas temperature departs slightly from the virial theorem expectation ( 0.5) in clusters (Bird, Mushotzky & Metzler 1995; Girardi et al. 1998; Wu, Xue & Fang 1999). The evidence for groups is more controversial, with some authors (e.g. Xue & Wu, 2000; Mulchaey, 2000) finding that groups fall on the cluster trend, and others (Helsdon & Ponman, 2000a, b) finding that the relation steepens in groups with 1 keV, to a slope 1. Our result, presented in Figure 16, shows that there is a great deal of non-statistical scatter in the groups, in addition to the large statistical errors in both , and especially , in the poorest systems. This appears to be the origin of the controversy over whether the relation does or does not steepen in the group regime. Formally, we find that it does, with a best fit slope to the GEMS G-sample systems of 1.150.29. However it is clear that the best fit line to the combined group+cluster sample (with a slope of 0.710.05) passes through the centre of the scatter of group points, and also represents the trend in the cluster regime quite adequately. This slope is somewhat steeper than that found in most previous studies.
Comparison with the line = 1 in Figure 16, shows that many of the G-sample groups are actually consistent with this energy equipartition line (as are many clusters), but that there is a significant subsample of points which scatter well below it. These systems have velocity dispersions typically a factor 3 below what would be expected for their X-ray temperatures. All of the groups with 100 fall into this category.

Figure 17 shows clearly that high X-ray luminosity ( 1042 ) groups have 1, whilst groups with 1041.5 scatter widely in , spanning the range = 0.1-1.0. The evidence discussed in Section 6 above, led us to the conclusion that gives a much more reliable measure of system mass and radius than does . It follows from this that the “problem” in some of the poorest systems, which leads to their remarkably low values of , lies not with , but with . Some of these groups, from both G and H-samples, have extremely low velocity dispersions, giving them low , and also small radii (and hence high ) when these are calculated on the basis of .

As can be seen from Table 2, most of these low systems have 6 galaxy redshifts available for the computation of . Under these circumstances, a number of biases may affect the derived value of (Helsdon & Ponman, 2004). We have already corrected for a statistical bias which results if one uses the normal unbiased estimator for , and then takes the square root to obtain (which is then not unbiased). This is the origin of the term (rather than 1) in the denominator of Equation 4. However, another downward bias may arise if (as is normally the case for X-ray bright groups) one of the galaxies is at rest at the bottom of the group potential well. This galaxy will not contribute to the sum of squared deviations from the mean velocity, but will be included in the denominator. For a group with only four members, this reduces by over 20%. However, such statistical biases cannot provide anything approaching the large factors ( 2-3) by which we infer that has been reduced in some of these groups.
Physical effects which might lead to such low values of , are discussed in greater detail in Helsdon et al. (2004). Observed galaxy velocity dispersions might be reduced if (a) galaxy orbits decay due to dynamical friction, (b) orbital energy is converted into internal energy of the galaxies via tidal heating, or (c) orientation effects result in most of the galaxy velocity vectors for some systems lying close to the plane of the sky. The last of these has, perhaps, the greatest potential to achieve really substantial reductions in observed line-of-sight velocity dispersions.
7.4 Scaling between and X-ray properties
In an ensemble of self-similar groups with constant mean density, the X-ray
luminosity would scale linearly with galaxy mass, and hence with optical
luminosity. Helsdon &
Ponman (2003b) found a much steeper relation,
2.69±0.29. Our fitted relation for our full sample of X-ray detected
systems is consistent with this (Table 6). The trend for the
G-sample systems (Figure 19) is somewhat flatter (2.050.21),
but still much steeper than the self-similar expectation. This could be
explained in any of three ways:
(a) rises with system mass,
(b) gas density is higher in more massive systems,
(c) star formation is more efficient in poorer groups.
There are indications that all three of these factors may contribute, but the results of Ponman et al. (1999) and Sanderson et al. (2003) suggest that the dominant effect is probably a reduction in gas density in the inner regions of poor systems, relative to richer ones.
If gives a reliable measure of group size ( 0.5) and hence mass, as we are assuming here (since we use this relation to define our value of ), then 1.5 would result if star formation efficiency were independent of system mass. Our observed relation (Figure 19) has a slope 1.280.19, somewhat flatter than the slope of 1.640.23 found by Helsdon & Ponman (2003b), but still consistent with the value of 1.5 expected from self-similarity and constant SFE. If, however, the - relation has a slope steeper than the value of 1.5 (i.e. 1.5) as has been found by a number of previous studies – e.g. Nevalainen et al. (2000), Finoguenov et al. (2001) and Sanderson et al. (2003) suggest a slope 1.8 – then our - slope of 1.28 suggests a star formation efficiency which is significantly higher in lower mass systems, as discussed in Section 6.


8 and the Role of Heating
Mulchaey & Zabludoff (1998) and Helsdon & Ponman (2000a) found that most X-ray bright groups with data of sufficiently high quality, require two-component -models to adequately represent their surface brightness distributions. The central component is identified either with a halo associated with the brightest cluster galaxy (BCG) (Mulchaey & Zabludoff, 1998), or a central group cooling region (Helsdon & Ponman, 2003b), whilst the outer component clearly arises from a group-scale intergalactic medium. Helsdon & Ponman (2000a) investigated the effect of fitting a single component -model to a group where a two-component model is more appropriate, and found that the value of obtained with a single-component model typically scattered by 0.1 (but in extremis by up to 0.3), either upward or downward from the value for the group component given by a two-component fit. We therefore place more credibility in the two-component results from our present fits.
The largest value of obtained for any of the GEMS groups is 0.58, and the median value from our G-sample fits is 0.45, in good agreement with the value of 0.46 derived by Helsdon & Ponman (2000a). This is clearly well below the typical value, 0.67, found in rich clusters (Arnaud & Evrard 1999; Mohr, Mathiesen & Evrard 1999). A trend towards lower values of in poorer clusters has been reported by a number of authors. However Mohr et al. (1999) found that this trend disappeared when the systems in their study (which all had 2 keV) were fitted with two-component models, and hence concluded that the effect was spurious. This explanation cannot account for the low values of obtained here, nor in the studies of Helsdon & Ponman (2000a) or Mulchaey et al. (2003), since two-component fits are employed wherever possible, and found to give 0.4-0.5.
However, some uncertainty arises due to the fact that X-ray emission in groups can typically be traced only to a modest fraction of the radii to which they should be virialised (Mulchaey, 2000). It has been argued on the basis of simulations (Navarro, Frenk & White, 1995), and analytical models (Wu & Xue, 2002), that gas density profiles steepen progressively, and hence that low values of naturally arise when profiles are fitted only within r 0.3. However there is some evidence that this is unlikely to explain the low values of we observe. Sanderson et al. (2003) examined the effects of truncating the data for galaxy clusters when fitting -models, and found little evidence for any significant drop in . Moreover observed radial surface brightness profiles are generally found to be modelled remarkably well by simple power laws, outside the central core. Vikhlinin, Forman & Jones 1999 studied a sample of rich clusters out to r with the ROSAT PSPC, and found only a slight steepening (by 0.05) in the outer regions of typical clusters. Rasmussen & Ponman (2004) were able to trace the emission from two rich groups ( 2 keV) out to , and found no evidence for steepening of the profiles beyond the simple -model fits.
Whilst the values of groups appear to be lower than those of clusters, no previous studies have detected any significant correlation between and within the group regime. Figure 21 shows the relationship between these two variables for the GEMS groups. Results from two-component fits are marked as larger symbols. No correlation is apparent for the G-sample systems; in fact a weak (1.4) anti-correlation is present in these data. The results for groups with two-component fits (i.e. the most reliable values), show no significant trend at all.
It is interesting to compare the values of and for the GEMS groups, and this is plotted in Figure 21. In the simple case of an isothermal hot gas, and a set of galaxies with isotropic velocity dispersion, both in equilibrium in the gravitational potential of a mass distribution having the -model form, one would expect to find = . Even though the assumptions underlying this model are restrictive and unrealistic, one might in general expect to find a correlation between the two s if heating of the IGM is affecting the gas density profiles, as is often assumed (Cavaliere, Menci & Tozzi, 1999; Balogh, Babul & Patton, 1999), since energy input into the gas is expected to directly reduce , and also to flatten the gas profile, lowering (c.f. Muanwong et al., 2002). In practice, no such relationship is seen. covers a much wider range than , with many systems having 1, and some having extremely low values 0.1. However, the latter do not have remarkably low values of .
How can we understand the lack of significant correlations involving ? If group mass, coupled to a simple universal preheating model, were responsible for the flatter profiles in groups compared to clusters, then strong correlations would be seen. Hence, one plausible suggestion is that additional properties peculiar to individual groups, such as star formation efficiency or merger history, play a substantial role, and introduce a large amount of non-statistical scatter. Flat X-ray surface brightness profiles are associated with lower central gas densities and consequently with higher entropy compared to self-similar expectations. Recent results (Ponman, Sanderson & Finoguenov 2003; Pratt & Arnaud 2003; Sun et al. 2003; Mushotzky 2003) suggest that the earlier hypothesis (Ponman et al., 1999) of a universal “floor” value of entropy was incorrect. It appears (Ponman et al., 2003) that entropy scales in a non-self-similar way with system mass, and that there is also significant scatter (Sun et al., 2003; Mushotzky, 2003) between the magnitude of the entropy in groups of a given mean temperature. This would lead to scatter in the value of , making it hard to detect any trend with temperature without a large and accurately modelled sample. Since biases are present where only one-component fits are performed, we actually have only 15 reliable values of in our sample.
The lack of correlation between and , is not obviously explained by this explanation of individual scatter. What is required is some way of breaking the link between the two values. The obvious way to do this is through effects on , since the expectation that the two s should be related, is based on the assumption that provides a measure of the gravitational potential. We have already seen, from the discussion in Sections 6 and 7.3, that there is good reason to doubt this assumption.


9 Galaxy morphology
9.1 Spiral fraction in groups
Strong correlations between and both and are seen in clusters (Edge & Stewart, 1991a). In groups, such trends have proved to be surprisingly weak (Ponman et al., 1996; Mulchaey, 2000; Helsdon & Ponman, 2003b), despite the strong correlation between X-ray emission and the morphology of the central group galaxy (discussed below). For the G-sample systems, we also find only a weak (1) tendency for to be higher in low groups, but the correlations of with and (see Table 6) are stronger, though they still show a large amount of scatter (Figures 26 and 26). This is consistent with what Ponman et al. (1996) found in their study of Hickson compact groups. Since and are primarily determined by the depth of the potential well, whilst is related to the mass and density of hot gas, the relative strengths of these correlations, now found for both loose and compact groups, is that galaxy morphology is related to the depth of the potential rather than its gas content.


Comparing the - correlation with that seen in clusters (Edge & Stewart, 1991b), there is a large offset between the two relations. The cluster relation shows rising from 0.1 in hot clusters like Coma, to 0.5 in systems like Virgo, with = 2-3 keV. In contrast, a best fit trend through the G-sample - data, is fitted by , corresponding to a typically low value of for groups with 1 keV. Proper comparison of the group and cluster samples requires the application of consistent absolute magnitude limits to all systems, and lies beyond the scope of the present paper, but would be very worthwhile.
Although the relationship between and is not strong within the G-sample, when the full sample is considered, it becomes a great deal stronger (3.5), as shown in Figure 26. It is clear that galaxy halo sources, and X-ray undetected sources (which of course have lower than most G-sample groups) tend to have systematically higher than do X-ray bright groups. It seems that the presence of detectable hot intergalactic gas is related to galaxy morphology much more strongly that its luminosity.
In general, metallicities derived from ROSAT PSPC spectra must be regarded with considerable caution, since the spectral resolution of the instrument is very limited, and it is well known that serious biases can result if multi-temperature gas is fitted with a single-temperature hot plasma model (Buote & Fabian, 1998). Nonetheless, the 3 anticorrelation between metallicity and spiral fraction (Figure 26) is sufficiently strong to be worthy of comment. Taken at face value, this would seem to imply that most of the intergalactic metals have their origin in early-type galaxies. Such a result can be understood if the formation of early-type galaxies, either by galaxy merging or through some primordial collapse (or more likely early-epoch multiple merging) picture, results in the ejection of much of the enriched interstellar medium of the galaxy due to energy input from type II supernovae (Matteucci & Tornambe, 1987; Kauffmann & Charlot, 1998). However, the role of biases in ROSAT metallicity estimates is potentially sufficiently serious that this result requires careful checking with CCD quality spectra. This is underway at present.
Finally, in Figure 26, we show the relationship between spiral fraction and mean galaxy density. It was shown by Helsdon & Ponman (2003a) that groups display a morphology-density relation rather similar to clusters, in the sense that galaxies in regions of high surface density are more likely to be of early type. Here we see the opposite effect, in terms of the mean density of groups as a whole: there is a tendency, with a great deal of scatter, but significant at the 2.5 level (Table 6), for groups with the highest mean density to have higher . This is not necessarily in conflict with the Helsdon & Ponman (2003a) result, which was a local effect. If all these groups had virialised recently, we would actually expect them all to show the same mean density (as discussed in Section 6 above), so that no correlation at all would be expected between and , even if a local morphology-density relation were present. The fact that we see a systematic trend, suggests that the range of values of that we observe (which span a factor of 30) is not simply due to statistical scatter, but is subject to some systematic effects, which are related to the morphological mix in groups. For example, most of the groups with mean densities significantly higher than the expected value (marked in the Figure) have reasonably high values of . This could result from underestimation of their values, which are based on gas temperatures for most groups. One explanation could be that these groups are not fully virialised, so that their gas temperature has yet to rise to its final value.
9.2 Brightest group galaxies
The most striking correlation between the X-ray properties of groups, and their galaxy contents, which has been noted since early ROSAT studies of groups (Ebeling, Voges & Boehringer, 1994), is the presence of a bright early-type galaxy at the centre of the X-ray emission in virtually every X-ray bright group. This phenomenon is clearly apparent in the GEMS sample, as can be seen from Figure 28. Of our 35 G-sample systems, 32 have an early-type BGG, and in all but four of these, this galaxy lies at the centre of the group’s X-ray halo. As described in Section 3, we have defined our “brightest group galaxy” (BGG) to be the most optically luminous within 0.25 of the group centre, in order to avoid picking up outlying galaxies which may have recently fallen into a group. With this definition, we find that all but three of the systems with group-scale emission (hatched regions) have early-type BGGs. These three exceptions are HCG 16, HCG 48 and HCG 92. HCG 16 is well known as an unusual group dominated by spirals which shows significant intergalactic hot gas (Ponman et al., 1996; Dos Santos & Mamon, 1999), and probably corresponds to a system which is collapsed but not yet virialised (Belsole et al., 2003). HCG 92 is the well studied system Stephan’s Quintet, which contains a number of strongly interacting galaxies. None of the member galaxies lie at the centre of the X-ray emission, and high resolution observations (Pietsch et al., 1997; Sulentic et al., 2001) have shown sharp features in the X-ray emission, interpreted as intergalactic shocks. Like HCG 16, this appears to be a newly collapsed group. Finally, in HCG 48 the late-type BGG does appear to lie at the centre of the diffuse X-ray emission, although a bright elliptical is seen 71 kpc away in projection. The unusual properties of this group may be related to the fact that it appears to be falling into the nearby cluster Abell 1060, and its X-ray morphology is distorted into a coma-like shape.
The distribution of spiral fraction in detected and undetected groups can be seen from Figure 28 to differ primarily in that there is a set of groups with high and late-type BGGs, which almost invariably show no group-scale X-ray emission. It can be seen from Figure 28 that these systems (and indeed all groups without detectable group-scale hot gas) also have low velocity dispersions. It seems very likely that these systems are not yet fully collapsed and virialised, so that their IGM has not been heated and compressed to a point where it radiates detectable X-rays. Note however (e.g. from Figure 11) that these H and U-sample systems do not in general have low inferred mean densities. This is not entirely surprising, since they have been selected from group catalogues which are compiled using techniques which rely on a significant overdensity in the inferred 3-dimensional density, typically corresponding, for the catalogues we draw from, to a threshold factor of 20-80, relative to the mean density of the Universe – although all our systems appear to lie well above this threshold.


Figure 30 shows a highly significant (6, including all points in the plot) tendency for brighter BGGs to be found in richer groups (i.e. with higher total ). A similar, but less significant (2.5), correlation exists between and . These relationships are similar in character to those seen in the BCGs, found in richer systems, and represent an extension towards poorer systems of the trends with X-ray luminosity and temperature reported by Edge (1991). Studies of the K-band luminosities of BCGs (Burke, Collins & Mann 2000; Brough et al. 2002) in clusters spanning a range of redshifts and X-ray luminosities, show a correlation between and , although Brough et al. (2002) argue that this relation is weak in low redshift ( 0.1) clusters. Ours is a low redshift sample, and yet clearly does show such a correlation. This is in accord with the results of Burke et al. (2000), who found BCGs in the most X-ray luminous clusters to be standard candles, whilst for poor clusters ( 1044 in our cosmology) they find that lower luminosity clusters tend to contain less bright BCGs. Our results show that this trend continues through the group regime.
It seems very likely (Dubinski, 1998) that BCGs and BGGs are primarily assembled through galaxy merging. This idea is also supported, from the present study, by the fact that early-type BGGs tend to be more luminous (on average by a factor 1.8) than late-type BGGs. Since (other things being equal) the merger rate should be higher in systems with low velocity dispersion, it is of some interest to examine the relationship between and . This is shown in Figure 30, and shows a tendency (1.9) towards brighter BGGs in higher velocity dispersion systems. There is a strong clue here, that much of the merging involving the galaxies which we now see in the more luminous groups, must have happened at earlier epochs. We will return to this in Section 10.
Finally we examine the issue of the dominance of the group BGGs, and how this relates to other group properties. There is a class of groups, constituting 10% of X-ray bright systems (Jones et al., 2003), in which the galaxy contents are dominated by a single luminous elliptical at least two magnitudes brighter than the second ranked galaxy. These have been dubbed “fossil groups” (Ponman et al., 1994), or “overluminous elliptical galaxies” (Vikhlinin et al., 1999). These are found to have unusually high ratios of X-ray to optical luminosity, and are probably old groups in which the orbits of the major galaxies have had time to decay, leading to their merger into a central remnant (Jones et al., 2003). It has been suggested that the high ratios may result from high gas density (and hence high ) resulting from an early formation epoch (Jones et al., 2003), or from an unusually low star formation efficiency, leading to low (Vikhlinin et al., 1999). One might hope to derive some insights into the origin and properties of fossil groups from a study of the optical luminosity ratio between the first and second ranked galaxies () in the GEMS sample.
Only one of the GEMS systems qualifies as a fossil group, according to the definition of Jones et al. (2003), which requires 1042 -2 ( = /50) and 6.3 (2 magnitudes). This system is NGC 741, which safely passes both thresholds. However, it does not display the feature of high , which is a feature of previously studied fossil groups, nor does it display a high for its temperature, which Jones et al. (2003) suggest may be another characteristic property of fossil systems. A study of the relationship between and other statistical parameters, across the GEMS sample, reveals nothing very striking. For example, given the hypothesised link to merging, one might have expected to see a relationship with the spiral fraction or velocity dispersion of groups. However, neither of these shows any significant correlation (the relationship with is shown in Figure 31), nor is there any very substantial difference between the distribution of values for systems with early-type and late-type BGGs.
On the other hand, a parallel optical study of the luminosity function (Miles et al., 2004) has shown the presence of a distinctive dip in the luminosity function at -18 (which can be seen in Figure 2), especially in low groups. A study of the structure of GEMS galaxies (Khosroshahi et al., 2004), provides further motivation for the suggestion that this dip might be generated by the effects of galaxy merging, which will generate brighter galaxies, whilst leaving the dwarfs relatively unaffected (due to their small merger cross-sections). If this is the case, then it appears that the opening up of a dip at intermediate magnitudes is not reflected strongly in the difference between first and second ranked galaxies, until the fossil stage is reached. This is understandable if merging affects all the brighter galaxies in a group, rather than simply the central BGG.


10 Concluding Discussion
Although the GEMS groups cannot be regarded as a proper statistically-selected sample, they do span a wider range in group properties than any previous sample subjected to a thorough X-ray analysis and statistical investigation. This has resulted in a number of new results, and some challenges to findings from earlier work. Here we summarise and discuss some of the most important of these.
10.1 -
It has become widely accepted that the - relation steepens in the group regime, following in part the results of Ponman and co-workers, and much theoretical effort has been expended in trying to reproduce this steepening. It therefore comes as something of an embarrassment that the GEMS - relation is consistent with an extrapolation of the 3 trend seen in clusters. As we discussed in Section 7.1, this flatter - slope cannot be regarded at present as a secure result, since a number of biases resulting from the large scatter in the properties of poor groups, coupled with the observational selection effect against detecting groups with very low , conspire to systematically flatten the fitted relation. However, earlier results (e.g. Helsdon & Ponman, 2000b) based on X-ray-selected group samples, showing a slope of 4-5, must now be regarded as questionable. The origin of the flatter relation found here, appears to be primarily the inclusion of more groups with very low temperatures, some of which have surprisingly high X-ray luminosities.
Recent developments from studies of the entropy of groups and clusters tend to support the idea of a greater continuity in properties between the IGM in groups and clusters. The idea of a universal “entropy floor” (Ponman et al., 1999), which could have led to an isentropic IGM in the poorest systems (Babul et al., 2002), and hence to an - slope of 5, has now been shown to be incorrect in two ways. Firstly, individual groups do not show isentropic cores, as would be expected in such a simple preheating model (Pratt & Arnaud 2003; Ponman et al. 2003; Sun et al. 2003; Mushotzky 2003; Rasmussen & Ponman 2004; Khosroshahi, Jones & Ponman 2004), and secondly the scaling properties of entropy in clusters and groups appears to take the form of a “ramp”, rather than a “floor” (Ponman et al., 2003) - following the non-self-similar power law form , rather than breaking from the self-similar slope of unity at a well-defined temperature 1-2 keV, as was previously suggested (Lloyd-Davies, Ponman & Cannon, 2000). Given this continuity of properties, a (non-self-similar) power law form for the - relation is what one would expect.
10.2
We find several indications that the velocity dispersions of some poor groups are anomalously low. There are groups in our sample, such as HCG 16, HCG 22 and NGC 3665, which appear to have diffuse X-ray emission from a hot IGM (confirmed in the case of NGC 3665 and NGC 1587 by the Chandra observations of Helsdon et al. (2004)), and yet have velocity dispersions so low ( 100 ) that it is hard to understand how they can be virialised. These groups also have very low values of ( 0.3), and if is used to calculate their overdensity radii, then the inferred values of galaxy density tend to be very high (Figure 10). In Section 7.3, we discussed a number of statistical and physical effects which might lead to low values of , however, statistical scatter cannot account for the lack of poor systems with high values of , and statistical biases seem too weak to account for the very low values we observe. A more detailed investigation is required to determine whether alignment effects or tidal interactions can produce velocity dispersions as low as those observed.
10.3 Group radii
In order to make meaningful comparisons between the properties of groups and clusters, it is important to derive physical values within some well-defined overdensity radius. However, it has become apparent in the present study just how difficult it is to define a reliable value of ( is even more difficult) in galaxy groups. Their low surface brightness prohibits the mapping of gas pressure (which would allow the mass to be inferred) out to large radii, even in X-ray bright groups. Virial analyses are unreliable due to the sparse galaxy populations, and lensing studies unfeasible on individual groups due to their low projected mass densities.
Having investigated the use of scaling formulae based on , and , we have reservations about all three. appears to be the worst of the three, due to the large unexplained biases in velocity dispersion in some poor groups, discussed above. gives a much more stable and satisfactory estimate of group sizes, but there is some evidence that it may overestimate by up to 40% throughout the group regime. also appears to give fairly stable results, but since there are both theoretical and observational reasons to believe that the mass-to-light ratio may drop in low mass systems, a scaling formula based on constant star formation efficiency seems unwise. More work employing deep XMM-Newton observations, to clarify the relationships between group masses and the value for and would be of great value for future scaling studies.
10.4
As was discussed in Section 8, it seems curious that the lower value of compared to clusters, which we believe to be a robust result, is not reflected in any significant correlation between and within the GEMS sample. This appears to be another nail in the coffin of simple preheating models, which would lead to systematically flatter gas density profiles in the shallower potential wells of cool groups. We suggest that in our sample, such a weak trend may be obscured by fluctuations in the values of gas entropy between groups. This in turn may be driven by differences in the merger and star formation histories.
10.5
GEMS groups typically contain a much higher fraction of early-type galaxies than would be expected if one extrapolates the trends between and or established for clusters. This result is almost certainly related to the results of Helsdon & Ponman (2003b), who found that X-ray bright groups have lower than clusters, at a given projected density, and even at a given inferred 3-dimensional density. They interpreted this result as evidence that galaxy morphology may be related to the effects of galaxy interactions and mergers, which are enhanced in low velocity dispersion systems.
It seems clear (Figures 28 and 28) that there is a class of groups with low , and fairly high spiral fraction (including, in most cases, a late-type BGG) which show no group-scale X-ray emission. Since a hot, X-ray emitting IGM requires a collapsed group, both to heat the gas, and to raise its density to the point where its emission becomes detectable, it seems very probable that these undetected groups are not yet virialised, and represent late-forming groups. In a study of galaxy photometry for a subsample of 25 of the GEMS groups, Miles et al. (2004) find that groups with 51041 (including some which are undetected) show a pronounced dip in their galaxy luminosity functions, which may result from the effects of recent galaxy merging activity taking place in these low virialising systems.
10.6 BGGs
We confirm the very strong relationship between the presence of intergalactic X-ray emission, and the presence of a centrally located luminous early-type galaxy, which has been noted by many previous authors. This points strongly to the effects of galaxy merging having played an important role during the evolution of these systems. We do, however, find four groups from our G-sample, for which the early-type BGG does not lie at the centre of the X-ray emission, and a further three systems in which the BGG is of late-type, as discussed in Section 9.2, above. The presence of a small fraction of systems in which the BGG is offset is not surprising, given that groups are expected to experience mergers, during which their gravitational potentials will be perturbed. The three G-sample systems with late-type BGGs are all groups with compact cores. Two of them appear to be systems in the process of virialisation, in which the gas has been recently heated, but a luminous early-type BGG has yet to form. The status of HCG 48 is still problematical, and warrants more detailed study with better quality X-ray data.
Our richer groups tend to have more luminous BGGs (Figures 30 and 30), continuing a trend which has been noted in moderately rich clusters. Given the likelihood (Dubinski, 1998) that these dominant early-type galaxies have been formed through multiple mergers, coupled with the strong inverse dependence of the merger cross-section on (Makino & Hut, 1997), the positive correlation seen in Figure 30 strongly suggests that much of this merging has taken place at earlier epochs, in substructures which have since merged to form the groups we observe today, since at the present epoch merging should be more effective in groups with low values of .
11 Acknowledgements
We would like to thank the other members of the GEMS project, especially Somak Raychaudhury, Duncan Forbes, Stephen Helsdon and Frazer Pearce, for their contributions to this work. We are also grateful to Alastair Sanderson and Don Horner for their help in making comparisons with cluster properties, and to the referee for pointing out a number of areas where clarification was required. This research has made use of the LEDAS database at the University of Leicester, the NASA-IPAC Extragalactic Database, and optical images from the STScI Digitised Sky Survey. The authors also acknowledge the support of a studentship (JPFO) and a Senior Fellowship (TJP) from the Particle Physics and Astronomy Research Council.
References
- Allen & Fabian (1998) Allen S. W., Fabian A. C., 1998, MNRAS, 297, 57
- Allen et al. (2001) Allen S. W., Schmidt R. W., Fabian A. C., 2001, MNRAS, 328, L37
- Arnaud & Evrard (1999) Arnaud M., Evrard A. E., 1999, MNRAS, 305, 631
- Babul et al. (2002) Babul A., Balogh M. L., Lewis G. F., Poole G. B., 2002, MNRAS, 330, 329
- Bahcall & Comerford (2002) Bahcall N. A., Comerford J. M., 2002, ApJ, 565, L5
- Balogh et al. (1999) Balogh M. L., Babul A., Patton D. R., 1999, MNRAS, 307, 463
- Barton et al. (1996) Barton E., Geller M. J., Ramella M., Marzke R. O., da Costa L. N., 1996, AJ, 112, 871
- Belsole et al. (2003) Belsole E., Sauvageot J. L., Ponman T. J., Bourdin H., 2003, A&A, 398, 1
- Benson et al. (2000) Benson A. J., Cole S., Frenk C. S., Baugh C. M., Lacey C. G., 2000, MNRAS, 311, 793
- Bird et al. (1995) Bird C. M., Mushotzky R. F., Metzler C. A., 1995, ApJ, 453, 40
- Blanton et al. (2003) Blanton M. R., Hogg D. W., Bahcall N. A., Brinkmann J., Britton M., Connolly A. J., Csabai I., Fukugita M., Loveday J., Meiksin A., Munn J. A., Nichol R. C., Okamura S., Quinn T., Schneider D. P., Shimasaku K., Strauss M. A., Tegmark M., Vogeley M. S., Weinberg D. H., 2003, ApJ, 592, 819
- Böhringer et al. (2000) Böhringer H., Voges W., Huchra J. P., McLean B., Giacconi R., Rosati P., Burg R., Mader J., Schuecker P., Simiç D., Komossa S., Reiprich T. H., Retzlaff J., Trümper J., 2000, ApJS, 129, 435
- Brough et al. (2002) Brough S., Collins C. A., Burke D. J., Mann R. G., Lynam P. D., 2002, MNRAS, 329, L53
- Buote & Fabian (1998) Buote D. A., Fabian A. C., 1998, MNRAS, 296, 977
- Burke et al. (2000) Burke D. J., Collins C. A., Mann R. G., 2000, ApJ, 532, L105
- Cavaliere et al. (1999) Cavaliere A., Menci N., Tozzi P., 1999, MNRAS, 308, 599
- Dickey & Lockman (1990) Dickey J. M., Lockman F. J., 1990, ARA&A, 28, 215
- Dos Santos & Mamon (1999) Dos Santos S., Mamon G. A., 1999, A&A, 352, 1
- Dubinski (1998) Dubinski J., 1998, ApJ, 502, 141
- Ebeling et al. (1994) Ebeling H., Voges W., Boehringer H., 1994, ApJ, 436, 44
- Edge (1991) Edge A. C., 1991, MNRAS, 250, 103
- Edge & Stewart (1991a) Edge A. C., Stewart G. C., 1991a, MNRAS, 252, 414
- Edge & Stewart (1991b) Edge A. C., Stewart G. C., 1991b, MNRAS, 252, 428
- Evrard et al. (1996) Evrard A. E., Metzler C. A., Navarro J. F., 1996, ApJ, 469, 494
- Feigelson & Babu (1992) Feigelson E. D., Babu G. J., 1992, ApJ, 397, 55
- Finoguenov et al. (2001) Finoguenov A., Reiprich T. H., Böhringer H., 2001, A&A, 368, 749
- Fouque et al. (1992) Fouque P., Gourgoulhon E., Chamaraux P., Paturel G., 1992, A&AS, 93, 211
- Frederic (1995) Frederic J. J., 1995, ApJS, 97, 259
- Fukugita et al. (1995) Fukugita M., Shimasaku K., Ichikawa T., 1995, PASP, 107, 945
- Garcia (1993) Garcia A. M., 1993, A&AS, 100, 47
- Geller & Huchra (1983) Geller M. J., Huchra J. P., 1983, ApJS, 52, 61
- Girardi et al. (1998) Girardi M., S. B., Giuricin G., Mardirossian F., Mezzetti M., 1998, ApJ, 506, 45
- Giudice (1999) Giudice G., 1999, in Giuricin G., Mezzetti M., Salucci P., eds, ASP Conf. Ser. 176: Observational Cosmology: The Development of Galaxy Systems Vol. 176, Properties of nearby groups of galaxies. Bolzano, p. 136
- Helsdon & Ponman (2000a) Helsdon S. F., Ponman T. J., 2000a, MNRAS, 315, 356
- Helsdon & Ponman (2000b) Helsdon S. F., Ponman T. J., 2000b, MNRAS, 319, 933
- Helsdon & Ponman (2003a) Helsdon S. F., Ponman T. J., 2003a, MNRAS, 339, L29
- Helsdon & Ponman (2003b) Helsdon S. F., Ponman T. J., 2003b, MNRAS, 340, 485
- Helsdon & Ponman (2004) Helsdon S. F., Ponman T. J., 2004, in prep.
- Helsdon et al. (2004) Helsdon S. F., Ponman T. J., Mulchaey J. S., 2004, submitted to ApJ
- Hickson (1982) Hickson P., 1982, ApJ, 255, 382
- Hickson (1997) Hickson P., 1997, ARA&A, 35, 357
- Hoekstra et al. (2001) Hoekstra H., Franx M., Kuijken K., Carlberg R. G., Yee H. K. C., Lin H., Morris S. L., Hall P. B., Patton D. R., Sawicki M., Wirth G. D., 2001, ApJ, 548, L5
- Horner (2001) Horner D. J., 2001, PhD Thesis, University of Maryland
- Hradecky et al. (2000) Hradecky V., Jones C., Donnelly R. H., Djorgovski S. G., Gal R. R., Odewahn S. C., 2000, ApJ, 543, 521
- Huchra & Geller (1982) Huchra J., Geller M., 1982, ApJ, 257, 423
- Hwang et al. (1999) Hwang U., Mushotzky R. F., Burns J. O., Fukazawa Y., White R. A., 1999, ApJ, 516, 604
- Jones et al. (2003) Jones L. R., Ponman T. J., Horton A., Babul A., Ebeling H., Burke D. J., 2003, MNRAS, 343, 627
- Kauffmann & Charlot (1998) Kauffmann G., Charlot S., 1998, MNRAS, 294, 705
- Khosroshahi et al. (2004) Khosroshahi H. G., Jones L. R., Ponman T. J., 2004, submitted to MNRAS
- Khosroshahi et al. (2004) Khosroshahi H. G., Raychaudhury S., Ponman T. J., Miles T. M., Forbes D. A., 2004, submitted to MNRAS
- Ledlow et al. (1996) Ledlow M. J., Loken C., Burns J. O., Hill J. M., White R. A., 1996, AJ, 112, 388
- Lin et al. (2003) Lin Y., Mohr J. J., Stanford S. A., 2003, ApJ, 591, 749
- Lloyd-Davies et al. (2000) Lloyd-Davies E. J., Ponman T. J., Cannon D. B., 2000, MNRAS, 315, 689
- Mahdavi (2001) Mahdavi A., 2001, ApJ, 546, 812
- Mahdavi et al. (1997) Mahdavi A., Boehringer H., Geller M. J., Ramella M., 1997, ApJ, 483, 68
- Mahdavi et al. (2000) Mahdavi A., Böhringer H., Geller M. J., Ramella M., 2000, ApJ, 534, 114
- Makino & Hut (1997) Makino J., Hut P., 1997, ApJ, 481, 83
- Mamon (1994) Mamon G. A., 1994, in Durret F., Mazure A., Tran Thanh Van J., eds, Clusters of Galaxies Gif-sur-Yvette, Frontieres, p. 291
- Markevitch (1998) Markevitch M., 1998, ApJ, 504, 27
- Matteucci & Tornambe (1987) Matteucci F., Tornambe A., 1987, A&A, 185, 51
- Mewe et al. (1986) Mewe R., Lemen J. R., van den Oord G. H. J., 1986, A&AS, 65, 511
- Miles et al. (2004) Miles T. A., Raychaudhury S. R., Forbes D. A., Goudfrooij P., 2004, submitted to MNRAS
- Mohr et al. (1999) Mohr J. J., Mathiesen B., Evrard A. E., 1999, ApJ, 517, 627
- Muanwong et al. (2002) Muanwong O., Thomas P. A., Kay S. T., Pearce F. R., 2002, MNRAS, 336, 527
- Mulchaey (2000) Mulchaey J. S., 2000, ARA&A, 38, 289
- Mulchaey et al. (1996) Mulchaey J. S., Davis D. S., Mushotzky R. F., Burstein D., 1996, ApJ, 456, 80
- Mulchaey et al. (2003) Mulchaey J. S., Davis D. S., Mushotzky R. F., Burstein D., 2003, ApJS, 145, 39
- Mulchaey & Zabludoff (1998) Mulchaey J. S., Zabludoff A. I., 1998, ApJ, 496, 73
- Mushotzky (2003) Mushotzky R., 2003, in IAU Symposium X-ray emission from clusters of galaxies
- Navarro et al. (1995) Navarro J. F., Frenk C. S., White S. D. M., 1995, MNRAS, 275, 720
- Nevalainen et al. (2000) Nevalainen J., Markevitch M., Forman W., 2000, ApJ, 532, 694
- Nolthenius (1993) Nolthenius R., 1993, ApJS, 85, 1
- O’Sullivan et al. (2003) O’Sullivan E. J., Ponman T. J., Collins R. S., 2003, MNRAS, 340, 1375
- O’Sullivan & Ponman (2004) O’Sullivan E. J., Ponman T. J., 2004, submitted to MNRAS
- Pietsch et al. (1997) Pietsch W., Trinchieri G., Arp H., Sulentic J. W., 1997, A&A, 322, 89
- Pildis et al. (1995) Pildis R. A., Bregman J. N., Evrard A. E., 1995, ApJ, 443, 514
- Ponman et al. (1994) Ponman T. J., Allan D. J., Jones L. R., Merrifield M., McHardy I. M., Lehto H. J., Luppino G. A., 1994, Nature, 369, 462
- Ponman et al. (1996) Ponman T. J., Bourner P. D. J., Ebeling H., Böhringer H., 1996, MNRAS, 283, 690
- Ponman et al. (1999) Ponman T. J., Cannon D. B., Navarro J. F., 1999, Nature, 397, 135
- Ponman et al. (2003) Ponman T. J., Sanderson A. J. R., Finoguenov A., 2003, MNRAS, 343, 331
- Pratt & Arnaud (2003) Pratt G. W., Arnaud M., 2003, A&A, 408, 1
- Ramella et al. (1997) Ramella M., Pisani A., Geller M. J., 1997, AJ, 113, 483
- Rasmussen & Ponman (2004) Rasmussen J., Ponman T. J., 2004, submitted to MNRAS
- Sanderson et al. (2003) Sanderson A. J. R., Ponman T. J., Finoguenov A., Lloyd-Davies E. J., Markevitch M., 2003, MNRAS, 340, 989
- Sanderson & Ponman (2003) Sanderson A. J. R., Ponman T. J., 2003, MNRAS, 345, 1241
- Sato et al. (2000) Sato S., Akimoto F., Furuzawa A., Tawara Y., Watanabe M., Kumai Y., 2000, ApJ, 537, L73
- Sulentic et al. (2001) Sulentic J. W., Rosado M., Dultzin-Hacyan D., Verdes-Montenegro L., Trinchieri G., Xu C., Pietsch W., 2001, AJ, 122, 2993
- Sun et al. (2003) Sun M., Forman W., Vikhlinin A., Hornstrup A., Jones C., S. M. S., 2003, ApJ, 598
- Tully (1987) Tully R. B., 1987, ApJ, 321, 280
- Verde et al. (2002) Verde L., Heavens A. F., Percival W. J., Matarrese S., Baugh C. M., Bland-Hawthorn J., Bridges T., Cannon R., Cole S., Colless M., Collins C., Couch W., Dalton G., De Propris R., Driver S. P., Efstathiou G., Ellis R. S., Frenk C. S., Glazebrook K., Jackson C., Lahav O., Lewis I., Lumsden S., Maddox S., Madgwick D., Norberg P., Peacock J. A., Peterson B. A., Sutherland W., Taylor K., 2002, MNRAS, 335, 432
- Vikhlinin et al. (1999) Vikhlinin A., Forman W., Jones C., 1999, ApJ, 525, 47
- White et al. (1997) White D. A., Jones C., Forman W., 1997, MNRAS, 292, 419
- White et al. (1999) White R. A., Bliton M., Bhavsar S. P., Bornmann P., Burns J. O., Ledlow M. J., Loken C., 1999, ApJ, 118, 2014
- Wu & Xue (2002) Wu X., Xue Y., 2002, ApJ, 572, L19
- Wu et al. (1999) Wu X., Xue Y., Fang L., 1999, ApJ, 524, 22
- Xue & Wu (2000) Xue Y., Wu X., 2000, ApJ, 538, 65
- Zabludoff & Mulchaey (1998) Zabludoff A. I., Mulchaey J. S., 1998, ApJ, 496, 39
- Zabludoff & Mulchaey (2000) Zabludoff A. I., Mulchaey J. S., 2000, ApJ, 539, 136