High Angular Resolution Mid-infrared Imaging of Young Stars in Orion BN/KL
Abstract
We present Keck LWS images of the Orion BN/KL star forming region obtained in the first multi-wavelength study to have - resolution from m to m. The young stellar objects designated infrared source n and radio source I are believed to dominate the BN/KL region. We have detected extended emission from a probable accretion disk around source n but infer a stellar luminosity on the order of only 2000 L⊙. Although source I is believed to be more luminous, we do not detect an infrared counterpart even at the longest wavelengths. However, we resolve the closeby infrared source, IRc2, into an arc of knots AU long at all wavelengths. Although the physical relation of source I to IRc2 remains ambiguous, we suggest these sources mark a high density core (- pc-3 over AU) within the larger BN/KL star forming cluster. The high density may be a consequence of the core being young and heavily embedded. We suggest the energetics of the BN/KL region may be dominated by this cluster core rather than one or two individual sources.
1 Introduction
Orion BN/KL is the closest region of high-mass star formation ( pc) and though also the archetype, it is not necessarily well understood (e.g., Genzel & Stuzki, 1989). For instance, the sources that drive extensive outflow activity in BN/KL (e.g., Wright et al., 1996) and contribute most to its luminosity have not been identified with certainty (e.g., Menten & Reid, 1995). This is true because BN/KL is crowded, exhibiting compact infrared (IR) peaks distributed over and because extinction is high and variable across the region (Gezari et al., 1998). As high-mass stars often form in clusters (Garay & Lizano, 1999, and references therein), there are presumably numerous embedded protostars and young stellar objects (YSOs) in the region, many of which have probably not been recognized yet.
Two notable sources in BN/KL exhibit centimeter-wave continuum and as a result are believed to be luminous YSOs, IR source n (Lonsdale et al., 1982) and radio source I (Churchwell et al., 1987). Source n, also known as radio source L (Churchwell et al., 1987), exhibits a bipolar radio jet (Menten & Reid, 1995), hard X-ray emission (Garmire et al., 2000; Feigelson et al., 2002), and m CO overtone emission probably from the hot surface of an accretion disk (Luhman et al., 2000). Source I has been difficult to study because it has not been detected at IR wavelengths, probably due to high extinction. It lies close to the mid-IR source IRc2 (Gezari, 1992; Menten & Reid, 1995) for which (Gezari et al., 1998) and the peak of the Orion Hot Core, for which probably (Genzel & Stuzki, 1989; Migenes et al., 1989; Plambeck et al., 1995). However, source I excites H2O and SiO maser emission in dense, hot material at radii AU (Genzel & Stuzki, 1989; Gezari, 1992), which may be used to study gas dynamics in detail (e.g., Greenhill et al., 1998, 2003).
We have imaged BN/KL in the mid-IR at resolutions of - with the intention to characterize sources of excitation. This is the first multiwavelength study with sub-arcsecond resolution up to m. (cf., Dougados et al., 1993; Rouan et al., 2004; Shuping et al., 2004). We concentrate on a largely qualitative interpretation of the data. Quantitative modeling and analysis of the whole region will be discussed in a separate paper.
2 Observations and Reduction
We observed the BN/KL region with the Keck-I telescope on 1999 December 21, 2000 October 14, and 2002 August 20. We used the Long Wavelength Spectrometer (LWS; Jones & Puetter 1993) in imaging mode at seven filter wavelengths from m to m (Table 1) to obtain frames of 128128 pixels (), with which we created mosaics. We chopped at 5 Hz and nodded the telescope both using fields west in 1999 and 2002 and north in 2000. Registration of overlapping frames is uncertain to pixel. To register images obtained at different wavelengths, we used the peak of the Becklin-Neugebauer object (BN) as a reference. When BN lay outside a mosaic, we used IRc7. The formal uncertainty in registration is pixel.
We used observing procedures and data reduction techniques discussed by Gezari et al. (1992) and implemented in the MOSAIC image processing package (Varosi & Gezari, 1993). Observations of CMa demonstrated the high quality of the point source responses. Images at m and longer wavelengths are diffraction limited (-), while seeing, chopping/nodding error, and smoothing during processing limit resolution to for shorter wavelengths. To calibrate flux densities, we scaled images at each wavelength to match the intensities for BN or IRc7 reported by Gezari et al. (1998), interpolated to the LWS passbands (Table 1).
We calibrated the pixel scale to first order using observations in 1999 of the binary XY Per for which we adopted a separation and position angle (Bertout, Robichon, & Arenou, 1999). We made second order adjustments to align the IR and radio centroids of BN and source n on a m mosaic, where we defined the radio centroid for source n as the midpoint between the lobes. The adopted scale and rotation were pixel-1 and clockwise (i.e., north is rotated counterclockwise from vertical on the images). Uncertainties of 1-2% and include the yr-1 proper motion for BN (Plambeck et al., 1995). We rechecked the plate scale in 2002 with observations of Her, for which we adopted a separation and position angle (Mason et al., 2000; Docobo et al., 2000), and obtained pixel-1 and clockwise, with uncertainties of 2% and , in good agreement with earlier results.
We adopted the 1999 plate scale for images obtained in 2000 because a parallelogram distortion precluded our estimating a new solution. However, because the sub-fields shown here are small (containing just IRc2 and IRc7) the resulting errors are pixels. We estimated this error empirically by registering the peak of IRc7 observed at m in 2000 and 1999, applying the registration offsets to images from 2000 for other wavelengths, and measuring the misalignment in the peaks of IRc2.
To register the radio position of source I on the IR images, we assumed the radio and IR centroids for BN were coincident and used the angular separation of BN and source I estimated by Menten & Reid (1995). For images obtained in 2000, we measured angular offsets from (closeby) IRc7 to minimize the effect of the parallelogram distrotion. The total uncertainty in radio-IR registration is 1-2 pixels. (We note that the proper motion of BN contributes only a pixel error to the registration.)
3 Results and Discussion
3.1 Source n as an intermediate luminosity star
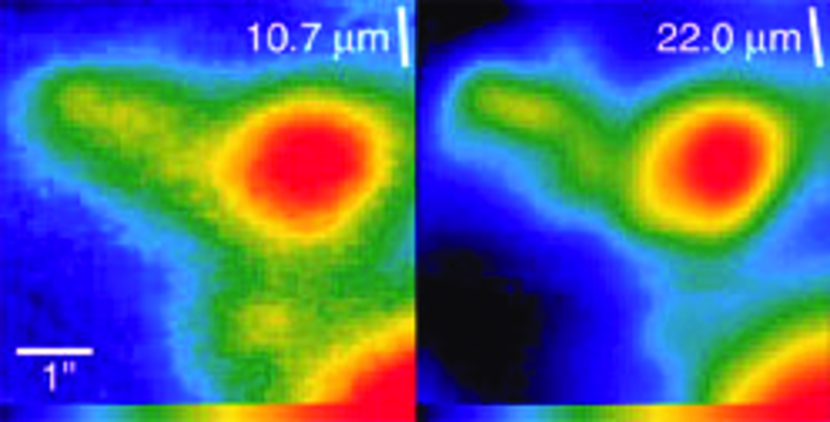
We have found that emission from source n at m and m is elongated nearly east-west (Figure 1) and orthogonal to the bipolar radio structure detected previously by Menten & Reid (1995). In contrast, other sources in the m and m images are not elongated (e.g., IRc7). We propose that the elongation arises from warm dust in the accretion disk inferred previously from the presence of CO overtone emission at m (Luhman et al., 2000). We fit a single component elliptical Gaussian model to each image. At m, the source size (half power full width)is , and at m, the size is ( AU). The position angles are and , respectively, while the position angle of the bipolar radio structure is . The shape of source n at longer wavelengths is more uncertain, because of plateau emission between IRc4 and IRc7. However, if we assume the disk emits as a blackbody peaking close to the shortest wavelength at which it is detected (m), then the characteristic temperature is on the order of 300 K.
Although source n is extended at mid-IR wavelengths, it is point-like in high angular resolution observations from m to m (Dougados et al., 1993; Stolovy et al., 1998). This near-IR emission may arise from the inner edge of the accretion disk, close to where dust is sublimated. For the disks of Herbig AeBe stars that are resolved with interferometry, this inner radius is AU (Tuthill et al., 2001; Monnier & Millan-Gabet, 2002). At the distance of BN/KL, the near-IR emission would subtend , thus explaining its point-like appearance in observations so far.
The luminosity of source n is not known. However, mid-IR emission from an accretion disk may be expected to arise from surface material heated by stellar radiation, and we can use the characteristic radius, R, and temperature, T, to estimate the luminosity of source n, . Dust near the surface of the disk is optically thick to stellar radiation (mostly optical and ultraviolet) but optically thin to re-emission (mostly mid-IR). For thermal equilibrium, , where and are grain emissivities for emission and absorption, and is the Stefan-Boltzmann constant. For absorption of stellar radiation, , while for re-emission, , where is a characteristic grain size. For m and m (typical for interstellar dust), and L⊙ (mid B-type). This luminosity is consistent with the observation that at m source n is times dimmer than BN (1-2 L⊙; Scoville et al. 1983), given that source n is 1.2 magnitudes less red between m and m (Luhman et al., 2000), if we assume the two stars have approximately the same intrinsic near-IR color. Nonetheless, the estimated luminosity should be regarded with caution. It depends on uncertain values for and rather than radiative transfer modeling of the spectral energy distribution, and the estimated luminosity exceeds the apparent luminosity of L⊙ (Table 1). Moreoever, identification of source n as a hard X-ray source is a concern since a B-type star is unlikely to be active, though the X-rays may be associated with a less massive companion or the jet.
3.2 Source I, IRc7, and IRc2
An IR counterpart to radio source I is long soughtafter. The LWS observations are the first to resolve the angular separation between source I and the comparatively bright IRc2 at wavelengths up to m. Nonetheless, we do not detect emission from a counterpart with an upper limit on the order of 1 Jy at m and 10 Jy at m. We suggest that emission from source I is blocked by the Orion Hot Core. Plambeck et al. (1995) estimate the average optical depth of the core is at mm. The wavelength scaling of opacity to shorter wavelengths is uncertain because it depends on grain composition and the amount of processing. However, if we assume spherical silicate dust grains (Mathis, 1990), then the optical depth is at m and m. This is sufficient to obscure the mid-IR dust emission from a K blackbody of diameter up to 80 AU and luminosity up to L⊙, which is comparable to the luminosity of the BN/KL region (Gezari et al., 1998). It is also sufficiently large to explain nondetection at m in Hubble Space Telecope (HST) and Keck observations (Stolovy et al., 1998; Hillenbrand & Carpenter, 2000).
IRc7 is relatively compact and prominent at all observed wavelengths longer than m (Figures 2 and 3). This is probably indicative of star formation at a relatively early phase. IRc7 also lies close (in projection) to the radio axis of source n (Stolovy et al., 1998), and HST observations at m have detected a fan of emission opening away from source n with a bright point at the vertex. This morphology and orientation may signify interaction with radiation and outflow incident from source n. Alternatively the near-IR fan may be a scatting cone along the rotation axis of a protostellar system embedded in an optically thin envelope or halo.
IRc2 is shaped like a AU long arc that opens to the southwest, in the direction of source I, which lies close to one end (Figure 2). The locations of knots along the arc depend on wavelength and are distributed to from source I. Similar emission distributions at and m are reported by Dougados et al. (1993), Rouan et al. (2004), and Shuping et al. (2004). Emission at the shorter wavelengths is the closest to source I while emission at m is among the farthest (Figure 3). Although suggestive of central heating, emission at wavelengths near the peaks of the silicate absorption features at m and m also tends to lie away from source I (Figures 2 and 3). If local extinction toward source I is enhanced, then it is surprising that the short wavelength emission arises closeby to source I. At the same time, we note that the shortest wavelength emission yet detected from IRc2, at m, is associated with the knot “B” (Dougados et al., 1993), from source I (Stolovy et al., 1998; Hillenbrand & Carpenter, 2000).
The relationship of IRc2 to source I is ambiguous. Because massive stars form in clusters, we speculate that the knots in IRc2 may be individual sites of star formation, which together with source I form at least part of a high density core within the larger () BN/KL star forming cluster. In support of this we note that (1) the relative distributions of emission in IRc2 from m to m do not exhibit an overall systematic pattern (e.g., central heating), and (2) knot “C” (Dougados et al., 1993) is both closely associated with a cluster of OH masers (Figure 2) and X-ray emission (E. Feigelson, private communication). (If the X-ray emission is the result of a wind driven by source I, then other knots would probably be X-ray sources as well.) The inferred characteristic density of - pc-3 over AU is unusually large and greatly exceeds the density of the closeby Trapezium (Hillenbrand & Hartmann, 1998). Because high cluster densities are associated with high stellar masses (Testi et al., 1999, and references therein) we might expect to observe precursors to O-type stars, but the large density may be due to cluster youth. As clusters evolve they expand because of stellar dynamics and the expulsion of gas (Kroupa, 2004, and references therein). Clusters that are still deeply embedded may be expected to exhibit unusually high central densities though observational evidence is weak.
We cannot yet exclude the possibility that IRc2 is heated externally, by source I. The tip of IRc2 recedes systematically as wavelength increases from m to m (Figure 2), which is suggestive of a local temperature gradient. In principle, IRc2 could mark the edge of a wind-blown cavity. Relying on maps of SiO masers Greenhill et al. (1998) propose that source I drives a conical outflow to the north and west, which IRc2 just happens to subtend. Greenhill et al. (2003) present an alternative model in which source I binds an edge-on flared disk whose limbs extend north and west from the star. In this case IRc2 straddles the disk plane. The mid-IR arc would comprise irradiated disk surface material and peripheral low latitude material heated by other YSOs.
4 Conclusions
We have detected the probable signature of an accretion disk around source n at mid-IR wavelengths, and we estimate the stellar luminosity is L⊙. We have not identified any counterpart to radio source I, despite higher angular resolution and broader wavelength coverage than previous studies. We resolve IRc2 into knots at up to m and propose that they are sites of star formation. Together, source I and IRc2 may mark the dense core (- M⊙ pc-3) of the larger BN/KL infrared cluster. Many past studies have sought to demonstrate that luminosity and outflow associated with BN/KL are driven by one or two sources. This seems increasingly unlikely. We note that source n has only a modest luminosity and its jet axis is poorly aligned with outflow axes observed on scales of AU (e.g., Schultz et al., 1999). Moreover, members of the putative IRc2-source I subcluster are ready candidates to drive outflow collectively. In a later paper, we will present a radiative model of the LWS data, with estimates of dust temperatures, line-of-sight optical depths, and intrinsic luminosities for the dominant mid-IR sources in BN/KL.
References
- Bertout, Robichon, & Arenou (1999) Bertout, C., Robichon, N.,& Arenou, F. 1999, A&A, 352, 574
- Churchwell et al. (1987) Churchwell, E., Felli, M., Wood, D. O. S., & Massi, M. 1987, ApJ, 321, 516
- Docobo et al. (2000) Docobo, J. A., Tamazian, V. S., Balega, Y. Y., Blanco, J., Maximov, A. F., & Vasyuk, V. A., 2000, A&A 366, 868
- Dougados et al. (1993) Dougados, C., Lena, P., Ridgway, S. T., Christou, J. C.& Probst, R. G. 1993, ApJ, 406, 112
- Feigelson et al. (2002) Feigelson, E. D. et al. 2002, ApJ, 574, 258
- Garay & Lizano (1999) Garay, G., & Lizano, S. 1999, PASP, 111, 1049
- Garmire et al. (2000) Garmire, G., Feigelson, E. D., Broos, P., Hillenbrand, L. A., Pravdo, S. H., Tonwsley, L., & Tsuboi, Y. 2000, AJ, 120, 1426
- Genzel & Stuzki (1989) Genzel, R., & Stuzki, J. 1981, ARA&A, 27, 41
- Gezari (1992) Gezari, D. Y. 1992, ApJ, 396, L43
- Gezari et al. (1992) Gezari, D., Folz, W., Woods, L., & Varosi, F. 1992, PASP, 104, 191
- Gezari et al. (1998) Gezari, D. Y., Backman, D. & Werner, M. W. 1998, ApJ, 509, 283
- Greenhill et al. (1998) Greenhill, L. J., Gwinn, C. R., Schwartz, C., Moran, J. M., Diamond, P. J. 1998, Nature, 396, 650
- Greenhill et al. (2003) Greenhill, L. J., Chandler, C. J., Reid, M. J., Diamond, P. J., & Moran, J. M. 2003, Proc. IAU Symp 221, eds. M. Burton, R. Jayawardhana, & T. Bourke ASP Conference Series, in press.
- Hillenbrand & Hartmann (1998) Hillenbrand, L. A. & Hartmann, L. W. 1998, ApJ, 492, 540
- Hillenbrand & Carpenter (2000) Hillenbrand, L. A., & Carpenter, J. M. 2000, ApJ, 540, 236
- Johnston et al. (1989) Johnston, K. J., Migenes, V., & Norris, R. P. 1989, ApJ, 341, 847
- Jones & Puetter (1993) Jones, B., & Puetter, R. 1993, Proc. SPIE, 1946, 610
- Kroupa (2004) Kroupa, P. 2004, New Astr Rev, in press
- Lonsdale et al. (1982) Lonsdale, C. J., Becklin, E. E., Lee, T. J., & Stewart, J. M. 1982, AJ, 87, 1819
- Luhman et al. (2000) Luhman, K. L., et al. 2000, ApJ, 544, 1016
- Mason et al. (2000) Mason, B. D., et al. 2000, AJ, 120, 1120
- Mathis (1990) Mathis, J. S. 1990, ARAA, 28, 37
- Menten & Reid (1995) Menten, K. M., & Reid, M. J. 1995, ApJ, 445, 157
- Migenes et al. (1989) Migenes, V., Johnston, K. J., Pauls, T. A., & Wilson, T. L. 1989, ApJ, 347, 294
- Monnier & Millan-Gabet (2002) Monnier, J. D. & Millan-Gabet, R. 2002, ApJ, 579, 694
- Plambeck et al. (1995) Plambeck, R. L., Wright, M. C. H., Mundy, L. G. & Looney, L. W. 1995, ApJ, 455, L189
- Rouan et al. (2004) Rouan, D. et al. 2004, A&A, in prep.
- Schultz et al. (1999) Schultz et al. 1999, ApJ, 511, 282
- Scoville et al. (1983) Scoville, N., Kleinmann, S. G., Hall, D. N. B., & Ridgway, S. T. 1983, ApJ, 275, 201
- Shuping et al. (2004) Shuping, R. Y., Morris, M., & Bally, J. 2004, AJ, submitted
- Stolovy et al. (1998) Stolovy, S., et al. 1998, ApJ, 492, L151
- Testi et al. (1999) Testi, L., Palla, F., & Natta, A. 1999, A&A, 342, 515
- Tuthill et al. (2001) Tuthill, P. G., Monnier, J. D., & Danchi, W. C. 2001, Nature, 409, 1012
- Varosi & Gezari (1993) Varosi, F. & Gezari, D. Y. 1993, “Astronomical Data Analysis Software and Systems II,” PASP Conf Series, 52, 393
- Wright et al. (1996) Wright, M. C. H., Plambeck, R. L., Wilner, D. J. 1996, ApJ, 469, 216
| Filter | Band | Ep.(a)(a)Epoch for the tabulated photometry (see Section 2). | IRc2 | IRc7 | n | BN |
|---|---|---|---|---|---|---|
| (m) | (m) | (Jy arcsec-2)(b)(b)Intensities are uncertain to . The zero level was taken from a sky position south of source I. Plateau emission between IRc4 and IRc7 has been subtracted in the case of source n. Images are scaled to match listed IRTF peak intensities for BN, or IRc7 at m (Gezari et al., 1998) interpolated to LWS passbands. | ||||
| 4.7 (M) | 4.4-5.0 | 2 | 0.64 | 0.15 | 58 | |
| 8.0 | 7.5-8.2 | 1 | 15 | 5.0 | 4.4 | |
| 10.7 | 10.0-11.4 | 3 | 1.3 | 2.6 | 0.96 | 93 |
| 11.7 | 11.2-12.2 | 3 | 4.9 | 7.2 | 2.4 | 140 |
| 12.5 | 12.0-13.0 | 1 | 13 | 17 | 3.3 | 152 |
| 17.65 | 17.3-18.2 | 3 | 16 | 34 | 2.3 | 175 |
| 22.0 | 21.0-23.0 | 3 | 43 | 86 | 3.2 | 190 |