RXTE all-sky slew survey. Catalog of X-ray sources at
We report results of a serendipitous hard X-ray (3–20 keV), nearly all-sky () survey based on RXTE/PCA observations performed during satellite reorientations in 1996–2002. The survey is 80% (90%) complete to a 4 limiting flux of (2.5) erg s-1 cm-2 in the 3–20 keV band. The achieved sensitivity in the 3–8 keV and 8–20 keV subbands is similar to and an order of magnitude higher than that of the previously record HEAO-1 A1 and HEAO-1 A4 all-sky surveys, respectively. A combined sq. deg area of the sky is sampled to flux levels below erg s-1 cm-2 (3–20 keV). In total 294 sources are detected and localized to better than 1 deg. 236 (80%) of these can be confidently associated with a known astrophysical object; another 22 likely result from the superposition of 2 or 3 closely located known sources. 35 detected sources remain unidentified, although for 12 of these we report a likely soft X-ray counterpart from the ROSAT all-sky survey bright source catalog. Of the reliably identified sources, 63 have local origin (Milky Way, LMC or SMC), 64 are clusters of galaxies and 100 are active galactic nuclei (AGN). The fact that the unidentified X-ray sources have hard spectra suggests that the majority of them are AGN, including highly obscured ones ( cm-2). For the first time we present a – diagram for extragalactic sources above erg s-1 cm-2 at 8-20 keV.
Key Words.:
cosmology:observations – diffuse radiation – X-rays:general1 Introduction
The deep surveys performed recently in the standard X-ray band (2–10 keV) with the Chandra and XMM-Newton observatories (e.g. Brandt et al. (2001), Hasinger et al. (2001)) have convincingly proved the extragalactic origin of the cosmic X-ray background (CXB). Hundreds of point sources detected in these surveys provide us with a wealth of information about the distant Universe. However, due to the very small sky coverage of these surveys, they are practically unsuitable for the study of the local Universe (). Medium-sensitivity (– erg cm-2 s-1) X-ray surveys, such as those performed with ASCA (Ueda et al. (1999)) and BeppoSAX (Giommi et al. (2000)), cover larger areas of the sky ( sq. deg) but also cannot sample efficiently the Universe within Mpc of us. In this regard, the results of the soft X-ray ( keV) all-sky survey carried out with the ROSAT observatory (e.g. Voges et al. (1999)) are extremely important, but these cannot be directly extrapolated into the keV energy band. Therefore, our knowledge of the statistical properties of the local population of hard X-ray sources still rests largely on the snapshot of the whole sky taken in the 2–100 keV energy band more than 20 years ago by the different experiments on board the HEAO-1 observatory, A1 (Wood et al. (1984)), A2 (Piccinotti et al. (1982)) and A4 (Levine et al. (1984)). It is only now that we have the possibility to undertake a new hard X-ray (3–20 keV) all-sky survey at similar (below 10 keV) and much better (above 10 keV) sensitivity provided by the RXTE observatory.
The Rossi X-ray Timing Explorer (RXTE, Bradt et al. (1993)) was launched at the end of 1995 and has now been successfully operating for more than 7 years. The mission was primarily designed to study the variability of X-ray sources on time scales from sub-milliseconds to years (e.g. Swank et al. (1995)). The maneuvering capability of the satellite combined with the high photon throughput of its main detector (PCA) has also made it possible to carry out a series of Galactic Bulge scans aimed at the detection of new transient sources and following the long-term behavior of known X-ray sources (Markwardt et al. (2000)). In addition, over its still continuing life time, RXTE/PCA has collected a large amount of data of slew observations covering almost the entire sky. In the current work we use these data to perform an all-sky survey in the 3–20 keV energy band. The relatively narrow field of view of the PCA instrument allows us to localize sources to better than 1 deg and thus effectively avoid source confusion after we restrict our consideration to Galactic latitudes .
We note that the RXTE/PCA slew data have previously been utilized to reconstruct the average spectrum of the CXB (Revnivtsev et al. (2003)).
2 Data analysis
2.1 Data selection and reduction
One of the main instruments aboard the RXTE observatory is the Proportional Counter Array (PCA), an X-ray spectrometer. It consists of 5 nearly identical Proportional Counter Units (PCUs). Each PCU is sensitive to photons with energies 2–60 keV, reaching the maximum effective area at 7 keV. For an X-ray source with a Crab-like spectrum, most of the counts would be detected at energies below 10 keV. However, a significant effective area, 300–500 cm2 per PCU, is also available in the 10–20 keV energy band.
The slewing rate of the RXTE satellite between targets is 0.1 deg s-1. One can make use of data collected during such reorientations to build maps of the sky. We have utilized the slew parts of all RXTE observations performed from April 15, 1996–July 16, 2002. This amounts in total to approximately 50,000 observations of typical length 200–500 s. The observational period before April 15, 1996 (High Voltage Epochs 1 and 2) was excluded from the analysis because during that time the PCA had significantly different gain and dependence of the effective area on energy. Since these early observations constitute only % of all available slew/scan data, their rejection has negligible effect on the net exposure time of our survey, which is 20.2 Ms.
The data reduction was done using standard tools of the LHEASOFT/FTOOLS 5.2 package. In this version of the software the effective area of the PCA detectors is slightly ( 11–12%) underestimated, which leads to an overestimation of the fluxes of X-ray sources (see Revnivtsev et al. (2003), Jahoda et al. 2004, in preparation). We have made a correction for this factor in our analysis.
For the background modeling we used the faint source (”L7_240”) CM model (http://heasarc.gsfc.nasa.gov/docs/xte/recipes/ pcabackest.html). The background model includes by design both the CXB and instrumental background. Therefore, the background subtracted rate for ”blank sky” observations is expected to be consistent with zero within spacial fluctuations of the CXB. The rms amplitude of these fluctuations (cosmic variance) was earlier estimated for RXTE/PCA to be %, or erg s-1 cm-2, in the 2–10 keV energy band (Markwardt et al. (2002), Revnivtsev et al. (2003)).
At low galactic latitude, there is diffuse X-ray emission from the Galactic ridge and bulge. Using results of Iwan et al. (1982) and Revnivtsev (2003), we estimate that this component does not exceed ergs s-1 cm-2 at in the central part of the Galaxy and continues to decrease with distance from the Galactic center (in and ). We therefore neglect the Galactic diffuse emission in our subsequent analysis.
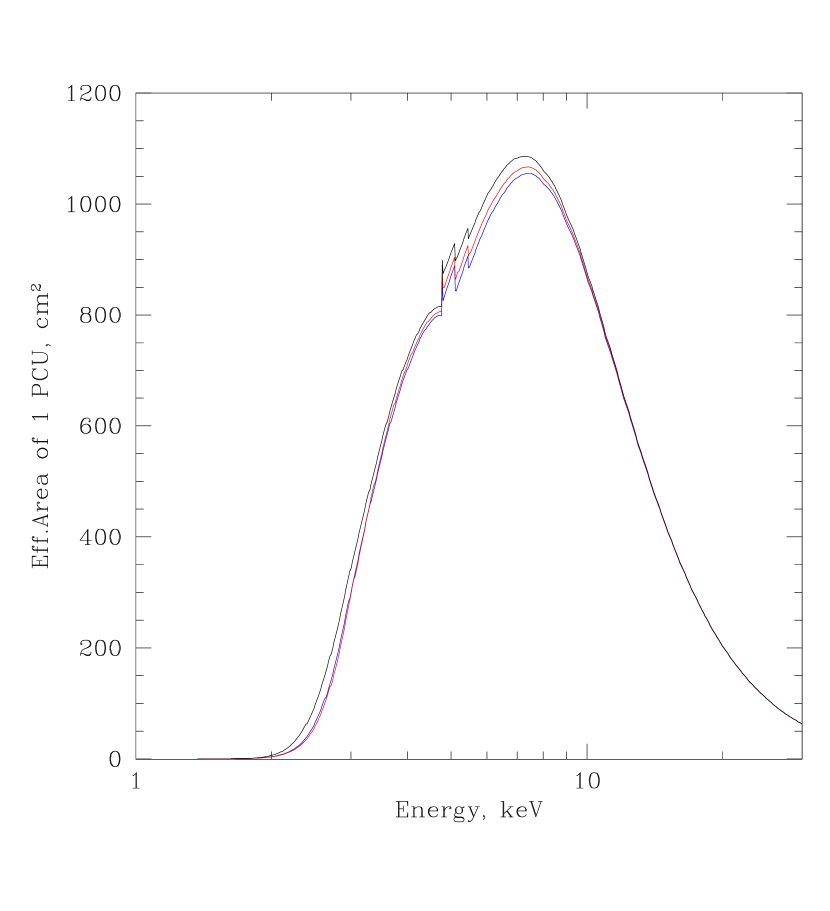
In order to reduce the effect of the uncertainties in the PCA background subtraction and increase our sensitivity to source detection, we used only the data of the first layer (LR1) for all PCUs. The effective area of a PCU (the first upper anode layer only) is shown as a function of photon energy in Fig. 1. Different curves in the figure represent different high voltage epochs of the PCA. The observed variations of the effective area prove to be mainly due to an increasing amount of xenon in the propane layer (Jahoda et al. 2004, in preparation) rather than due to the change of the high voltage.
We utilized data of Standard2 mode of the PCA, which are available for all observations. Standard2 mode provides the possibility of energy band selection and also 16 s time resolution. Energy band selection is very important, because by using a band narrower than the PCA total energy range (2–60 keV) we can significantly reduce the instrumental background and therefore strongly increase our sensitivity to faint sources. However, during a 16-s interval the center of the PCA field of view can move up to 1–1.5∘, which limits the spatial resolution of maps constructed from Standard2 data (see §2.3 for further discussion of this issue).
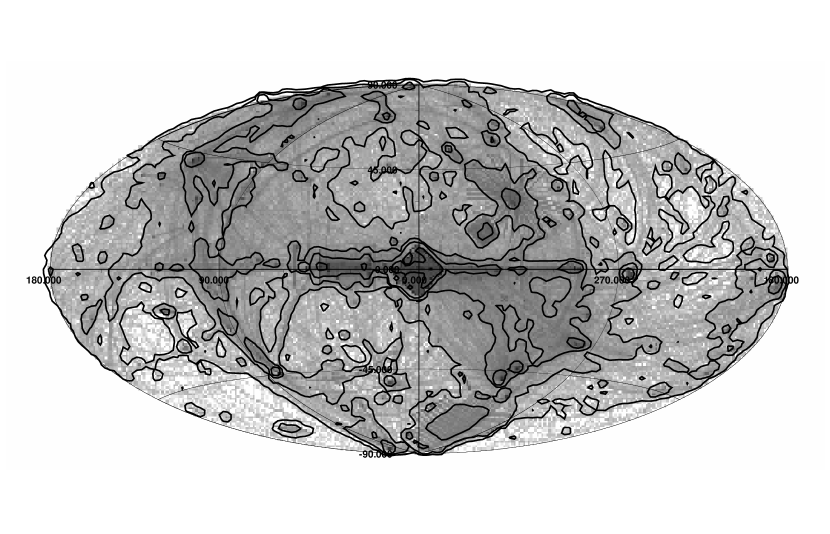
Data were filtered by the following criteria. We filtered out Earth occulted data (by applying the criterion ). Our study of the PCA background subtraction uncertainties and their dependence on the rate demonstrated that for our purposes (weak source detection) it is better to use the criterion than the standard condition . In addition, we excluded all data from PCU0 obtained later than May 12, 2000, because the loss of the upper propane veto layer of this PCU has resulted in strongly increased background subtraction uncertainties. After applying the above filters we are left with 9.3 Ms exposure time worth of good data, covering almost all of the sky. Since during some slews not all 5 PCUs were operational, the resulting exposure time recalculated per one PCU is 26.9 Ms. The corresponding exposure map is shown in Fig. 2.
2.2 Sensitivity and completeness of the survey
To avoid dealing with substantial source confusion due to high density of Galactic X-ray sources, we excluded observations performed at low Galactic latitude from the construction of a catalog of detected sources (see §3). The total accumulated exposure time per PCU corresponding to the region (with the total area of 34,090 sq. deg) is 16.6 Ms.
Fig. 3 shows the effective survey area as a function of the minimum PCU count rate allowing 4 source detection in the 3–20 keV, 3–8 keV and 8–20 keV bands, and also as a function of an energy flux threshold for 4 detection of sources with a Crab-like spectrum (power law with a photon index ). The survey is 80% (90%) complete at down to 3–20 keV, 3–8 keV and 8–20 keV count rates of 1.8 (2.5), 1.2 (1.6) and 1.3 (1.8) cnt s-1. For sources, these numbers correspond to the following limiting fluxes: 2.3 (3.3), 1.2 (1.6) and 2.5 (3.4) erg s-1 cm-2. The sensitivity of the RXTE slew survey below 10 keV is thus comparable to/slightly higher than that of the HEAO-1 A1/A2 surveys (Wood et al. (1984); Piccinotti et al. (1982)). In the 10–20 keV energy band, the current slew survey has record sensitivity for all-sky hard X-ray surveys, being an order of magnitude deeper than the HEAO-1/A4 survey (Levine et al. (1984)).

2.3 Construction of the all-sky map; detection and localization of sources
Relatively fast and irregular slews of the RXTE satellite do not allow us to detect weak sources using the procedures previously applied to the analysis of the UHURU and HEAO-1 all-sky surveys (Forman et al. (1978), Piccinotti et al. (1982), Wood et al. (1984)). For this reason, our source detection algorithm is based on analyzing averaged maps of the sky instead of using individual scans.
The accuracy of source localization depends on the source brightness and variability as well as on the RXTE slewing speed, but is always better than for a single slew across a source. The localization of a source that has been scanned across several times can be significantly improved by fitting its observed brightness profile on the sky with a model of the collimator response. The locations of extremely stable and strong sources such as the Crab nebula or brightest clusters of galaxies can thus be recovered within few arcminutes.
A sequence of several steps, as described below, was performed to build the all-sky map and to detect and localize sources in the sky. First, a map of the sky for each PCU was obtained by ascribing the measured, background subtracted count rate to the celestial position toward which the center of the PCA field of view was pointed at the middle of each 16-s bin of data. Such maps were produced in the total 3–20 keV energy band as well as in the subbands 3–8 keV and 8–20 keV. Then, exposure-weighted averaging of the maps from the individual PCUs was done to obtain raw maps of the sky in the three energy bands.
The derived all-sky maps are of very high statistical quality as demonstrated in Fig. 4, where we present the distribution of the observed signal-to-noise ( 111Here means purely statistical noise of the measurements. We do not include here the variations of the CXB brightness level, which are smaller than the statistical uncertainty of a source flux measurement for typical exposure times 100 s) ratios for the bins making up the sky map at in the 3–20 keV band. The chosen pixel size assures that neighbouring bins are practically independent, because the effective field of view of RXTE/PCA is 1 sq. deg. In the case of pure statistical noise, the distribution is expected to be a Gaussian with zero mean and unity dispersion, which is quite similar to what is actually observed for (see Fig. 4). Given this excellent agreement, we require that a source have a in the 3–20 keV band to be considered detected. With this criterion, we allow the detection of approximately one fake source over the whole sky at .
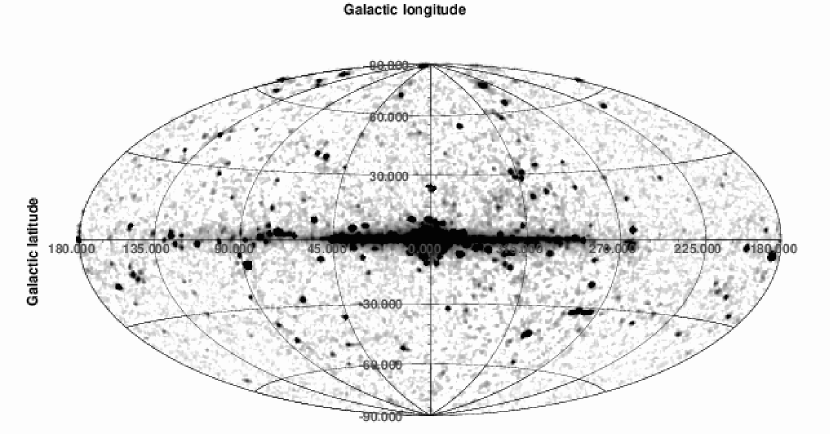
A simply binned raw map of the sky does not provide us with the best signal to noise ratio for the search of point sources. In order to maximally use the available statistics we convolved the raw all-sky maps with the response of the RXTE/PCA collimator (Jahoda et al. (1996)). The resulting 3–20 keV all-sky map is shown in Fig. 5. This map was used to detect sources by searching for peaks characterized by a ratio of more than 4. The positions and fluxes of so found sources were subsequently determined from a fit of the PCA collimator model to the raw all-sky map. In our catalog of detected sources (see §3), their best-fit positions are given with a 1 statistical uncertainty.
However, the above procedure is not optimal for detection and localization of sources covered by only a few RXTE slews and for strongly variable sources. We therefore also searched the 1∘-binned raw all-sky map for pixels that have . This has allowed us to detect several addional sources, missed in the previous step (convolved sky analysis). For these sources, a conservative estimate of the total localization uncertainty is provided in the catalog (see §3). In all cases, the error is less than or equal to .

2.4 Flux measurement and source confusion
Measurement of source fluxes in our survey is subject to some systematic uncertainties. Some uncertainty may arise from insufficiently accurate determination of source positions. The further the inferred position is from the actual one, the smaller flux can be ascribed to the source because of the response of the collimator falling off with increasing offset from the optical axis. This should not however result in a biased estimate of the flux of a source that has been covered by numerous slews, because in that case both the source position and its flux are determined simultaneously from a fit of the model collimator response to the source image. However, the effect may be important for poorly covered sources and also for variable and transient sources. As most of the sky in our survey is covered by more than 5 slews, the effect is expected to be generally small.
We could estimate the accuracy of the flux determination if we had a sample of persistent sources with known X-ray fluxes. Fortunately, there are 64 clusters of galaxies detected in our survey (see §3) for most of which we can compare their measured RXTE/PCA 3–8 keV count rates with the corresponding values evaluated from the fluxes and gas temperatures derived with ROSAT and ASCA observatories (Markevitch (1998), Ebeling et al. (2000), Ikebe et al. (2002)). The fact that clusters of galaxies are not point sources does not strongy affect our flux estimates because of the low () angular resolution of our measurements. The strongest deviations from the true source flux, on the order of 20-30%, may arise in the case of largest clusters of galaxies such as the Coma.
It can be seen from Fig. 6 that the agreement between the two sets of count rates is very good and there seems to be no significant bias in our flux determination even for angular offsets as large as . Since for the absolute majority of sources in our catalog that can be confidently associated with a known astrophysical object the RXTE location is within of the true position, we will not attempt to correct any of the measured fluxes for the possible bias described above. We note however that the fluxes of the (weak and poorly localized) unidentified sources in our catalog may be systematically underestimated.


Because of the fairly large field of view of the PCA ( sq. deg), source confusion presents some problem for our survey. Confusion may manifest itself through the appearance of two or more sufficiently bright sources within our beam and lead to ambiguous source identification and uncertainty in source flux determination. Using cumulative source counts interpolated from HEAO-1/A2, ASCA and BeppoSAX measurements, or the consistent estimate from the current survey (see §4.2), and taking into account the sky coverage and sensitivity of our survey (Fig. 3), we may estimate that there can be of the order of 10 unresolvable pairs and larger groups of sources, detectable as single sources with , on the sky at , assuming a uniform distribution of sources. We do find a comparable number of confusion cases (groups of known X-ray sources) in our catalog (see §3).
The uncertainty of the flux determination can be expressed in terms of confusion variance . In the case of a power-law form of cumulative source counts (the number of sources with a flux greater than per unit solid angle), , the confusion noise is given by
where is the effective solid angle of the instrument beam (e.g. Hacking & Houck (1987)). For the standard value and the observed density of sources, we find that confusion sets in at count rates below cnt s-1 in the 3–20 keV band, or equivalently (assuming a Crab-like spectrum) at fluxes below erg s cm-2.
Summarizing the above discussion, we can conclude that our estimates of source fluxes may be affected by confusion in the count rate range below 0.5 cnt s-1, or for fluxes below erg s cm-2 (over 3–20 keV), and therefore of sources entering the catalog at these levels should be treated with caution.
3 The catalog
A total of 294 sources detected (with higher than significance) in the 3–20 keV energy band at Galactic latitudes comprise the RXTE slew survey catalog, which is presented in Table 2. The columns of the catalog are described below.
Column (1) – source entry name in the catalog. “XSS” stands for “XTE Slew Survey”. The name provides the source equatorial coordinates (2000).
Columns (2,3) – source Galactic coordinates.
Column (4) – localization region radius. In cases where the standard procedure of fitting the collimator response to the source brightness profile is unreliable, a conservative estimate of the total localization uncertainty is given. Otherwise, the quoted value represents 1 statistical uncertainty.
Columns (5,6) – count rate and 1 statistical uncertainty (in cnt s-1 per PCU) for the 3–8 keV energy band.
Columns (7,8) – count rate and 1 statistical uncertainty (in cnt s-1 per PCU) for the 8–20 keV energy band.
Column (9,10) – effective slope (photon index) of the source spectrum and 1 uncertainty. This estimate is based on the ratio of the 8–20 keV and 3–8 keV count rates. A lower (upper) limit is given in cases where the upper (lower) band flux measurement has a signal-to-noise ratio of less than 2.
Column (11) – common name of astrophysical object with which the XSS source is identified. There may be several entries per XSS source. The identification procedure is described in §3.1.
Columns (12) – general astrophysical type of the associated object. L – local (source in the Milky Way, LMC or SMC), A – active galactic nucleus, C – cluster of galaxies, G – non-active galaxy, O – other – afterglow of a gamma-ray burst.
Columns (13) – more detailed classification of object. For AGN (A): Q – quasar, RQQ – radio-quite quasar, RLQ – radio-loud quasar, BL – blasar (BL Lac object or flat-spectrum radio quasar), S1 – Seyfert 1 galaxy (types 1, 1.2 and 1.5), NLS1 – narrow-line Seyfert 1 galaxy, S2 – Seyfert 2 galaxy (types 1.8, 1.9 and 2), RG – radio galaxy, BLRG – broad-line radio galaxy, NLRG – narrow-line radio galaxy, LLAGN – low luminosity AGN. AGN classification is mostly adopted from NED, otherwise references are provided. For “local” sources (L): XB – X-ray binary, P – polar, IP – intermediate polar, DN – dwarf nova of SU, UG or ZC type, NL – nova-like of VY type, S – hot star, RS CVn – RS CVn variable star, SS – symbiotic star.
Columns (14) – redshift (if known) for extragalactic sources.
Columns (15) – additional notes or references.
Table 1 provides a set of conversion coefficients allowing one to estimate the flux of a cataloged source in the 3–8 keV, 8–20 keV and 3–20 keV bands in units of erg s-1 cm-2 from the count rates given in the catalog for a number of values of the effective spectral slope.
| -1 | -0.5 | 0 | 1 | 2 | 3 | |
|---|---|---|---|---|---|---|
| 3–8 keV | 0.67 | 0.88 | 1.00 | 1.04 | 1.03 | 1.02 |
| 8–20 keV | 2.71 | 2.89 | 2.87 | 2.45 | 1.92 | 1.51 |
| 3–20 keV | 2.29 | 2.39 | 2.27 | 1.75 | 1.33 | 1.12 |
3.1 Identification of sources
We have searched for likely counterparts to the hard X-ray sources detected in our survey primarily making use of large astronomical databases including NED, SIMBAD and VizieR. The identification process was greatly faciliated thanks to the availability of the ROSAT all-sky survey bright source catalog (RBSC, Voges et al. (1999)) of soft X-ray (0.1–2.4 keV) sources. The ROSAT survey is typically an order of magnitude more sensitive than our RXTE slew survey for sources with Crab-like spectra (). Therefore, in most cases we could unambiguously associate the XSS source with a single bright (typically cnt s-1) and hard (typically ) RBSC source located within the RXTE error box. Furthemore, for most of such highly probable associations the astrophysical type is known and other related information (such as redshift) is available, and that is included in the catalog. In addition, the ASCA Medium Sensitivity Survey (the GIS catalog, Ueda et al. (2001)) played a crucial role in deciding about the identification of a number of sources.
In those cases where we strongly believe that the XSS source is associated with a particular RBSC source but its nature remains unknown, we just quote the ROSAT name in the identification column. In addition, among the sources of unknown nature in our catalog there are 6 whose localizations are consistent with a HEAO-1/A1 source (Wood et al. (1984)). Such associations are also indicated in the catalog.
Very hard sources in our catalog such as Seyfert 2 galaxies may have no obvious counterpart in the RBSC catalog, and even in the ROSAT all-sky survey faint source catalog, due to a low-energy photoabsorption cutoff in their X-ray spectrum. We thus carefully browsed published samples of AGN, in particular Seyfert 2s, observed by focusing X-ray telescopes operating in the standard 2–10 keV band (TARTARUS/ASCA database, Bassani et al. (1999)), searching for possible associations with our sources.
In addition, we have identified 14 XSS sources (including 3 confused cases) located in the so-called Zone of Avoidance at with clusters of galaxies recently discovered in the CIZA survey (Ebeling et al. (2002), Ebeling et al. (2004)).
For completeness, we included in the catalog four sources associated with gamma-ray burst afterglows. These detections have become possible only due to the RXTE observatory targeting these afterglows and therefore represent an extremely biased statistics of the occurence of GRB X-ray afterglows on the sky. The effect of cataloged sources being RXTE targets on the statistics of the catalog is discussed below.
3.2 Effect of RXTE pointing at cataloged sources
149 out of the 294 detected sources in our catalog were at least once the target of RXTE/PCA pointed observations. Although we have not used the data of the pointed observations themselves, the slew parts of these observations were included in our analysis. One may therefore reasonably suspect that some sources have entered the catalog only because they had been chosen for observations with RXTE.
In order to check this hypothesis we have re-evaluated the significance of detection of all cataloged sources by excluding the data of the slews associated with pointing at the sources. It turns out that apart from the GRB afterglows only the sources Mrk 335, Mrk 348, Ton S180 and NGC 1068 (all are AGN) would not have qualified for a catalog entry if they had not been pointed at by RXTE. Since this affects only % of the catalog, we conclude that the effect of targeting on the statistical quality of the catalog is negligible.
4 Analysis of the catalog
Out of the 294 detected sources, 236 (80%) have been associated with a single known astrophysical object, another 22 probably result from superposition of 2 or 3 closely located known sources. 35 detected sources remain unidentified, although for 12 of these there is a probable soft X-ray counterpart from the RBSC. Of the reliably identified single sources, 63 have local origin (among them are 19 X-ray binaries, 7 polars and 12 intermediate polars), 64 are clusters of galaxies and 100 are AGN.
4.1 Unidentified sources
The astrophysical origin of 35 sources in our catalog remains unknown. For 5 of these detections, the measured 3-20 keV count rate falls below our adopted confusion limit of 0.5 cnt s-1 (see §2.4), so some of them may in fact result from superposition of weaker sources. 29 unidentified sources are newly discovered hard X-ray sources, while the remaining 6 positionally coincide with previously known HEAO-1 sources (Wood et al. (1984)). It should be relatively straighforward to identify in other bands of the electromagnetic spectrum the 12 XSS sources that have a likely RBSC counterpart, because the positions of these sources are known to within 1 arcmin. However, the identification of the other sources can be more problematic. We note that the current localization error () can be significantly reduced by performing slowly scanning RXTE observations of the sources.
We could get some idea as to the nature of the unidentified sources by comparing their effective spectral slopes with those of the XSS sources of known type. This is done in Fig. 8, where we show the distribution of values of the effective photon index for XSS sources divided into several major classes, including AGN, clusters of galaxies, magnetic cataclysmic variables (CVs, including polars and intermediate polars) and unidentified sources. In plotting these diagrams, each source was ascribed a distribution of hardness ratios (8–20 keV/3–8 keV) in accordance with the measured count rate uncertainties.

The resulting distribution of values is apparently broad for the sample of unidentified sources, although substantial part of this scatter results from the statistical uncertainty in measuring the count rates. However, the bulk of the unidentified sources are evidently harder than typical clusters of galaxies, being similar in hardness () to AGN and magnetic CVs.
It is interesting that 31 of 35 unidentified sources are located in the southern hemisphere (at ), which probably reflects the fact that the southern sky is relatively less studied in the optical and other bands. We can use this fact to show that magnetic CVs are unlikely to constitute the majority of our unidentified sources. Indeed, 8 and 11 of the magnetic CVs in our catalog are located at and , respectively. Since these objects are located in space within pc from us, their distribution in the sky is expected to be random to a first approximation. This statement relies on the fact that for a given source luminosity our survey samples similar volumes in the northern and southern hemispheres (in 1 to 1.1 proportion). For comparison, the catalog of CVs by Ritter et al. 2003, which contains 107 polars and intermediate polars and among them all of our 19 magnetic CVs, does not demonstrate any significant north/south asymmetry either: 49 and 58 sources are located at at and , respectively. If many of our unidentified sources were magnetic CVs, the distribution of all detected sources of this type would become significantly asymmetric with respect to the equatorial plane, which would be very difficult to explain.
Our catalog also includes 44 local sources of types other than magnetic CVs. However, we do not expect that more than a few objects of these types may be present among our unidentified sources. Indeed, X-ray binaries are very rare and bright X-ray sources, while the other sources (such as hot stars) are also rare and usually have soft spectra (), as evidenced by our catalog.
We conclude that most of the unidentified sources are likely AGN, including those absorbed at soft X-rays (such as Seyfert 2 galaxies). The AGN content of the RXTE/PCA all-sky slew survey will be discussed in detail in a separate paper.
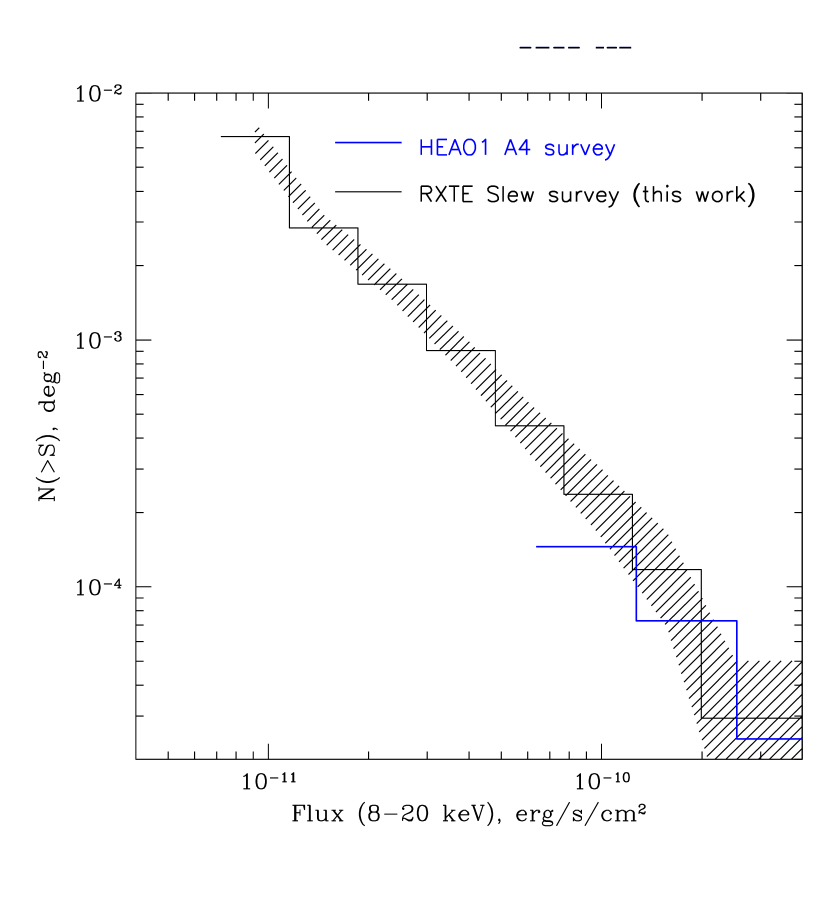
4.2 Number-flux functions
The high completeness (%) of the identification of detected sources allows us to estimate number-flux functions for extragalactic sources. Furthemore, thanks to the record sensitivity achieved by the current survey at 8–20 keV, we obtain a unique opportunity to construct a distribution in this hard X-ray band.
Fig. 9 shows the cumulative flux distributions of the detected extragalactic sources in the 2–10 keV and 8–20 keV energy bands, estimated as follows. We selected from the general catalog (Table 2) two samples of sources 1) those having in the 3–8 keV band and 2) those meeting the same condition in the 8–20 keV band. Excluding sources of confirmed local origin, we are left with 209 and 92 sources for the soft and hard bands, respectively. These samples include unidentified sources (27 and 7, respectively), although the results remain essentially unchanged if we exclude these cases from consideration (8 unidentified sources have in the soft energy band and 28 sources – in the hard energy band). As was explained in §2.3, although the general catalog comprises sources originally detected in the broad 3–20 keV band, the source samples subsequently selected from it in the 3–8 keV and 8–20 keV subbands are expected to be highly complete.
The curves were calculated using the known sky coverage as a function of the survey sensitivity in the 3–8 keV and 8–20 keV bands (Fig. 3) The obtained distributions were converted from count rates to flux units assuming a power-law spectrum of . In addition, to faciliate comparison of our results with those of previous experiments we have made a change from the 3–8 keV band used in the catalog to the standard 2–10 keV band. Finally, we truncated the distributions at the lowest fluxes according to the confusion limit formulated in §2.4, namely at erg s cm-2 and erg s cm-2 in the 2–10 keV and 8–20 keV, respectively. These values result from the fits to the number-flux functions at higher fluxes, presented below. As a result, the final flux distributions for the soft and hard bands presented in Fig. 9 are based on 197 and 90 sources, respectively.
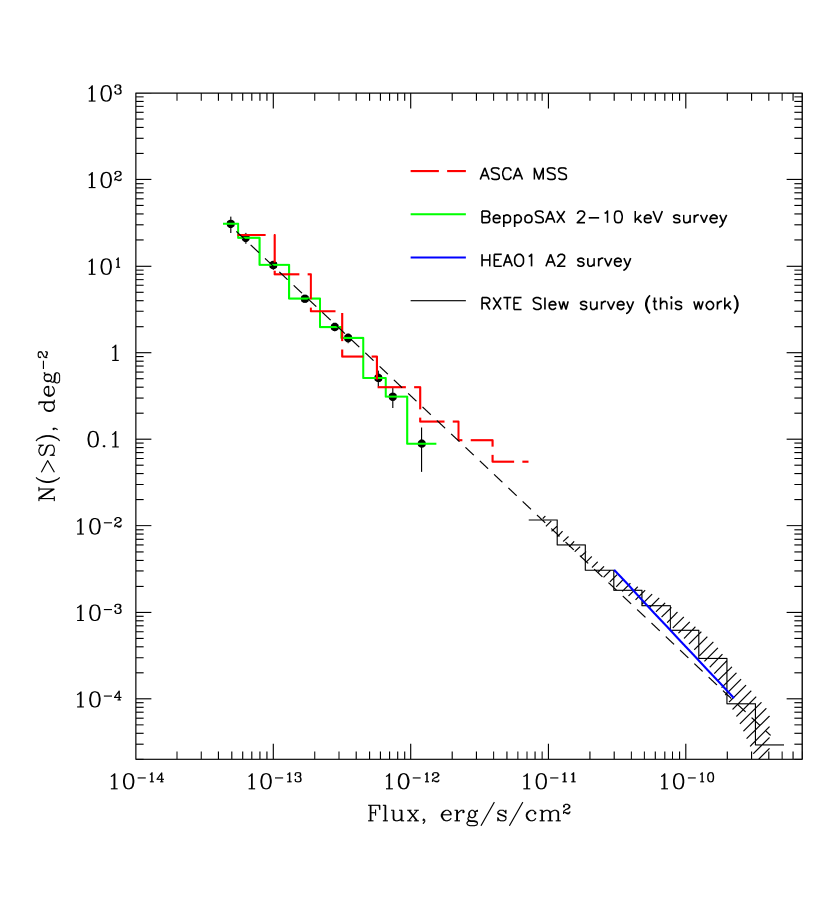
Assuming the usual power-law form for the number-flux function
we can estimate the parameters of this function using the maximum likelihood method (e.g Crawford, Jauncey & Murdoch (1970)). We obtain the following best fits to the observed distributions in the flux ranges erg s cm-2 (3–8 keV) and erg s cm-2 (8–20 keV):
and
where is the source flux in units of erg s-1 cm-2, the uncertainties here and later being .
If we fix the slope of the number-flux function at the value , we obtain normalization constants and deg-2 for the soft and hard energy bands, respectively.
It is interesting to compare the above normalization of the 2–10 keV cumulative source counts with the values inferred from previous sky surveys, carried out with Ariel 5 (Warwick & Pye (1978)), UHURU (Forman et al. (1978)), HEAO-1/A2 (Piccinotti et al. (1982)) and BeppoSAX (Giommi et al. (2000)). Adopting conversion factors of 1 cnt s-1 (Ariel 5) = erg s-1 cm-2, 1 cnt s-1 (UHURU) = erg s-1 cm-2 and 1 cnt s-1 (HEAO-1/A2) = erg s-1 cm-2 for the 2–10 keV energy band, we find the following coefficients (in the units given above) of the cumulative distribution function: , , , .
It can be seen that the Ariel 5, UHURU and HEAO-1 normalizations are slightly higher than ours. This difference probably results from the fact that our estimate of the density of extragalactic sources is largely based on low flux ( erg s-1 cm-2) sources that were inaccessible to those experiments. Our result is therefore less affected by the substantially inhomogeneous distribution of X-ray sources in the local extragalactic cell ( Mpc in size), because we efficiently sample the local Universe outside this volume as well. We note that the source counts measured with RXTE at flux levels above a few erg s-1 cm-2, where the contribution of the local density inhomogeneity becomes important, lie above our power-law fit and are in fact consistent with the results of the early all-sky surveys mentioned above. On the other hand, the extrapolation of our curve to fluxes below the limit of the current survey of erg s-1 cm-2 (2–10 keV) is in excellent agreement with the flux distributions derived from the BeppoSAX and ASCA medium-sensitivity surveys (see Fig. 9).
4.3 Summary
We presented the serendipitous hard X-ray (3–20 keV) survey of the sky at high Galactic latitude based on RXTE/PCA slew observations in 1996–2002. At photon energies above 10 keV, the current survey surpasses by an order of magnitude in depth the previously best HEAO-1/A4 survey, achieving similar sensitivity ( erg s-1 cm-2) to the HEAO-1/A1 experiment in the standard X-ray band (2–10 keV) for the most of the sky. At the same time, % of the sky is now covered at flux levels below erg s-1 cm-2 (2–10 keV), which has allowed us to draw the diagram for extragalactic X-ray sources down to erg s-1 cm-2 and thus to fill the previously existing gap toward the cumulative source counts measured at lower fluxes by medium sensitivity surveys. Moreover, we have for the first time estimated the distribution of source fluxes at 8–20 keV in the – erg s-1 cm-2 range.
The compiled catalog comprises 294 detected sources and provides for each of them the estimated flux and effective spectral slope in the 3–20 keV range. The identification of the sources is already highly complete (88%), so the catalog can be efficiently used for statistical studies of different classes of sources. However, particularly interesting scientific content might still be hidden in the sample of 35 unidentified sources. A large fraction of these are probably AGN, including a number of highly obscured ones which are very difficult to discover in the optical or soft X-ray bands. To establish their origin, a dedicated identification program needs to be carried out. Scanning RXTE observations could improve the localizations of those unidentified sources for which we failed to find a counterpart in the ROSAT all-sky survey.
The statistical properties of the AGN detected in the RXTE all-sky slew survey will be discussed in a separate paper (Sazonov et al., in preparation).
Acknowledgements.
We thank Harald Ebeling and Christopher Mullis for providing us the information about a set of CIZA clusters before publication. This research has made use of data obtained through the High Energy Astrophysics Science Archive Research Center Online Service, provided by the NASA/Goddard Space Flight Center.References
- Alcala et al. (1995) Alcala, J.M., Krautter, J., Schmitt, J.H.M.M. et al. 1995, A&AS, 114, 109
- Bassani et al. (1999) Bassani, L. et al. 1999, ApJS, 121, 473
- Bradt et al. (1993) Bradt, H.V., Rotshild R.E., & Swank J.H. 1993, A&AS, 97, 355
- Brandt et al. (2001) Brandt, W.N. et al., 2001, AJ, 122, 2810
- Brinkmann et al. (1997) Brinkmann, W., Siebert, J., Feigelson, E.D., et al. 1997, A&A, 323, 739
- Crawford, Jauncey & Murdoch (1970) Crawford, D.F., Jauncey, D.L., & Murdoch, H.S. 1970, ApJ, 162, 405
- della Ceca et al. (1990) della Ceca, R., Palumbo, G.G.C., Persic, M. et al. 1990, ApJS, 72, 471
- Ebeling et al. (2000) Ebeling, H., Edge, A.C., Allen, S.W., Crawford, C.S., Fabian, A.C., & Huchra, J.P. 2000, MNRAS, 318, 333
- Ebeling et al. (2002) Ebeling, H., Mullis, C.R., & Tully, R.B. 2002, ApJ, 580, 774
- Ebeling et al. (2004) Ebeling, H. et al., 2004, in preparation
- Fischer et al. (1998) Fischer, J.-U., Hasinger, G., Schwope, A.D. et al. 1998, Astron. Nachr., 319, 347
- Forman et al. (1978) Forman, W., Jones, C., Cominsky, L. et al., 1978, ApJS, 38, 357
- Giommi et al. (2000) Giommi, P., Perri, M., & Fiore, F., 2000, A&A, 362, 799
- Hacking & Houck (1987) Hacking, P., & Houck, J.R., 1987, ApJS, 63, 311
- Hasinger et al. (2001) Hasinger, G. et al., 2001, A&A, 365, L45
- Ikebe et al. (2002) Ikebe, Y., Reiprich, T. H., Böhringer, H., Tanaka Y., & Kitayama, T., 2002, A&A, 383, 773
- Imanishi, Koyama & Tsuboi (2001) Imanishi, K., Koyama, K., & Tsuboi, Y. 2001, ApJ, 557, 747
- Iwan et al. (1982) Iwan D., Marshall F., Boldt E. et al. 1982, ApJ, 260, 111
- Jahoda et al. (1996) Jahoda, K., Swank, J.H., Giles, A.B., Stark, M.J., Strohmayer, T., Zhang, W., & Morgan, E.H., 1996, Proc SPIE, 2808, 59
- Lara et al. (1999) Lara, L., Márquez, I., Cotton, W.D. et al., 1999, NewAR, 43, 643
- Laurent-Muehleisen et al. (1997) Laurent-Muehleisen, S.A., Kollgaard, R.I., Ryan, P.J., et al. 1997, A&AS, 122, 235
- Levine et al. (1984) Levine, A.M., Lang, F.L., Lewin, W.H.G. et al. 1984, ApJS, 54, 581
- Markevitch (1998) Markevitch, M., 1998, ApJ, 504, 27
- Markwardt et al. (2000) Markwardt, C., Swank, J., Marshall, F., & in’t Zand, J., 2000, in ROSSI 2000: Astrophysics with the Rossi X-ray Timing Explorer. March 22-24, 2000 at NASA’s GSFC, Greenbelt, MD USA, p. E7
- Markwardt et al. (2002) Markwardt, C., Jahoda, K. & Smith, D.A., 2002, http://lheawww.gsfc.nasa.gov/users/craigm/pca-bkg/bkg-users.html
- Pellegrini et al. (2000) Pellegrini, S., Cappi, M., Bassani, L., della Ceca, R., & Palumbo, G.G.C. 2000, A&A, 360, 878
- Piccinotti et al. (1982) Piccinotti, G., Mushotzky, R.F., Boldt, E.A. et al., 1982, ApJ, 253, 485
- Revnivtsev (2003) Revnivtsev M. 2003, A&A, 410, 865
- Revnivtsev et al. (2003) Revnivtsev, M., Gilfanov, M., Sunyaev, R., Jahoda, K., & Markwardt, C., 2003, A&A, 411, 329
- Schmid, Appenzeller & Burch (2003) Schmid, H.M., Appenzeller, I., & Burch, U., 2003, A&A, 404, 505
- Simpson et al. (1996) Simpson, C., Ward, M., Clements, D.L., & Rawlings, S. 1996, MNRAS, 281, 509
- Swank et al. (1995) Swank, J. et al., 1995, The Lives of Neutron Stars, eds. Alpar, A., Kiziloglu, U., & van Paradijs, J. NATO ASI Series
- Ueda et al. (1999) Ueda, Y., Takahashi, T., Ishisaki, Y., Ohashi, T., & Makishima, K. 1999, ApJ, 524, L11
- Ueda et al. (2001) Ueda, Y., Ishisaki, Y., Takahashi, T., Makishima, K., & Ohashi, T. 2001, ApJS, 133, 1
- Véron-Cetty et al. (2001) Véron-Cetty, M.-P., Véron, P., & Gonçalves, A.C. 2001, A&A, 372, 730
- Véron-Cetty & Véron (2003) Véron-Cetty, M.-P., & Véron, P. 2003, A&A, 412, 399
- Voges et al. (1999) Voges, W., Aschenbach, B., Boller, Th. et al., 1999, A&A, 349, 389
- Warwick & Pye (1978) Warwick, R.S., & Pye, J.P., 1978, MNRAS, 183, 169
- Wood et al. (1984) Wood, K.S., Meekins, J.F., Yentis, D.J. et al. 1984, ApJS, 56, 507
![[Uncaptioned image]](/html/astro-ph/0402414/assets/x12.png)
![[Uncaptioned image]](/html/astro-ph/0402414/assets/x13.png)
![[Uncaptioned image]](/html/astro-ph/0402414/assets/x14.png)
![[Uncaptioned image]](/html/astro-ph/0402414/assets/x15.png)
![[Uncaptioned image]](/html/astro-ph/0402414/assets/x16.png)
![[Uncaptioned image]](/html/astro-ph/0402414/assets/x17.png)
![[Uncaptioned image]](/html/astro-ph/0402414/assets/x18.png)
![[Uncaptioned image]](/html/astro-ph/0402414/assets/x19.png)