Monte Carlo Photoionization Simulations of Diffuse Ionized Gas
Abstract
We demonstrate that the observed increase of some nebular line ratios with height above the midplane in the diffuse ionized gas (DIG) in the Milky Way and other galaxies is a natural consequence of the progressive hardening of the radiation field far from the midplane ionizing sources. To obtain increasing temperatures and line ratios away from the midplane, our photoionization simulations of a multi-component interstellar medium do not require as much additional heating (over and above that from photoionization) as previous studies that employed one dimensional, spherically averaged models.
Radiation leaking into the DIG from density bounded H ii regions is generally harder in the H-ionizing continuum and has its He-ionizing photons suppressed compared to the ionizing source of the H ii region. In line with other recent investigations, we find that such leaky H ii region models can provide elevated temperatures and line ratios, and a lower He+ fraction in the DIG. For a composite model representing the relative spectral types of O stars in the solar neighbourhood, we find that additional heating less than ergs/s/cm3 can reproduce the observed elevated line ratios in the DIG. This additional heating is considerably less than previous estimates due to the natural hardening of the radiation field reaching large heights in our simulations.
keywords:
radiative transfer — ISM — H II regions1 Introduction
The presence of extended layers of diffuse ionized gas (DIG) in the Milky Way and other galaxies is inferred from faint emission in H and other nebular lines (e.g., Reynolds 1995; Rand 1998; Hoopes, Walterbos, & Greenawalt 1996; Domgoergen & Dettmar 1997; Otte & Dettmar 1999; Hoopes & Walterbos 2003; Wang, Heckman, & Lehnert 1998; Otte et al. 2001, 2002). The ionization source for the DIG is believed to be O and B stars close to the midplane of galaxies. Photoionization models using OB stars can reproduce the gross features of the DIG ionization structure (e.g., Miller & Cox 1993; Dove & Shull 1994). If extra heating is included, in addition to that from photoionization by O stars, 1D models can reproduce the DIG spectrum (Mathis 1986; Domgoergen & Mathis 1994; Mathis 2000; Sembach et al. 2000). The main problem with O stars as the ionization source of the DIG is that for a smooth density distribution the mean free path of Lyman continuum photons is very small, pc for . Thus, it is difficult for photons to traverse the large distances to ionize the extraplanar gas which has a scaleheight of around 1 kpc in the Milky Way (Haffner, Reynolds, & Tufte 1999). However, three dimensional photoionization models show that a two component (Wood & Loeb 2000) or fractal ISM (Ciardi, Bianchi, & Ferrara 2002) can provide low density paths allowing Lyman continuum photons to reach large heights above their midplane sources.
Measurements of emission lines in addition to H provide probes of the abundances, temperatures, and densities in the DIG. Some of the most studied lines in the Milky Way and other galaxies are [N II] , [S II] , [O III] , [O II] doublet, and [O I] . Observations of the He I line provide information on the spectrum of the ionizing sources (Reynolds & Tufte 1995). Hereafter the above lines will simply be referred to as [N II], [S II], [O III], [O II], [O I], and He I. Some differences in the observed line ratios in the DIG compared to traditional H ii regions are: [S II]/H and [N II]/H ratios increase with height above the plane; [S II]/[N II] is quite uniform with height (Haffner et al. 1999) and with latitude (Rand 1997); He is observed to be underionized with respect to H (Reynolds & Tufte 1995; Heiles et al. 1996).
Most models for the DIG employ smooth, one dimensional density distributions, and predict volume averages of the line strengths and ratios (e.g., Mathis 1986; Domgoergen & Mathis 1994; Collins & Rand 2001; Sembach et al. 2000; Mathis 2000). These models generally fail to reproduce the observed line ratios that increase with above the midplane. Haffner et al. (1999) and Reynolds, Haffner, & Tufte (1999) showed that the observed [S II]/H and [N II]/H line ratios may be explained if the gas temperature increases with height above the midplane. Including additional heating over and above that of pure photoionization can reconcile the one dimensional models with observations (Reynolds et al. 1999; Mathis 2000). Additional heating may plausibly arise from photoelectric heating from dust (Reynolds & Cox 1992), dissipation of turbulence (Slavin et al. 1993; Minter & Spangler 1997), and shocks (Raymond 1992). However, it is well known that in photoionized H ii regions the radiation field hardens towards the edge of the Strömgren sphere resulting in the highest temperatures occurring at the largest distances from the ionizing source. This arises because low energy photons have relatively short mean free paths and are absorbed close to the source. Higher energy photons have longer mean free paths, travel farther, and deposit more energy per photon at large distances from the source, giving rise to the increasing temperature away from the source (Osterbrock 1989).
Such a scenario as described above is almost certainly occurring in the DIG, with the ionizing spectra penetrating to large above the plane being significantly harder than the source spectra, naturally producing a temperature profile that increases with . Models presented by Bland-Hawthorn, Freeman, & Quinn (1997), Wang et al. (1998), and Rand (1998) take this radiation transfer effect into account by introducing a hardening of the radiation field with . In these plane parallel models, the hardening of the radiation field leads to increasing temperatures at large distances from the illuminated face and corresponding increases in [S II]/H and [N II]/H. Mathis (2000) also mentions this effect, stating that line ratios for lines of sight that pierce the outer edges of spherical models may reproduce the observations.
Radiation leaking into the ISM from traditional H ii regions may also be hardened compared to the source spectrum. Hoppes & Walterbos (2003) investigated photoionization by photons from leaky H ii regions finding that the hardened spectrum leads to elevated temperatures and increased line ratios when compared to models that do not envoke hardening of the source spectrum. In addition, leaky H ii region models lead to a suppression of He-ionizing photons ( eV) and a corresponding decrease in ionization stages such as He+ and N2+.
In this paper we present Monte Carlo photoionization models for a multi-component ISM. In what follows we describe the photoionization code, adopted ISM density structure, and spectra for the ionizing sources. Due to the very large parameter space, we restrict this paper to two dimensional models of a single source ionizing a multi component, stratified ISM. Note that although our models are for 2D systems, our simulations are run on 3D density grid. A future paper will present models for 3D geometries and illuminations, investigating the role of diffuse ionizing radiation, 3D ionization and temperature structures, and the resulting intensity maps. Some specific issues we address in this paper are: increased temperatures with increasing above the midplane; problems arising with fitting [S II] emission due to undetermined dielectronic recombination rates; predictions of excess [O I] emission compared with observations; the ionization of He within the DIG.
2 Models
Our simulations use a 3D Monte Carlo photoionization code, with inputs being the ISM density structure, and the locations and ionizing spectra of point sources within the simulation grid. These ingredients are briefly discussed below.
2.1 Photoionization Models
The photoionization simulations are performed using the 3D Monte Carlo code of Wood, Mathis, & Ercolano (2004). The code simulates photoionization due to multiple point or extended sources and discretizes the density onto a 3D linear Cartesian grid. For all simulations in this paper the grid comprises cells. The code performs well compared to traditional 1D codes and other independently developed Monte Carlo codes (Ercolano et al. 2003; Och, Lucy, & Rosa 1998). We do not consider the effects of shocks or ionization fronts. In our simulations there is no C0 or S0 because we assume C and S are fully ionized by the ambient interstellar radiation field. There are no ionizing photons with energies above 54.4 eV, so there is no , consistent with observations of almost all H ii regions. For further details of the code and comparisons with other codes see Wood et al. (2004).
For most simulations, we adopt the following abundances by number relative to H: , ppm, ppm, ppm, ppm, and ppm. With the exception of S/H, these abundances were used by Mathis (2000) in his photoionization models of the local DIG. We found that the solar S/H (Anders & Grevesse 1989) provides a good match to the observations. The lower value, S/H = 13 ppm, used by Mathis (2000) was probably due to different dielectronic recombination rates in his photoionization code (see discussion in § 3.5.4). We also investigate the effects of different abundances and perform some simulations using abundances appropriate for the Perseus arm (Mathis 2000). We do not consider cooling from collisionally excited lines from elements other than those listed here, so our temperatures may be slightly hotter than 1D models that include more elements (e.g., Sembach et al. 2000).
Currently dielectronic recombination rates have not been calculated for third and fourth row elements, so photoionization modeling of sulfur lines are subject to uncertainties due to unknown atomic data (see Ali et al. 1991). We use the total recombination rates for S+ and S2+ from Nahar (2000). For S3+ we use the radiative recombination rates from Verner & Ferland (1996) and the average dielectronic rate of from Ali et al. (1991). We discuss the issues related to modeling [S II] lines in § 3.5.4.
2.2 ISM Density Structure
The ISM is observed to comprise several components of (warm and cold) neutral and (warm and hot) ionized gas. Unlike many recent photoionization models of the DIG, Monte Carlo techniques are not restricted to 1D averaged models. For our smooth density models, we use the two component density from Miller & Cox (1993)
| (1) |
where the number densities are per cm3 and the distances are in kpc. This represents the concentrated neutral layer and the extended ionized layer. In their model for the DIG, Miller & Cox used the above smooth density and included an approximation for absorption by dense clouds using a model that reproduces the statistics of clouds in the ISM. Although this smooth density is lower than the average density inferred for H0 and H+, when implemented in their “standard cloud” model using the known ionizing sources in the solar neighbourhood, it reproduces the average emission and dispersion measures observed in the Milky Way.
An obvious criticism of the Miller & Cox model is that the density they used is smaller than that inferred for the H I in the Galaxy (e.g., Dickey & Lockman 1990). However, they did use the known distribution and ionizing luminosity of O stars in the Solar neighbourhood, and found that the above density allowed for the gas to be ionized at large along with reproducing many of the observations of the DIG. In reality the ISM is clumped on a large range of sizescales, so the Miller & Cox density provides an estimate of the smooth component required to allow ionizing photons to penetrate to large . Therefore, such a density is a good starting point for 3D models that incorporate smooth and clumpy components: the smooth component should be close to that used by Miller & Cox.
2.3 Ionizing Sources and Spectra
We consider single sources within multi-component ISM density distributions. The ionizing spectra are taken from the WM-basic model atmosphere library (Pauldrach et al. 2001; Sternberg, Hoffmann, & Pauldrach 2004) which provides model atmospheres and emergent spectra including the effects of non-LTE line-blanketing and stellar winds. We did not run the WM-basic models, but used spectra from the library generated by Sternberg et al. (2004). The spectra used were for model atmospheres with solar abundances, and gravities and temperatures in the range and 30000 K 50000 K.
3 Standard Model
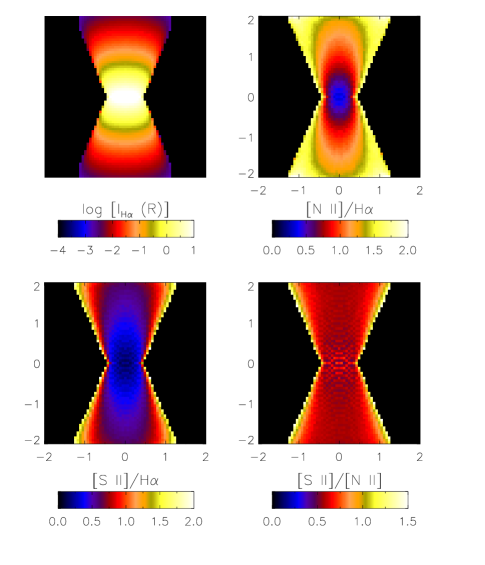
Our standard single source model has the two component, smooth density structure of Eq. 1, an ionizing luminosity , and an ionizing spectrum for a WM-basic model atmosphere with K and . The output of the photoionization simulation is the 3D temperature and ionization structure for the elements that we track. Using the output temperature and ionization grids, we then calculate emissivity grids for various lines and form maps of the intensity and line ratios. The results of our standard simulation are shown in Figs. 1 – 5.
In forming the emissivity grid we do not include cells that have . Emissivities for cells in our simulations that have higher neutral fractions are unreliable due to the resolution of our grid. Also, because we do not include the dynamics of ionization fronts, emissivities from such cells are not correct since the physics of the ionization front is not included in our simulations (see Wood et al. 2004 for further discussion).
Numerical noise in the Monte Carlo simulations is most easily seen in the figures showing cuts across the line ratio maps in Fig. 3 and the [N II]/[S II] cut in Fig. 5. The “jaggedness” of the lines in these figures can be taken as an estimate of the numerical noise in forming the various line ratios. Noise is also seen in the [S II]/H vs H and [S II]/H vs H scatter plots in Fig. 5, with some points deviating from the clear anti-correlation. Although these discrepant points appear to give a large spread in an otherwise tight anti-correlation, they represent only a few percent of all points plotted and are generally towards the edge of the ionized zone where our photon statistics are poorest.
Figure 1 shows maps of the H intensity (in Rayleighs), and the [N II]/H, [S II]/H, and [S II]/[N II] line ratios. In calculating the H intensity we have assumed that all the emission from the simulation grid is at a distance of 2.5 kpc, roughly the distance to the Perseus arm (Haffner et al. 1999). This figure immediately shows the anticipated increase in [N II]/H and [S II]/H with increasing distance from the central ionizing source. The increasing line ratios arise from the hardening of the radiation field and subsequent increasing temperatures at large distances from the source.
For this simulation [S II]/[N II] , similar to that seen in the local DIG (Haffner et al. 1999), and rises rapidly at the outermost edges of the ionized region. The rapid rise is explained by the relative ionization states of the elements. Close to the edge of the ionized region, N is mostly N+ and then transitions rapidly to N0, while S is transitioning from S2+ to S+ (there is no S0 in our simulations). Therefore, S+/S increases and N+/N decreases at the edge of the ionized zone leading to the large [S II]/[N II] line ratios at the outer edges of the line ratio map (see also Bland-Hawthorn et al. 1997; Fig. 9). The rapid increase in line ratios from the interface in our simulations is generally not observed in the DIG and may reflect a shortcoming of our pure photoionization models for this interface.
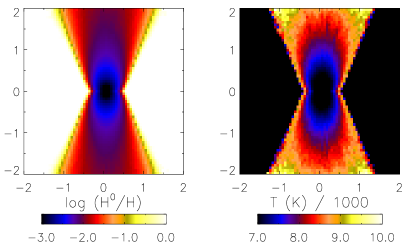
Figure 2 shows a slice through the grid in the - plane showing the ionization of H and the 2D temperature structure. The ionized volume is extended perpendicular to the plane due to the increased density in the midplane. This resembles the “Strömgren volumes ” seen in other 2D photoionization simulations. The increasing temperature with distance from the source is clearly seen in this figure.
Figure 3 shows line ratios as a function of for vertical cuts at and 0.4 kpc from the centre of the intensity maps in Fig. 1. The rise of [N II]/H and [S II]/H with increasing is apparent as discussed above. [O III]/H decreases with height above the plane, while [O I]/H and [O II]/H increase with increasing . The He I/H ratio decreases with because the radiation reaching these regions has had some of its He-ionizing photons absorbed at lower . For low density gas at 104 K, (Osterbrock 1989), so the He I/H ratio probes the helium ionization and in turn the ionizing spectrum of the DIG (Reynolds & Tufte 1995). Figure 4 shows the incident spectrum and the spectrum that reaches kpc, clearly showing the hardening of the radiation field and suppression of the He-ionizing photons.


In Fig. 5 we show a vertical cut across the centre of the [S II]/[N II] line ratio map. As in Fig. 1 we see [S II]/[N II] , similar to observations by Haffner et al. (1999). Figure 5 also shows some scatter plots as another way of displaying the trends seen in the intensity and line ratio maps of Fig. 1. These scatter plots display the values for all pixels in the line ratio images of Fig. 1. Such scatter plots (e.g., Haffner et al. 1999) show the correlation of [S II]/H with [N II]/H and the anticorrelation of [S II]/H and [N II]/H with H. The solid lines in the [S II]/H — [N II]/H scatter plot show the range of observations in the local DIG (Haffner et al. 1999) and the squares are those for NGC 891 (Rand 1998). The increase in [S II]/[N II] towards the edges of the ionized volume in our simulations is evident in the change of slope in the [S II]/H vs [N II]/H scatter plot. Note that the dots are appearing to turn around at very large values of [S II]/H, where the [N II]/H ratio is decreasing due to the transition. Our grid resolution does not allow us to follow the decrease of [N II]/H smoothly to zero. The change of slope in the [S II]/H — [N II]/H scatter plot is not present in data from the local DIG, but may be present in the NGC 891 data. Again, either the DIG is fully ionized or our models do not correctly treat emission from the ionized/neutral interface. The variation of [S II]/H and [N II]/H against H shows an anticorrelation with the line ratios being largest where the H emission is weakest, in agreement with observations.
We now show some results and discuss the effects of varying source luminosity, ionizing spectrum, inclusion of extra heating, and ionization by photons from leaky H ii regions. The intensity and line ratio maps are qualitatively similar, so our discussion mostly focuses on the intensity cuts and scatter plots for the simulations below.
3.1 Varying Ionizing Luminosity
In Fig. 6 the ionizing luminosity is varied in the range . All other parameters are the same as presented in the previous section. Increasing or decreasing the source luminosity yields larger and smaller ionized volumes. For the lowest ionizing luminosity, the simulation is radiation bounded at kpc and the vertical cut shows that the [O I]/H ratio becomes large () at the edge of the ionized volume. This is due to the combination of high temperatures and oxygen rapidly becoming neutral at the edge of the ionized volume (see discussion in § 4.2). For lower luminosity sources the [S II]/H ratio is quite large at large . This is because the ionized zone is radiation bounded and we are seeing the effects of the interface () described above. Beyond the edge of the ionized zone [S II]/H is formally infinite because the H intensity is zero. For this simulation, the resolution of our grid is not sufficient to see the rapid decrease in [N II]/H that occurs in the transition zone where . We just see the rise of [N II]/H and [S II]/H with and beyond the end of the dotted lines [N II]/H.

3.2 Varying Ionizing Spectra
The effects of varying the ionizing spectrum are displayed in Figs. 7 and 8. Line ratios and scatter plots are shown for WM-basic model atmospheres with solar abundances, and effective temperatures and values of (35000 K, 3.8), (40000 K, 3.75), (45000 K, 3.9), and (50000 K, 4.0). The ionizing luminosity is and all other parameters are as in our standard model. As found in other investigations, harder spectra produce higher temperatures and increased line ratios for [N II]/H, [S II]/H, [O II]/H, and [O III]/H. The 35000 K spectrum has little flux above 24.6 eV in the He-ionizing continuum, so the He I/H ratios are very small for this simulation.


3.3 Composite Models and Extra Heating
The results of Figs. 7 and 8 indicate that the observed line ratios in the local DIG and NGC 891 could be reproduced with a range of source spectra and luminosities. We have followed Mathis (2000) and constructed models for a point source with a composite spectrum that has the following contributions: 56% from K, 12% from K, and the rest from K. This is comparable to the solar neighbourhood where the Garmany, Conti, & Chiosi (1982) catalog shows that around 50% of the O stars are spectral type O8 or later. Figure 9 shows that [N II]/H and [S II]/H increase with height above the plane, to values close to those observed in the local DIG. The line ratios are lower than those for NGC 891, likely reflecting the hotter sources ionizing its DIG. As with our other simulations, the very large [S II]/H line ratios from the ionized/neutral interface should be viewed with caution due to incomplete physics in our code.


We have also investigated whether including additional heating may raise the [N II]/H ratio for this composite model. Following Reynolds et al. (1999), we introduce an additional heating term, , proportional to , which will dominate over photoionization heating at low at large in our simulations. The models in Fig 9 (dotted curves) and Fig. 10 have ergs/s/cm3, yielding temperatures of around 11000 K at kpc. Increasing the heating to ergs/s/cm3, yields temperatures in excess of 15000 K at kpc. The additional heating present in Figs. 9 and 10 is much lower than values inferred by Reynolds et al. (1999), ergs/s/cm3 and Mathis (2000), ergs/s/H, for 1D models and is due to the natural increase of temperatures and line ratios at large in our simulations. Figure 9 shows the [S II], [N II], and [O II] emission is boosted compared to the simulation with no additional heating, with [O II]/H providing a very good probe of additional heating (Mathis 2000). The very high [S II]/H line ratios from the ionized/neutral interface are still evident as discussed above.
3.4 Leaky H ii Regions


Observations indicate that many H ii regions are not traditional radiation bounded Strömgren spheres, but are density bounded and leak a fraction of the source luminosity into the DIG (Ferguson et al. 1996; Oey & Kennicutt 1997; Zurita et al. 2002). Depending on the source spectrum for an H ii region, its He+ zone may be smaller than the H+ zone (e.g., Osterbrock 1989). Therefore, as suggested by Reynolds & Tufte (1995), if an H ii region is density bounded beyond the He+ zone, but within the H+ zone, the spectrum leaking into the ISM may have its He-ionizing photons suppressed and the H-ionizing continuum hardened. This is seen in Fig. 4, where the spectrum leaking from a density bounded region is harder than the incident spectrum and may have its He-ionizing photons suppressed. Therefore, leaky H ii regions are a very plausible way for providing higher temperatures, due to the harder H-ionizing continuum, and lower He+ fractions, due to the suppression of the He-ionizing photons. Hoopes & Walterbos (2003) presented 1D leaky H ii region models, with some models producing elevated [S II]/H and [N II]/H and lower He I/H. We generate leaky spectra from a constant density H ii region with . The outer boundary is adjusted until the escape fraction is 15%, 30%, and 60% of the incident source spectrum. The leaky spectra are then used as the source spectrum for 2D models of the DIG. All DIG models have the same luminosity, s-1, but differ in the source spectra, shown in Fig. 11.
The incident ( K, ) and escaping spectra for our leaky H ii regions are shown in Fig. 11. The escaping spectra comprise photons that escape directly and contributions from the diffuse radiation field: H I Lyman continuum, He I Lyman continuum, He I two-photon continuum, and the He I 19.8 eV, emission line. The leaky spectra are seen to be much harder in the H-ionizing continuum (flatter, or even increasing in the interval 13.6 eV – 24.6 eV) and for low leakage fractions the He-ionizing continuum is suppressed. For leaky spectra with sources hotter than K, we found that the He-ionizing continuum is not significantly suppressed (see also Hoopes & Walterbos, Fig. 13).
Figure 12 shows the variation of line ratios with height for the leaky spectra of Fig. 11, and Fig. 13 shows the corresponding scatter plots. The spectral shape of the leaky spectrum can lead to increased or decreased [S II]/H and [N II]/H (see also Hoopes & Walterbos, Fig. 14). For the simulations shown here, [N II]/H increases as the H ii region escape fraction decreases (all simulations have the same ionizing luminosity), while [S II]/H slightly decreases for the lower escape fractions. The increase of [N II]/H for the lower escape fractions is due to the harder spectra between 13.6 eV and 24.6 eV for these models (Fig. 11). The He I/H decreases for leaky spectra due to absorption of He-ionizing photons in the H ii region. Thus some leaky H ii regions provide another way for producing the elevated temperatures, line ratios, and low He+ fraction observed in the DIG.
3.5 Other Models
We have investigated many more models than those presented above. Rather than present numerous figures, we now describe the main effects of varying other parameters.
3.5.1 Varying Density Structure
We performed simulations for a single component density structure, representing only the DIG component of the ISM. These simulations had lower temperatures, smaller [N II]/H, [S II]/H, and [O II]/H, and a larger He I/H than the two component model. This was due to the absence of the concentrated density component which yields more hardening of the spectrum reaching large in the two component density models. Similarly, the plane parallel models presented by Rand (1998) and Bland-Hawthorn et al. (1997) did not produce as large [N II]/H and [S II]/H ratios as our two-component models. It appears that a uniform slab, or single component exponential density structure cannot yield the large [N II]/H, [S II]/H that are observed without additional heating of the DIG, or hardening of the radiation field via leaky H ii region models or a multi-component ISM density structure.
3.5.2 Varying Source Location
As the source location is moved to larger heights above the plane, the ionized zone becomes radiation bounded for (e.g., Miller & Cox 1993). At large positive the grid is more ionized since the radiation has less of the concentrated higher density component to ionize and pass through before reaching the gas at large . Compared to a simulation where the source is in the midplane, vertical intensity cuts for models where the source is located above the midplane show larger line ratios towards the lower radiation bounded edge and lower line ratios towards the upper edge of the grid. These effects are seen in the simulations in § 3.1 where the source luminosity is varied.
3.5.3 Varying Elemental Abundances
Using abundances appropriate for the Perseus arm: (C, N, O, Ne, S)/H = (85, 45, 250, 71, 8) ppm (Mathis 2000) increases the [N II]/H, [S II]/H, [O II]/H, and [O III]/H line ratios by a factor of about 1.5 to 2 compared to those in Fig. 3. The lower abundances compared to our standard model result in increased line emission to obtain equilibrium temperatures, and hence the elevated line ratios.
3.5.4 Sulfur Dielectronic Recombination
Accurate modeling of the [S II] emission is not yet possible due to the unknown dielectronic recombination rates for S (see discussion in Ali et al. 1991). In our simulations we used total recombination rates for S+ and S2+ from Nahar (2000) and the average suggested for S3+ from Ali et al. (1991). The rates of Nahar (2000) are from theoretical calculations, so may not be as accurate as from experiments. We have run our standard simulation with no dielectronic recombination for S and also using the averages suggested by Ali et al. (1991) for S+, S2+, and S3+. We find the [S II]/[N II] line ratio varies by about a factor of 1.5 among the three simulations. Until more accurate dielectronic recombination rates are available, this uncertainty in modeling [S II] emission will remain.
4 Discussion
4.1 Sulfur and Nitrogen
The model line ratios presented above appear to be in good agreement with observations of [S II] and [N II] in the local DIG (Haffner et al. 1999), NGC 891 (Rand 1998), and several other galaxies (e.g., Otte et al. 2001, 2002). The increase of [N II]/H and [S II]/H with is a natural consequence of increasing temperatures away from the ionizing source due to the hardening of the radiation field. Compared to one dimensional averaged models, our two dimensional simulations reduce the requirement for extra heating to explain the increasing temperatures and line ratios with height above the midplane.
The change of slope in the [S II]/H vs [N II]/H scatter plots (e.g., Fig. 8) are not observed in the Milky Way’s DIG (Haffner et al. 1999). The change of slope in our simulations is due to the increased S+/S and N0/N fractions at the edge of the ionized volumes. The fact that such slope changes are not observed suggests that the DIG is almost fully ionized and not density bounded like our single source models. We will investigate multiple source models with overlapping ionized regions in a separate paper. Alternatively, it is quite likely that our models do not provide a good representation of the emission at the ionized/neutral interface as we do not include the effects of shocks or ionization fronts. The role of interfaces in interpreting ISM observations is very important (Reynolds 2004), and the very large [S II]/H and [N II]/H line ratios in our simulations may be a result of incomplete physics in our simulations.
Some galaxies do show changes in slope of the [S II]/H vs [N II]/H and this has recently been interpreted by Elwert, Dettmar, & Tüllmann (2003) as an indicator for chemical evolution in galaxies. They suggest that increased [S II]/H compared to [N II]/H may arise from younger DIG layers since in the ISM nitrogen (from low mass stars, planetary nebulae, and stellar winds) is enriched more slowly than sulfur (from spuernovae type II). Our models adopt uniform abundances throughout the simulation grid and do not address this scenario.
4.2 Oxygen
There is currently limited data on oxygen lines in the Milky Way’s DIG, with most observations probing the DIG at . However, in NGC 891 there are detailed observations of the dependence of [O III]/H and [O I]/H with height above the plane and Otte et al. (2001, 2002) have made measurements of [O II]/H in several galaxies. Rand (1998) finds that [O III]/H increases with height, which is opposite to what is seen in almost all of our simulations. The increase of [O III]/H with in NGC 891 is cited as evidence for O being ionized by a different mechanism, such as shocks (e.g., Collins & Rand 2001), instead of pure photoionization. Our models do not consider dynamics or ionization fronts, so cannot address these effects. Note, however, that models with very hard spectra ( K, Fig. 7) can produce increasing [O III]/H at large .
Otte et al. (2001, 2002) observe [O II]/H and [O III]/H to increase with height above the plane in five galaxies they studied, finding . They also observed increases of [S II]/H and [N II]/H with . Our pure photoionization models predict , and additional heating can raise this even further (e.g., Fig. 9). It appears that multi-dimensional pure photoionization models can reproduce most of the [O II]/H observations of Otte et al. (2001, 2002), though additional heating or a harder ionizing spectrum may be required for some of the largest [O II]/H ratios.
The [O I]/H line ratios in our models show that [O I] increases in strength towards the edge of the ionized zone. The strong charge-exchange coupling of O0 to H0 and the increased temperatures towards the edge of the ionized zone result in the increased [O I]/H. This is generally seen as a problem with photoionization models, since in the few observations in the local DIG, albeit at , [O I] is observed to be rather weak with [O I]/H. The [O I] emission may be reduced if the region is fully ionized, or density bounded instead of radiation bounded (e.g., Mathis 2000; Sembach et al. 2000). This is seen in the vertical cuts showing that [O I]/H in models where the gas is ionized beyond the maximum of our simulation box (e.g., Fig. 3). The increasing [O I]/H with in some of our simulations (e.g., Fig. 6) do match the data for NGC 891, where [O I]/H at large (Rand 1998). More observations of [O I] at larger in the Galactic DIG will determine whether there really is a difference in the [O I] emission between the Milky Way and NGC 891.
4.3 Helium
As with [O I], the few measurements of He I in the Galactic DIG are at . The observations indicate that helium is underionized relative to hydrogen with (Reynolds & Tufte 1995; see also Heiles et al. 1996). The He I observations probe the ionizing spectrum for the DIG and indicate a relatively soft spectrum, typically spectral type O8 or later, corresponding to K. The situation is not as extreme in NGC 891 where He+/H, indicating a harder ionizing spectrum for its DIG (Rand 1997).
Our simulations using a composite spectrum, representative of the O stars in the solar neighbourhood, produce fairly low values for He I/H, in line with current observations at . Further observations of He I at higher latitudes will provide additional tests of our models and the hardening of the radiation field at large .
We have also investigated an alternative mechanism for reducing the helium ionization, even when the sources are hotter than O8. The basic idea is that the radiation leaking out of midplane H ii regions to ionize the DIG may have its helium ionizing photons suppressed (e.g., Hoopes & Walterbos 2003). Our leaky H ii region models do indeed show that low values for He+/H+ may be obtained, even if the ionizing source is quite hot. For the same ionizing luminosity, these models also produce higher temperatures than our other models, since the leaking ionizing spectrum is harder in the H-ionizing continuum. Therefore, leaky H ii regions provide a plausible mechanism for explaining the low helium ionization in the Galactic DIG.
5 Summary
We have presented some of the first multi-dimensional photoionization simulations investigating intensity and line ratio maps in models of the Milky Way’s diffuse ionized gas. Our models produce [S II]/H and [N II]/H line ratios that are in good agreement with observations. Our simulations reproduce the observed increase of [S II]/H and [N II]/H with increasing due to the increasing temperatures at large distances from the ionizing sources. Previous analyses of line ratios in the DIG suggested additional heating was required to reproduce the elevated line ratios at large . However, this appears to be due to the use of spherically averaged photoionization models.
Most of our simulations do not include any additional heating above that provided by pure photoionization. When we did include extra heating it was much less than used in 1D photoionization models of the DIG. Models such as those presented here, where line ratios are constructed for rays piercing the outer edges of photoionized regions, are more appropriate for the DIG. We have also shown that leaky H ii regions provide a plausible explanation for the low helium ionization in the DIG. The hardened leaky spectra produce higher temperatures than our standard models, in agreement with other work (Hoopes & Walterbos 2003).
Unless we use very hard ionizing spectra, our models do not reproduce the observed increase of [O III]/H with in NGC 891. The observed rise of [O III]/H may be due to hotter ionizing sources or an additional source of ionization not present in our photoionization simulations (e.g., shocks or massive stars formed at large from the dense clouds observed there, Howk & Savage 1997). Another potential problem with our simulations is that they do not treat the physics at the ionization front, possibly resulting in an overprediction of the [S II]/H line ratios. Despite these shortcomings, our models clearly demonstrate the importance of geometry in models of the DIG: compared to homogeneous or single component densities, multi-component models produce more hardening of the radiation field, and more elevated temperatures at large . In a future paper we will explore 3D models incorporating the known locations, luminosities, and spectral types of O stars in the Solar neighbourhood. The WHAM data in addition to the H I atlas (Hartmann & Burton 1997) should enable us to place constraints on the ISM density structure.
We thank Alison Campbell, Torsten Elwert, Barbara Ercolano, Matt Haffner, Kirk Korista, Lynn Matthews, John Raymond, Ron Reynolds, Jon Slavin, and Steve Tufte for many useful discussions relating to this work. Suggestions from an anonymous referee resulted in a clearer presentation of our results. KW acknowledges support from a PPARC Advanced Fellowship, JSM claims to be retired.
References
- Ali et al. (1991) Ali, B., Blum, R.D., Bumgardner, T.E., Cranmer, S.R., Ferland, G.J., Haefner, R.I., & Tiede G.P. 1991, PASP, 103, 1182
- Anders & Grevesse (1989) Anders, E., & Grevesse, N. 1989, Geochim, Cosmochim. Acta, 53, 197
- Bland-Hawthorn et al. (1997) Bland-Hawthorn, J., Freeman, K.C., & Quinn, P.J. 1997, ApJ, 143, 155
- Ciardi et al. (2002) Ciardi, B., Bianchi, S., & Ferrara, A. 2002, MNRAS, 331, 463
- Collins & Rand (2001) Collins, J.A., & Rand, R.J. 2001, ApJ, 551, 57
- Dickey & Lockman (1990) Dickey, J.M., & Lockman, F.J. 1990, ARA&A, 28, 215
- Domgoergen & Dettmar (1997) Domgoergen, H., & Dettmar, R.-J. 1997, A&A, 322, 391
- Domgoergen & Mathis (1994) Domgoergen, H., & Mathis, J.S. 1994, ApJ, ApJ, 428, 647
- Dove & Shull (1994) Dove, J.B., & Shull, J. M. 1994, ApJ, 423, 196
- Elwert et al. (2003) Elwert, T., Dettmar, R.-J., & Tüllmann, R. 2003, BAAS, 203, 111.05
- Ercolano et al. (2003) Ercolano, B., Barlow, M. J., Storey, P. J., & Liu, X.-W. 2003, MNRAS, 340, 1136
- Ferguson et al. (1996) Ferguson, A.M., Wyse, R.F.G., Gallagher, J.S., & Hunter, D.A. 1996, AJ, 111, 2265
- Garmany et al. (1982) Garmany, C.D., Conti, P.S., & Chiosi, C. 1982, ApJ, 263, 777
- Haffner et al. (1999) Haffner, L.M., Reynolds, R.J., & Tufte, S.L. 1999, ApJ, 523, 223
- Hartmann & Burton (1997) Hartmann, D., & Burton, W.B. 1997, “Atlas of Galactic Neutral Hydrogen,” Cambridge University Press
- Heiles et al. (1996) Heiles, C., Koo, B-C., Levenson, N. A. & Reach, W. T. 1996, ApJ, 462, 326
- Hoopes et al. (1996) Hoopes, C.G., Walterbos, R.A.M., & Greenawalt, B.E. 1996, AJ, 112, 1429
- Hoopes & Walterbos (2003) Hoopes, C.G., & Walterbos, R.A.M. 2003, ApJ, 586, 902
- Howk & Savage (1997) Howk, J.C., & Savage, B.D. 1997, AJ, 114, 2463
- Mathis (2000) Mathis, J. S. 2000, ApJ, 544, 347
- Mathis (1986) Mathis, J. S. 1986, ApJ, 301, 423
- Miller & Cox (1993) Miller, W. W., III, & Cox, D. P.1993, ApJ, 417, 579
- Minter & Spangler (1997) Minter, A. H., & Spangler, S. R., 1997, ApJ, 458, 194
- Nahar (2000) Nahar, S.N. 2000, ApJS, 126, 537
- Och, Lucy, & Rosa (1998) Och, S. R., Lucy, L. B., & Rosa, M. R. 1998, A&A, 336, 301
- Oey & Kennicutt (1997) Oey, M.S., & Kennicutt, R.C. 1997, MNRAS, 291, 827
- Otte et al. 2002 (2002) Otte, B., Gallagher, J.S., & Reynolds, R.J. 2002, ApJ, 572, 823
- Otte et al. 2001 (2001) Otte, B., Reynolds, R.J., Gallagher, J.S., & Ferguson, A.M.N. 2001, ApJ, 560, 207
- Otte & Dettmar (1999) Otte, B., & Dettmar, R.-J. 1999, A&A, 343, 705
- Osterbrock (1989) Osterbrock, D. E. 1989, Astrophysics of Gaseous Nebulae and Active Galactic Nuclei, University Science Books, Mill Valley, CA
- Pauldrach et al. (2001) Pauldrach, A.W.A., Hoffmann, T.L., & Lennon, M. 2001, A&A, 375, 161
- Rand (1998) Rand, R. 1998, ApJ, 501, 137
- Rand (1997) Rand, R. 1997, ApJ, 474, 129
- Raymond (1992) Raymond, J.C. 1992, ApJ, 384, 502
- Reynolds (2004) Reynolds, R.J. 2004, to appear in “How Does the Galaxy Work?”, E.J. Alfaro, E. Perez, & J. Franco, eds.
- Reynolds, Haffner, & Madsen (2002) Reynolds, R. J., Haffner, L. M., & Madsen, G. J., 2002, in “Galaxies: the Third Dimension”, M. Rosada, L. Binette, & L. Arias, eds. (Astr. Soc. Pacific,: San Francisco)
- Reynolds, Haffner, & Tufte (1999) Reynolds, R. J., Haffner, L. M., & Tufte, S.L. 1999, ApJ, 525, L21
- Reynolds & Tufte (1995) Reynolds, R. J., & Tufte, S. L. 1995, ApJ, 448, 715
- Reynolds & Cox (1992) Reynolds, R. J., & Cox, D.P. 1992, ApJ, 400, L33
- Reynolds (1985) Reynolds, R. J. 1985, ApJ, 294, 256
- Sembach et al. (2000) Sembach, K.R., Howk, J.C., Ryans, R.S.I., & Keenan, F.P. 2000, ApJ, 528, 310
- Slavin et al. (1993) Slavin, J.D., Shull, J.M., & Begelman, M.C. 1993, ApJ, 407, 83
- Sternberg et al. (2004) Sternberg, A., Hoffmann, T.L., & Pauldrach A.W.A., 2004, ApJ, in press, astro-ph/0312232
- Verner & Ferland (1996) Verner, D. A, & Ferland, G. J. 1996, ApJS, 103, 467
- Wang et al. (1998) Wang, J., Heckman, T.M., & Lehnert, M.D. 1998, ApJ, 509, 93
- Wood et al. (2004) Wood, K., Mathis, J.S., & Ercolano, B. 2004, MNRAS, in press, astro-ph/0311584
- Wood & Loeb (2000) Wood, K., & Loeb, A. 2000, ApJ, 545, 86
- Zurita et al. (2002) Zurita, A., Beckman, J.E., Rozas, M., & Ryder, S. 2002, A&A, 386, 801