Planets in Stellar Clusters Extensive Search. II. Discovery of 57 Variables in the Cluster NGC 2158 with Millimagnitude Image Subtraction Photometry.
Abstract
We have undertaken a long-term project, Planets in Stellar Clusters Extensive Search (PISCES), to search for transiting planets in open clusters. NGC 2158 is one of the targets we have chosen – an intermediate age, populous, rather metal poor cluster. In this paper we present the results of a search for variable stars in the data from the first season of monitoring at the FLWO 1.2 m telescope. This is the first variability search ever conducted in this cluster. We present a catalog of 57 variable stars, most with low amplitude variability. Among the variables is a cataclysmic variable (CV) which underwent a 2.5 mag outburst. If it is a member of NGC 2158, this would be the fourth CV known in an open cluster. We have also found five Scuti stars, three of which we have two or more detectable modes of pulsation. Of the 57 variables discovered, 28 have -band amplitudes of 5% or below. Six of those vary at or below the 2% level, including one with 0.08% variability.
1 Introduction
We have undertaken a long-term project, Planets in Stellar Clusters Extensive Search (PISCES), to search for transiting planets in open clusters. In Mochejska et al. (2002, hereafter Paper I) we demonstrated that we are capable of attaining the requisite photometric precision, based on one season of data for NGC 6791.
In this paper we present the results of a search for variable stars in our second target, NGC 2158, based on the data from the first observing season.
NGC 2158 is a rich open cluster of intermediate age (2-3 Gyr). It is rather metal poor ([Fe/H]=-0.46) and is located at a distance of 3600 pc (Carraro et al. 2002, hereafter Ca02; Christian, Heasley and Janes 1985). Despite being one of the most populous galactic open clusters, it has never been investigated for variability. The only published CCD photometry for this cluster is that of Christian et al. (1985), Piersimoni et al. (1993) and Ca02. An extensive catalog of photographic photometry and proper motions has been published by Kharchenko, Andruk & Schilbach (1997, hereafter KAS97).
The paper is arranged as follows: §2 describes the observations, §3 summarizes the data reduction procedure and §4 contains the variable star catalog. Concluding remarks are found in §5.
2 Observations
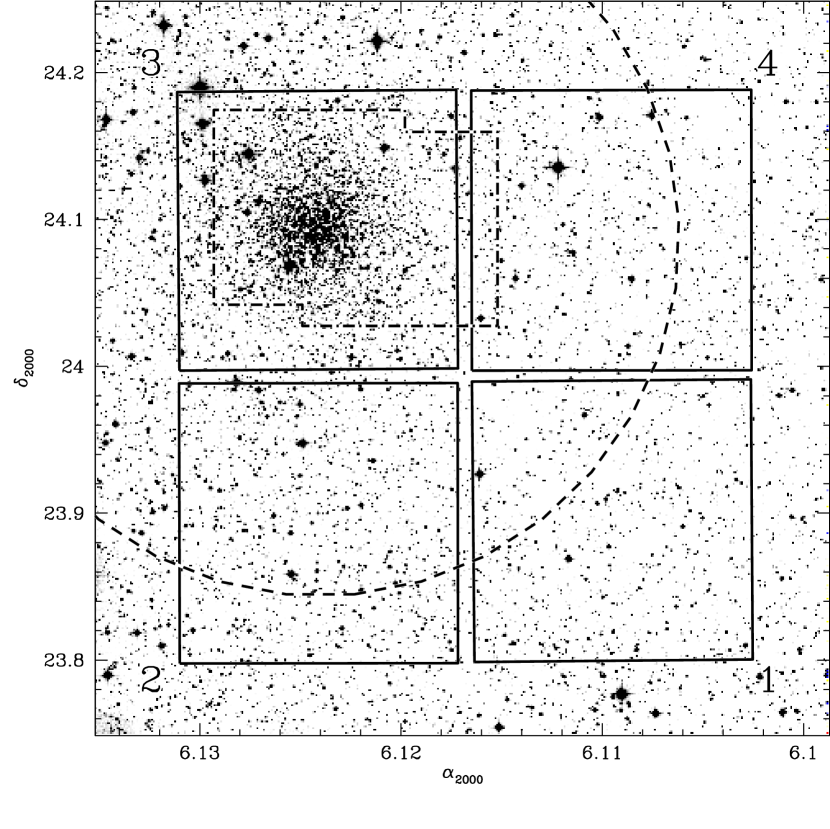
The data were obtained at the Fred Lawrence Whipple Observatory (FLWO) 1.2 m telescope using the 4Shooter CCD mosaic with four thinned, back side illuminated AR coated Loral CCDs (Szentgyorgyi et al. 2004). The camera, with a pixel scale of pixel-1, gives a field of view of for each chip. The cluster was centered on Chip 3 (Fig. 1). The data were collected during 20 nights, from 3 January to 11 March, 2003. A total of s and s -band exposures were obtained. The median seeing was in and in .
3 Data Reduction
3.1 Image Subtraction Photometry
The preliminary processing of the CCD frames was performed with the standard routines in the IRAF ccdproc package.111IRAF is distributed by the National Optical Astronomy Observatories, which are operated by the Association of Universities for Research in Astronomy, Inc., under cooperative agreement with the NSF.
Photometry was extracted using the ISIS image subtraction package (Alard & Lupton 1998, Alard 2000). A brief outline of the applied reduction procedure is presented here. For a more detailed description the reader is referred to Paper I.
The ISIS reduction procedure consists of the following steps: (1) transformation of all frames to a common coordinate grid; (2) construction of a reference image from several of the best exposures; (3) subtraction of each frame from the reference image; (4) selection of stars to be photometered and (5) extraction of profile photometry from the subtracted images.
All computations were performed with the frames internally subdivided into four sections (sub_x=sub_y=2). Differential brightness variations of the background were fit with a first degree polynomial (deg_bg=1). A convolution kernel varying quadratically with position was used (deg_spatial=2). The psf width (psf_width) was set to 33 pixels and the photometric radius (radphot) to 5 pixels. The reference images were constructed from 20 best exposures.
3.2 Calibration
The photometry in Chips 3 and 4 was calibrated from the photometry published by Ca02. 1410 stars above and 1312 above were used to determine the zero point of the magnitude scale for Chip 3. Since the overlap with Chip 4 was marginal (see Fig. 1), we used 44 stars above and . The rms scatter of the residuals in and , respectively, was 0.046 and 0.052 in Chip 3 and 0.065 and 0.059 in Chip 4.
The -band photometry for Chips 1 and 2 was calibrated from the KAS97 photographic photometry. To determine the zero point we used stars above 17 mag in both bands: 39 and 19 in and for Chip 1, and 169 and 87 for Chip 2. The rms scatter of the residuals in and , respectively, was 0.18 and 0.14 in Chip 1 and 0.17 and 0.12 in Chip 2.
As a consistency check we have calibrated Chip 3 and 4 photometry from the KAS97 catalog and found an offset between the calibration based on Ca02. We have also compared the KAS97 and Ca02 catalogs directly, and confirm the difference between their zero points. The offsets range from 0.11 to 0.19 in and 0.04 and 0.1 in , depending on the sample of stars used. Since we could not constrain well the offsets between KAS97 and Ca02, we have left Chips 3 and 4 on the Ce02 scale, and Chips 1 and 2 on the KAS97 scale.
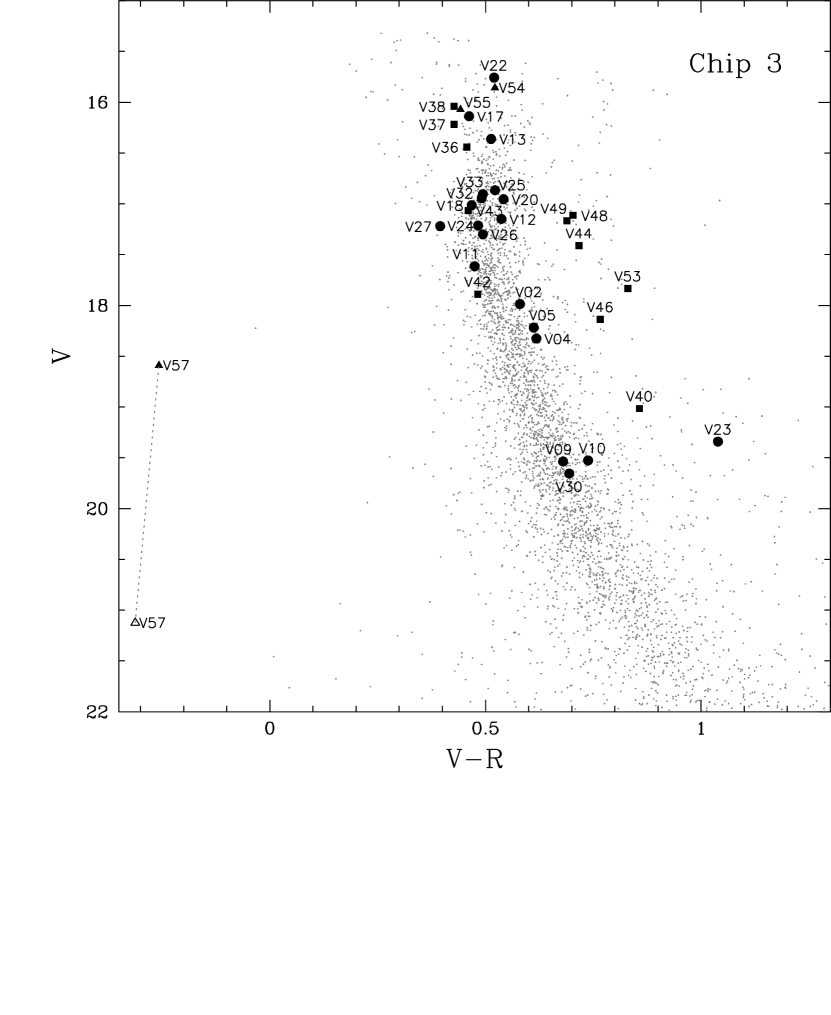
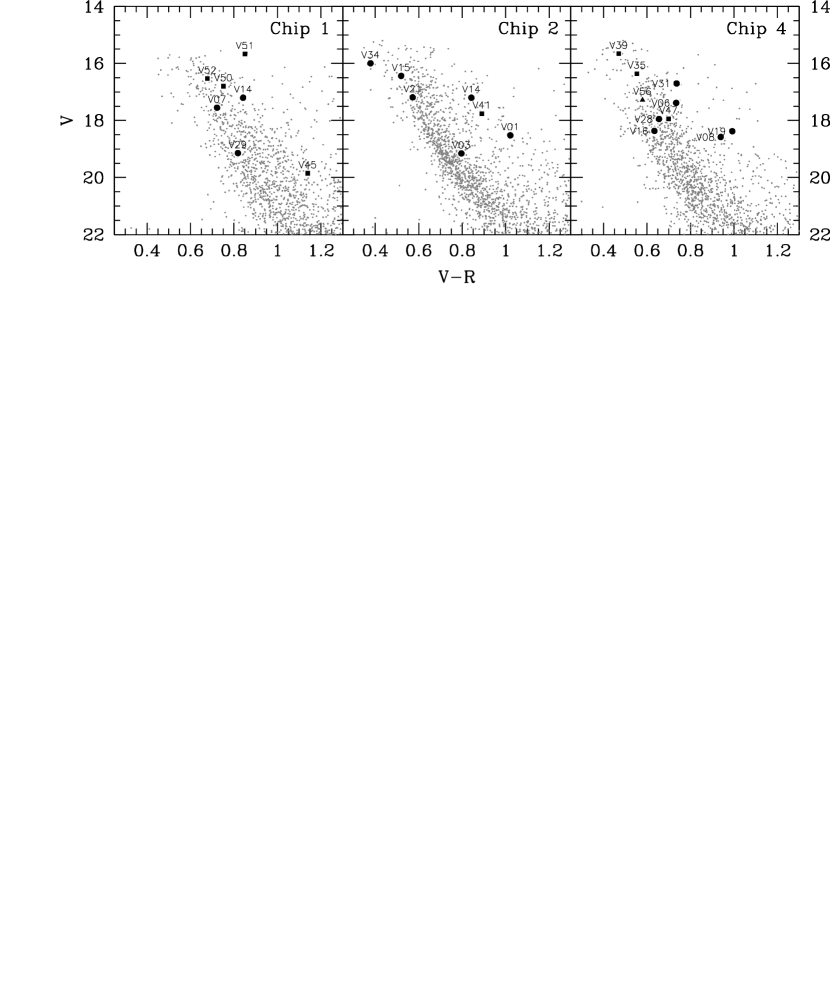
In Figures 2 and 3 we present the color-magnitude diagrams (CMD) for Chip 3 and Chips 1, 2, 4, respectively. The CMD for Chip 3, centered on the cluster, shows a well defined main sequence (MS) from the turnoff down to . The CMDs for the remaining chips are dominated by disk stars. There are 1429, 1764, 3842 and 1436 stars above in Chips 1 through 4, respectively.
3.3 Astrometry
Equatorial coordinates were determined for the -band template star lists. The transformation from rectangular to equatorial coordinates was derived using 740, 922, 1170, and 777 transformation stars from the USNO B-1 catalog (Monet et al. 2003) in Chips 1 through 4, respectively. The average difference between the catalog and the computed coordinates for the transformation stars was .
3.4 Selection of variables
We extracted the light curves for all stars detected by DAOphot (Stetson 1987) on the template frames and searched them for variability using the index (Stetson 1996), as described in more detail in Paper I. The definition of requires observations to be closely spaced in time. Points separated by a value smaller than some threshold (0.03 days in our case) are grouped into pairs and only when both have a residual from the mean of the same sign, the pair contributes positively to the variability index.
To search for periodicities we have used the method introduced by Schwarzenberg-Czerny (1996), employing periodic orthogonal polynomials to fit the observations and the analysis of variance (ANOVA) statistic to evaluate the quality of the fit.


4 Variable Star Catalog
We have discovered 57 variables in all four chips, all newly discovered: 34 eclipsing binaries, 19 other periodic and 4 long period or non-periodic variables.
The properties of the variables are discussed in §4.1-4.5. Tables 1, 2 and 3 list the following parameters for the variables: the identification number, right ascension, declination, period (if applicable), and -band magnitudes (maximum for non-periodic and eclipsing variables, flux weighted mean for periodic) and variability amplitudes in each band (semiamplitudes for periodic variables). The last two columns in Tab. 1 and 2 provide the probabilities and for cluster core and corona membership, taken from KAS97. The -band light curves of all variables are shown in Figures 4-8.222The band photometry and finding charts for all variables are available from the authors via the anonymous ftp on cfa-ftp.harvard.edu, in the /pub/bmochejs/PISCES directory.
The variables are plotted on CMDs for their respective chips (Figs 2 and 3). Eclipsing binaries are marked with circles, other periodic variables with squares and miscellaneous variables with triangles. By far the largest number of variables, 34, were found on Chip 3, centered on the cluster, compared to 6, 7 and 10 on Chips 1, 2 and 4, respectively. This is in agreement with the 5 radius estimate for the cluster (Lyngå 1987).
4.1 Eclipsing Binaries
We have identified 34 eclipsing binaries. Six are contact W UMa type systems (V01, V02, V04, V05, V07, V12). More than half of the variables could either be EB-type eclipsing binaries or ellipsoidal variables, as most have periods in excess of a day and amplitudes below 0.1 mag (V03, V08, V11, V14-V27, V33). It is possible that some of the longer period systems could be BY Dra type spotted stars with half the reported period. There are also seven Algol type detached binaries (V09, V10, V13, V28-V30, V32, V34). V06 and probably V31 are RS CVn type binaries, where one of the components has non-uniform surface brightness due to cool spots. A starspot wave is seen on top of the variability due to eclipses.

Proper motion data from KAS97 show that V12, V22 and V24 are most likely cluster members, while V14 is rather not. For V21, V28 and V31 the data are inconclusive.

4.2 Scuti stars
We have identified five variables, V35-V39, with periods 0.0981-0.1220 d and amplitudes 0.008-0.076 mag, located in the blue straggler region of the CMD. Their periods and amplitudes are typical for Scuti variables. Their positions on the CMD are also consistent with their identification as Scuti variables. In clusters considerably older than 1 Gyr the main sequence turnoff is located redward of the instability strip. Consequently, only blue stragglers can display Scuti variability (Rodríguez & Breger 2001).
For three of these variables, V35-V37, we have detected pulsations in more than one mode. Table 4 lists identified periods. Figures 5 and 6 show their light curves, phased with each detected period: raw in the left panels, and subtracted of variability corresponding to other periods in the right panels. The simultaneous excitation of multiple modes of pulsation is typical for Scuti variables, and such stars have been detected in open clusters (Rodríguez 2002, Freyhammer, Arentoft & Sterken 2001, Pigulski, Kolaczkowski, & Kopacki 2000).
The ratios of the periods range from 1.020 to 1.071. Such close frequency pairs are observed in the majority of well studied Scuti stars (Breger & Bischof 2002). For periods around 0.1 d the ratio between the fundamental and first overtone period for Population I Scuti stars is generally below 0.775 (Templeton, Basu & Demarque 2002). This implies that at least one of the excited modes of pulsation is non-radial.
Using the fundamental mode Period-Luminosity (P-L) relation for Scuti stars (Eq. 4 in Petersen & Christensen-Dalsgaard 1999), (Patriarchi, Morbidelli, & Perinotto 2003), 333The final determination of in Ca02 was mag. Here we are using the reddening and distance modulus obtained by them from isochrone fits. and (Ca02), we get deviations from the cluster distance modulus less than 0.15 mag for all stars except V39 (Tab. 4). This confirms that these stars are most likely Scutis belonging to NGC 2158. One possible cause of discrepancy for V39 could be that the mode of pulsations we have identified is not the fundamental mode.
Four of these stars have proper motion data in KAS97. Cluster membership of V36 is confirmed with high probability, while for V35 and V39 the data are not conclusive. The catalog reports a very low cluster membership probability for V38, which is in disagreement with our conclusions based on the Scuti P-L relation. The study of KAS97 was also targeting much brighter stars ( mag) in M 35 and two other clusters at smaller distances than NGC 2158. The authors say that their proper motion measurement “accuracy decreases rapidly for stars fainter than mag”, while the magnitude range of NGC 2158 variables is 15.7-18.0, and for V38.

4.3 Other periodic variables
All of the remaining periodic variables are located redward of the MS, except for V42 and V43, which are located at its blue edge. Some of these variables could be BY Draconis type variables – rotating spotted stars. Six of the 13 variables are located on Chips 1, 2 and 4, making it likely that many of them are not cluster members.
V48 seems to have a variable amplitude. Variables V44, V48 and V49 on Chip 3, if they belong to the cluster, might be members of the newly proposed class of variable stars termed “red stragglers” (Albrow et al. 2001) or “sub-subgiant stars” (Mathieu et al. 2003). KAS97 gives a probability of corona memberships of 80%, 69% and 41% for V44, V48 and V49, respectively. To date, six such stars have been found in 47 Tuc (Albrow et al. 2001) and two in M67 (Mathieu et al. 2003). Thus far, the origin and evolutionary status of these stars remains unknown.
Variables V50 and V52 on Chip 1 and the RS CVn eclipsing binary V31 on Chip 4 also fall in the same region in the CMD. Since they are further from the cluster center, it is less likely they are members of NGC 2158 and of this class. The KAS97 catalog suggests V50 is most likely not a cluster member, and it is inconclusive for V31.
The variable V42 has a sharply peaked light curve, reminiscent of RR Lyrae or short-period Cepheids. Its amplitude of 0.14 in is much too low for either of those two types of variables, unless it is blended with another star along the same line of sight. The KAS97 catalog gives it a high probability of being a cluster member. If V42 were really a member, it would have and would be too faint to be either of these variables. On the CMD it is located at the blue edge of the MS (Fig. 2). The data for V42 from all nights, except the sixth and seventh, phase well with a period of 1.5393 days. In Fig. 7 the points from these two discrepant nights are marked with solid gray squares. For the full dataset (or even nights 1-7) a good period cannot be determined. The examination of images from nights six and seven did not reveal any defects, such as bad columns, extremely high background or a bad psf, or anything that would suggest that the brightness measurements might be less accurate. Also, the data from these two nights show a coherent rise in brightness, which makes it more unlikely that these measurements are erroneous.

4.4 Cataclysmic Variable Candidate
We have identified a cataclysmic variable (CV) candidate V57. The star has undergone an outburst with an amplitude of 2.5 mag in and . Its very blue color, in maximum and in minimum, supports this classification. If confirmed spectroscopically as a CV, and as a member of NGC 2158, this would be only the fourth CV known in an open cluster, with the other three being star 186 in M67 (Gilliland et al. 1991) and B7 and B8 in NGC 6791 (Kaluzny et al. 1997).
The color of this CV candidate is in fact implausibly blue. We searched for this star in the Ca02 catalog, to check its color, but it is not listed there. We have obtained independent color derivations for this variable from three sets of and -band images taken on different nights when this object was near maximum brightness. One of these sets came from our most recent observations, not included in this analysis. These sets were calibrated independently against the Ca02 catalog. The color estimates ranged from -0.24 to -0.31. Unfortunately the seeing in was over on all -band images when the variable was at maximum, so the -band magnitude probably has a considerable error associated with it.
Assuming the NGC 2158 distance and reddening derived by Ca02, we get the minimum absolute -band magnitude of 6.4 mag. From Fig. 3.5 in Warner (1995) it is apparent that is roughly 8 mag for U Gem type dwarf novae, but even the most extreme Z Cam type systems have below 6.8 mag. This would imply that V57 is a dwarf nova located in front of the cluster, and would also make the color less extreme, assuming it has a much smaller reddening.
It should be noted, however, that the band magnitude alone is not sufficient to exclude this variable as a cluster member. Another cataclysmic variable, B7 in NGC 6791, is seen most of the time in a high state at , and has been caught only once in its low state at . Further investigation is needed to resolve the nature of V57. A spectrum of a dwarf nova in quiescence should display Balmer emission on a blue continuum. During outburst the emission lines are gradually overwhelmed by the increasing continuum and development of broad absorption lines (Warner 1995). If V57 is in a “high” level, like B7, then this will be apparent in the spectrum and emission lines should not be prominent.
4.5 Long period or non-periodic variables
The variable V54 exhibits irregular variability and is located in the blue straggler region of the CMD. V55 is a detached eclipsing binary with one primary and one secondary eclipse observed, also probably a blue straggler.
The shape of the light curve of V56 is very similar to V57, only with a much smaller amplitude of 0.07 in and in . On the CMD it is located near the main sequence turnoff. We have considered the possibility that the variability of V56 could be an artifact related to V57, although the fact that V56 was detected on a different chip than V57 makes it less likely. We have examined images from two nights, when the variable was at minimum and maximum brightness, and found nothing suspicious. A simple examination under IRAF with imexam confirms the variability of this star, as well as its amplitude.
5 Conclusions
In this paper we present photometry for 57 newly discovered variable stars in the intermediate age, populous, rather metal poor cluster NGC 2158. We have identified 34 eclipsing binaries, 19 other periodic variables and 4 long period or non-periodic variables. Among these variables we have discovered five Scuti stars. For three of them we have identified two or more modes of pulsation. We have also found a cataclysmic variable which underwent a 2.5 mag outburst. If it is a member of NGC 2158 (which at this point does not seem very likely) this would be the fourth CV known in an open cluster.
Of the 57 variables discovered, 28 have -band amplitudes of 5% or below. Six of those vary at or below the 2% level, including one with 0.08% variability. This, together with the results from Paper I, shows that we are capable of attaining requisite photometric precision to detect variability at the level expected for planetary transits.
References
- (1) Alard, C., Lupton, R. 1998, ApJ, 503, 325
- (2) Alard, C. 2000, A&AS, 144, 363
- (3) Albrow, M. D., Gilliland, R. L., Brown, T. M., Edmonds, P. D., Guhathakurta, P., & Sarajedini, A. 2001, ApJ, 559, 1060
- (4) Breger, M. & Bischof, K. M. 2002, A&A, 385, 537
- (5) Carraro, G., Girardi, L., & Marigo, P. 2002, MNRAS, 332, 705 (Ca02)
- (6) Christian, C. A., Heasley, J. N., & Janes, K. A. 1985, ApJ, 299, 683
- (7) Freyhammer, L. M., Arentoft, T., & Sterken, C. 2001, A&A, 368, 580
- (8) Gilliland, R. L. et al. 1991, AJ, 101, 541
- (9) Kaluzny, J., Stanek, K. Z., Garnavich, P. M. & Challis, P. 1997, ApJ, 491, 153
- (10) Kharchenko, N., Andruk, V., & Schilbach, E. 1997, Astronomische Nachrichten, 318, 253 (KAS97)
- (11) Lyngå, G. 1987, The Open Star Clusters Catalogue, 5th edition
- (12) Mathieu, R. D., van den Berg, M., Torres, G., Latham, D., Verbunt, F., & Stassun, K. 2003, AJ, 125, 246
- (13) Mochejska, B. J., Stanek, K. Z., Sasselov, D. D., & Szentgyorgyi, A. H. 2002, AJ, 123, 3460 (Paper I)
- (14) Monet, D. G. et al. 2003, AJ, 125, 984
- (15) Patriarchi, P., Morbidelli, L., & Perinotto, M. 2003, A&A, 410, 905
- (16) Petersen, J. O. & Christensen-Dalsgaard, J. 1999, A&A, 352, 547
- (17) Piersimoni, A. & et al. 1993, Memorie della Societa Astronomica Italiana, 64, 609
- (18) Pigulski, A., Kolaczkowski, Z., & Kopacki, G. 2000, Acta Astronomica, 50, 113
- (19) Rodríguez, E. 2002, ESA SP-485: Stellar Structure and Habitable Planet Finding, 319
- (20) Rodríguez, E. & Breger, M. 2001, A&A, 366, 178
- (21) Schwarzenberg-Czerny, A. 1996, ApJ, 460, L107
- (22) Stetson, P. B. 1996, PASP, 108, 851
- (23) Stetson, P. B. 1987, PASP, 99, 191
- (24) Szentgyorgyi, A. H. et al. 2004, in preparation
- (25) Templeton, M., Basu, S., & Demarque, P. 2002, ApJ, 576, 963
- (26) Warner, B. 1995, Cambridge Astrophysics Series, Cambridge, New York: Cambridge University Press
| ID | [h] | [] | P [d] | ||||||
|---|---|---|---|---|---|---|---|---|---|
| V01 | 6 07 32.6 | 23 49 21.2 | 0.2353 | 17.498 | 18.519 | 0.092 | 0.083 | ||
| V02 | 6 07 23.3 | 24 06 12.4 | 0.3385 | 17.406 | 17.986 | 0.206 | 0.202 | ||
| V03 | 6 07 04.9 | 23 48 53.4 | 0.3522 | 18.360 | 19.156 | 0.595 | 0.714 | ||
| V04 | 6 07 17.5 | 24 04 45.7 | 0.3555 | 17.709 | 18.327 | 0.198 | 0.211 | ||
| V05 | 6 07 40.6 | 24 05 03.7 | 0.3635 | 17.606 | 18.218 | 0.356 | 0.396 | ||
| V06 | 6 06 31.3 | 24 00 22.1 | 0.4867 | 16.649 | 17.383 | 0.191 | 0.281 | ||
| V07 | 6 06 37.0 | 23 50 41.2 | 0.5074 | 16.830 | 17.552 | 0.033 | 0.040 | ||
| V08 | 6 06 44.8 | 24 06 57.9 | 0.5464 | 17.641 | 18.580 | 0.053 | 0.079 | ||
| V09 | 6 07 29.4 | 24 10 06.4 | 0.6793 | 18.857 | 19.537 | 0.638 | 0.691 | ||
| V10 | 6 07 34.9 | 24 04 25.7 | 0.8601 | 18.788 | 19.526 | 0.331 | 0.285 | ||
| V11 | 6 07 21.4 | 24 05 39.8 | 0.9103 | 17.140 | 17.615 | 0.151 | 0.136 | ||
| V12 | 6 07 18.7 | 24 06 50.1 | 1.0573 | 16.612 | 17.149 | 0.030 | 0.036 | 71 | 78 |
| V13 | 6 07 28.1 | 24 06 35.3 | 1.2031 | 15.849 | 16.362 | 0.083 | 0.090 | ||
| V14 | 6 07 27.2 | 23 52 24.5 | 1.2097 | 16.360 | 17.202 | 0.139 | 0.125 | 1 | 28 |
| V15 | 6 07 36.1 | 23 48 24.1 | 1.5353 | 15.920 | 16.439 | 0.027 | 0.025 | ||
| V16 | 6 06 36.6 | 24 03 29.2 | 1.5868 | 17.735 | 18.369 | 0.046 | 0.059 | ||
| V17 | 6 07 31.9 | 24 06 00.3 | 1.7269 | 15.676 | 16.138 | 0.020 | 0.029 | ||
| V18 | 6 07 31.0 | 24 05 50.5 | 1.8894 | 16.546 | 17.014 | 0.034 | 0.039 | ||
| V19 | 6 06 20.5 | 24 04 48.0 | 1.9318 | 17.385 | 18.377 | 0.067 | 0.080 | ||
| V20 | 6 07 20.6 | 24 06 01.3 | 2.0593 | 16.413 | 16.955 | 0.097 | 0.102 | ||
| V21 | 6 07 36.3 | 23 56 21.4 | 2.0614 | 16.616 | 17.188 | 0.029 | 0.033 | 10 | 47 |
| V22 | 6 07 37.7 | 24 07 40.2 | 2.1311 | 15.238 | 15.758 | 0.011 | 0.013 | 72 | 90 |
| V23 | 6 07 03.5 | 24 01 45.3 | 2.2625 | 18.301 | 19.340 | 0.144 | 0.210 | ||
| V24 | 6 07 43.4 | 24 06 22.9 | 2.3042 | 16.731 | 17.214 | 0.030 | 0.040 | 59 | 79 |
| V25 | 6 07 19.9 | 24 06 24.4 | 2.3674 | 16.345 | 16.867 | 0.034 | 0.031 | ||
| V26 | 6 07 24.1 | 24 07 53.9 | 2.4563 | 16.807 | 17.301 | 0.039 | 0.065 | ||
| V27 | 6 07 30.2 | 24 07 50.6 | 2.4990 | 16.825 | 17.220 | 0.032 | 0.071 | ||
| V28 | 6 06 50.0 | 24 08 26.2 | 2.9246 | 17.295 | 17.950 | 0.138 | 0.130 | 15 | 59 |
| V29 | 6 06 46.2 | 23 49 41.4 | 3.1585 | 18.329 | 19.147 | 0.320 | 0.388 | ||
| V30 | 6 07 14.9 | 24 09 40.9 | 3.3434 | 18.961 | 19.655 | 0.387 | 0.455 | ||
| V31 | 6 06 49.0 | 24 01 43.9 | 3.7704 | 15.967 | 16.703 | 0.059 | 0.057 | 11 | 47 |
| V32 | 6 07 27.9 | 24 06 22.8 | 4.3127 | 16.454 | 16.945 | 0.154 | 0.154 | ||
| V33 | 6 07 33.3 | 24 04 34.5 | 4.7396 | 16.411 | 16.905 | 0.026 | 0.040 | ||
| V34 | 6 07 19.9 | 23 49 51.6 | 5.4016 | 15.621 | 15.999 | 0.040 | 0.033 |
Note. — Cluster core and corona membership probabilities and taken from K97.
| ID | [h] | [] | P [d] | ||||||
|---|---|---|---|---|---|---|---|---|---|
| V35 | 6 06 47.1 | 24 07 41.6 | 0.0981 | 15.809 | 16.362 | 0.008 | 0.012 | 13 | 58 |
| V36 | 6 07 16.8 | 24 05 44.9 | 0.1078 | 15.983 | 16.440 | 0.021 | 0.031 | 83 | 90 |
| V37 | 6 07 26.0 | 24 04 23.7 | 0.1113 | 15.790 | 16.217 | 0.038 | 0.045 | ||
| V38 | 6 07 11.3 | 24 03 36.5 | 0.1205 | 15.612 | 16.039 | 0.004 | 0.006 | 3 | 4 |
| V39 | 6 06 50.6 | 24 10 56.6 | 0.1220 | 15.191 | 15.661 | 0.013 | 0.019 | 4 | 23 |
| V40 | 6 07 05.6 | 24 07 06.5 | 1.3595 | 18.158 | 19.015 | 0.017 | 0.016 | ||
| V41 | 6 07 04.2 | 23 58 09.6 | 1.4937 | 16.869 | 17.759 | 0.061 | 0.045 | 7 | 28 |
| V42 | 6 07 36.3 | 24 02 07.5 | 1.5393 | 17.407 | 17.889 | 0.070 | 0.087 | 67 | 88 |
| V43 | 6 07 49.9 | 24 09 45.6 | 2.7556 | 16.605 | 17.065 | 0.010 | 0.011 | ||
| V44 | 6 07 05.8 | 24 08 51.4 | 2.8038 | 16.695 | 17.412 | 0.023 | 0.026 | 44 | 80 |
| V45 | 6 06 27.8 | 23 49 58.7 | 5.0129 | 18.712 | 19.851 | 0.050 | 0.069 | ||
| V46 | 6 07 09.7 | 24 06 50.3 | 5.4238 | 17.370 | 18.136 | 0.019 | 0.031 | ||
| V47 | 6 06 40.4 | 24 06 34.4 | 5.6076 | 17.239 | 17.938 | 0.012 | 0.011 | 7 | 51 |
| V48 | 6 07 06.2 | 24 02 10.3 | 6.3357 | 16.410 | 17.113 | 0.029 | 0.041 | 41 | 69 |
| V49 | 6 07 10.2 | 24 10 19.5 | 6.7178 | 16.478 | 17.167 | 0.027 | 0.029 | 26 | 51 |
| V50 | 6 06 43.0 | 23 55 15.3 | 7.7847 | 16.049 | 16.800 | 0.011 | 0.016 | 0 | 24 |
| V51 | 6 06 25.1 | 23 55 11.3 | 7.8308 | 14.821 | 15.672 | 0.017 | 0.017 | ||
| V52 | 6 06 24.0 | 23 54 25.7 | 17.1870 | 15.855 | 16.533 | 0.008 | 0.017 | ||
| V53 | 6 07 49.0 | 24 02 02.8 | 17.3000 | 17.004 | 17.834 | 0.020 | 0.025 | 34 | 65 |
Note. — Cluster core and corona membership probabilities and taken from K97.
| ID | [h] | [] | ||||
|---|---|---|---|---|---|---|
| V54 | 6 07 07.0 | 24 05 25.4 | 15.337 | 15.859 | 0.034 | 0.033 |
| V55 | 6 07 25.7 | 24 05 45.7 | 15.630 | 16.072 | 0.370 | 0.340 |
| V56 | 6 06 17.2 | 24 03 39.8 | 16.699 | 17.278 | 0.074 | 0.052 |
| V57 | 6 07 33.8 | 24 07 55.2 | 18.847 | 18.590 | 2.590 | 2.535 |
| ID | P1 [d] | P2 [d] | P3 [d] | (m-M)0 |
|---|---|---|---|---|
| V35 | 0.098051 | 0.104419 | 12.65 | |
| V36 | 0.107830 | 0.111341 | 0.114875 | 12.89 |
| V37 | 0.111285 | 0.106032 | 0.113531 | 12.71 |
| V38 | 0.120462 | 12.66 | ||
| V39 | 0.121997 | 12.31 |