XMM-Newton observations of the INTEGRAL X-ray transient IGR J175442619
On 2003 September 17 INTEGRAL discovered a bright transient source 3 from the Galactic Center, IGR J175442619. The field containing the transient was observed by XMM-Newton on 2003 March 17 and September 11 and 17. A bright source, at a position consistent with the INTEGRAL location, was detected by the European Photon Imaging Camera (EPIC) during both September observations with mean 0.5–10 keV unabsorbed luminosities of 1.11035 and 5.71035 erg s-1 for an (assumed) distance of 8 kpc. The source was not detected in 2003 March with a 0.5–10 keV luminosity of 3.81032 erg s-1. The September 11 and 17 EPIC spectra can be represented by a power-law model with photon indices of 2.250.15 and 1.420.17, respectively. Thus, the 0.5–10 keV spectrum hardens with increasing intensity. The low-energy absorption during both September observations is comparable to the interstellar value. The X-ray lightcurves for both September observations show energy dependent flaring which may be modeled by changes in either low-energy absorption or power-law index.
Key Words.:
Accretion, accretion disks – X-rays: individuals: IGR J175442619 – Stars: neutron – X-rays: binaries1 Introduction
About a dozen new hard X-ray transients have been discovered in the last year during INTEGRAL (Winkler et al. w:03 (2003)) observations of the galactic center region with the soft gamma-ray imager IBIS/ISGRI (Lebrun et al. le:03 (2003)). Their unusual spectral hardness has led to suggestions that these sources comprise a group of highly absorbed galactic binaries (Revnivtsev et al. re:03 (2003)). These are being preferentially detected due to the good sensitivity and large field of view of IBIS/ISGRI above 15 keV. XMM-Newton observations of the first of these, IGR J163184848, revealed intense Fe K and K and Ni K emission lines as well as strong low-energy absorption (Matt & Guainazzi mg:03 (2003); Walter et al. wa:03 (2003)). XMM-Newton observations of IGR J163204851 revealed a featureless hard continuum (Rodriguez et al. 2003b ). IGR 163584726 was observed by Chandra and showed a hard power-law spectrum with a 5880 s periodic intensity modulation (Patel et al. p:03 (2003)).
| Obs | Start Time | End Time | Exposure (ks) | EPIC mode | OM | ||||
|---|---|---|---|---|---|---|---|---|---|
| (UTC) | (UTC) | pn | MOS | pn | MOS1 | MOS2 | Exp (ks) | Filter | |
| 1 | 2003 Mar 17 20:53 | Mar 18 00:33 | 10.2 | 11.9 | FF | FF | FF | … | … |
| 2 | 2003 Sep 11 17:54 | Sep 11 22:09 | 9.3 | 11.0 | FF | FF | FF | 2.2, 3.2 | B, UVW1 |
| 3 | 2003 Sep 17 17:13 | Sep 17 19:59 | 2.5 | 8.3 | TI | TI | FF | 1.8, 1.6 | UVM2, UVW2 |
We report on a new bright transient source, IGR J175442619, discovered using IBIS/ISGRI on 2003 September 17 at 01:10 UTC during an observation of the Galactic Center region (Sunyaev et al. s:03 (2003)). The source intensity was about 160 mCrab, 60 mCrab, and 15 mCrab (at 3 confidence) in the 18–25 keV, 25–50 keV and 50–100 keV energy ranges. IGR J175442619 was bright for around 2 hours and then faded below the IBIS/ISGRI detection threshold. The source was again detected in outburst by IBIS/ISGRI later the same day between 06 and 14 hrs UTC (Grebenev et al. g:03 (2003)).
By chance, XMM-Newton observed the region of sky containing IGR J175442619 only 5 days before the INTEGRAL discovery. A source was clearly detected at a position consistent with that reported from INTEGRAL, with a mean 2–10 keV intensity of 4.510-12 erg cm-2 s-1 (González-Riestra et al. gr:03 (2003)). Rodriguez et al. (2003a ) reported on a possible optical/infrared counterpart in the USNO B1.0 catalog (B = 13.9–14.50.3 mag) and 2MASS all-sky quick-look image archive. They also noted that there are 3 fainter candidates within the preliminary 10′′ XMM-Newton uncertainty region in the 2MASS image.
The field containing IGR J175442619 was observed three times by XMM-Newton. The first two observations (2003 March 17 and September 11) were part of a program to study the nova V4643 Sgr (see also González-Riestra et al. gr:03 (2003)), and the third was a Target of Opportunity observation triggered by the INTEGRAL discovery. Here, we present results from all three XMM-Newton observations.
The XMM-Newton Observatory (Jansen et al. j:01 (2001)) includes three 1500 cm2 X-ray telescopes each with an European Photon Imaging Camera (EPIC) at the focus. Reflection Grating Spectrometers (RGS, den Herder et al. dh:01 (2001)) are located behind two of the telescopes. In addition, a coaligned optical/UV Monitor (OM, Mason et al. m:01 (2001)) is included. Two of the EPIC imaging spectrometers use MOS CCDs (Turner et al. t:01 (2001)) and one uses a pn CCD (Strüder et al. s:01 (2001)).
2 Observations and Data Reduction
Table 1 gives observing times, exposures and instrument modes. In the first two observations the three EPIC detectors were operated in the Full Frame mode, while during the third observation the pn and the MOS1 were operated in Timing Mode. In this mode, data are collapsed into a one dimensional row to be read at high speed with the second dimension being replaced by timing information. This allows time resolutions of 1.5 ms and 0.03 ms for the MOS and pn, respectively. Except for the 2003 March MOS2 observation, performed with the medium filter, the EPIC thin filters were used throughout.
EPIC data were processed with the standard XMM-Newton SAS tasks ’epchain’ and ’emchain’. For the pn and MOS imaging data, source counts were extracted from circular regions of 40′′ radius centered on IGR J175442619. Background counts were obtained from a similar region offset from the source position for pn, and from an annulus around the source for MOS2. Spectra were extracted separately for single, double and single+double events. For timing data, the source spectra were extracted from columns centered on the source position, and the background spectra from offset columns at both sides of the source.


The XMM-Newton OM (Optical Monitor) was operated in imaging mode during the three observations (see also Table 1). During the 2003 March observation IGR J175442619 was outside the OM field of view. The OM data were processed with the standard SAS task ’omichain’.
3 Results
3.1 Source Position
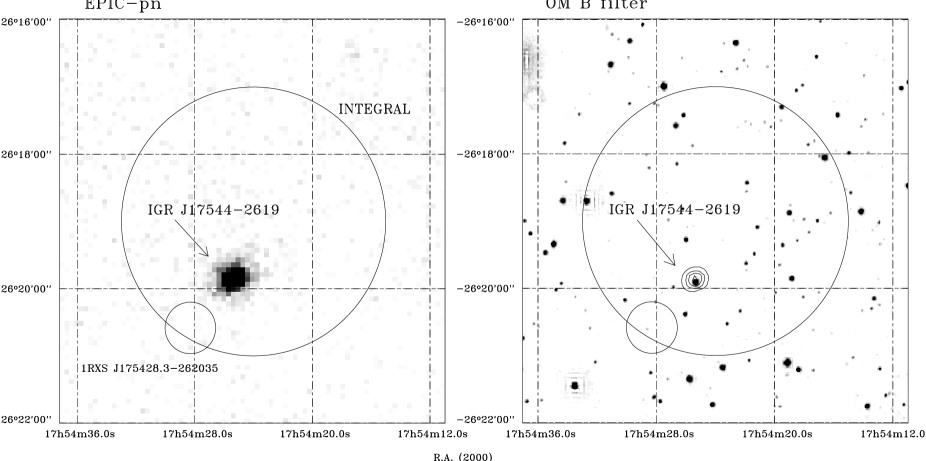
Unfortunately, during the 2003 September 11 observation IGR J175442619 was in one of the gaps between the MOS CCDs. In the September 17 observation the MOS2 data suffer slightly from the effects of pile-up. The pn data of 2003 September 11, therefore, provide the best estimate of the (J2000) source position of R.A. =17h 54m 2537 Decl. =26o 19′ 529, with a 90% confidence uncertainty radius of 4′′. This position improves on that presented in Gonzalez-Riestra et al. (2003), which was based on a preliminary estimate of the spacecraft attitude and clearly excludes 1RXS J175428.3-2620 (Wijnands 2003). Fig. 1 shows the EPIC-pn and OM B filter images with the 2′ INTEGRAL uncertainty region of Sunyaev et al. (2003) superposed.
Examination of the September 11 OM data reveals that there is a source close to the edge of the refined EPIC pn uncertainty region (see Fig. 1) with a B magnitude of 14.570.02. This is almost certainly the USNO B1.0 catalog source (2MASS J175425272619526) discussed in Rodriguez et al. (2003a ). The OM source is 3′′ from the EPIC pn best source position. There is a similar offset (4′′) between the OM and the EPIC pn coordinates of V4643 Sgr. Once a correction for this offset is made, the difference between the EPIC pn coordinates and those of the optical star inside the error circle is only 12. The same target is present in the ultraviolet image with a UVW1 magnitude of 16.130.04, and in the UVW2 image of September 17 with UVW2=14.490.02. The source is not detected in the UVM2 image.
In the 2003 March observation only X-ray upper limits to the intensity of a source at the position of IGR J175442619 are obtained. The 0.5–10 keV pn 3 upper limit of 0.008 count s-1 corresponds to a flux of 510-14 erg cm-2 s-1 for a power-law spectrum with a photon index, , of 2.0 and an of 1.41022 atom cm-2 (the interstellar value in the direction of IGR J175442619; Dickey & Lockman d:90 (1990)).

3.2 X-ray light curves
The 0.5–10 keV IGR J175442619 light curves and hardness ratios (counts in the energy range 2–10 keV divided by those between 0.5–2 keV) from both September observations are shown in Fig. 2. Since for the September 17 observation pn data are available only after 19:15 UTC due to technical problems, we show here the MOS1 data. In order to compare the two light curves, it is worth noting that during this overlapping interval 1 MOS1 count s-1 corresponds to 3.5 pn count s-1.
During the September 11 observation the 0.5–10 keV pn count rate increased from 0.06 s-1 to 3 s-1 in about 500 s. A short (100 s) flare occurred at 20:25 UTC when the count rate reached its maximum of 4 s-1. The count rate then decreased by a factor 10 and remained around 0.4 s-1 for the rest of the observation. In general, changes in intensity were accompanied by changes in the hardness ratio. IGR J175442619 was much brighter during the September 17 observation with the underlying MOS1 count rate decreasing from 2 s-1 to 0.5 s-1 with a number of flares up to 7.5 s-1 superposed (see Fig. 3). The peak MOS1 count rate of 7.5 s-1 corresponds to 25 pn s-1, approximately a factor 6 higher than during the September 11 observation.
Power-density spectra of the September data reveal power-law shaped noise components, consistent with flaring on various time scales, with no obvious signatures such as pulsations or quasi-periodic oscillations.
3.3 X-ray Spectra
All extracted spectra were rebinned to oversample the full width half maximum of the energy resolution by a factor 3 and to have additionally a minimum of 20 counts per bin to allow use of the statistic. In order to account for calibration uncertainties a 2% error was added quadratically to each spectral bin. Spectral uncertainties are given at 90% confidence.
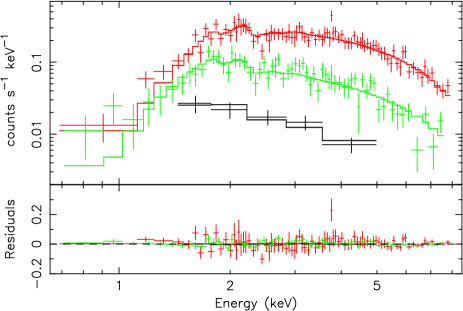
Initially, simple absorbed spectral models were fit to the 0.5–10 keV September pn spectra integrated over each observation. For the September 11 spectrum, a power-law with and atom cm-2 gives a of 151.9 for 142 degrees of freedom (d.o.f.), a thermal bremsstrahlung with keV and atom cm-2 gives a /d.o.f. of 143.1/142 and blackbody with keV and atom cm-2 gives a /d.o.f. of 141.0/142. Since all the models describe the spectra with comparable goodness of fit, we cannot reliably distinguish between these simple spectral models. We therefore use the results from the power-law fit to estimate a mean 0.5–10 keV unabsorbed flux of 1.510-11 erg cm-2 s-1. The September 17 spectrum can be represented by a power-law model with and atom cm-2 to give a /d.o.f. of 283.8/215. The mean 0.5–10 keV unabsorbed flux is 7.510-11 erg cm-2 s-1. Examination of the residuals indicates that the spectrum is not well fit 1 keV, which may indicate that there were variations in . This spectrum is significantly harder than that of September 11.
| Spectrum | /d.o.f | 0.5-10 keV flux | ||
|---|---|---|---|---|
| (1022 atom cm-2) | (erg cm-2 s-1) | |||
| Sep 11 (pre flare) | 1.90.5 | 8.810-13 | ||
| Sep 11 (flare) | 4.30.2 | 2.200.09 | 151.6/151 | 4.010-11 |
| Sep 11 (post flare) | 3.10.3 | 9.710-12 | ||
| Sep 11 (all) | 3.80.4 | 2.250.15 | 151.9/142 | 1.510-11 |
| Sep 17 (high) | 2.00.2 | 1.430.09 | 430.3/347 | 3.910-11 |
| Sep 17 (low) | 2.70.2 | 1.110-10 | ||
| Sep 17 (all) | 2.50.2 | 1.420.09 | 283.8/215 | 7.510-11 |
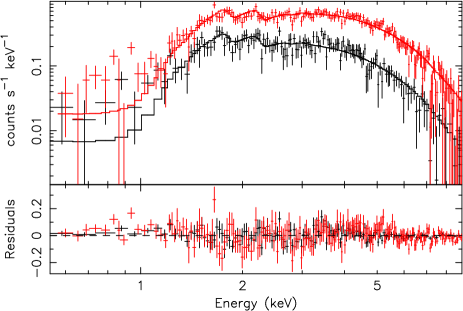
Next, the spectral changes during the 2003 September 11 observation were investigated. Three pn spectra were extracted corresponding to the pre-flare (until 2003 September 11 20:02 UTC), flare (September 11 20:02 to 20:40 UTC), and post-flare (after September 11 20:40 UTC) intervals. Background spectra were obtained simultaneously with the source spectra, since significant variations in the background count rate during the observation are present. The absorbed power-law model was used and the 3 spectra were fit simultaneously. First the value of was constrained to be the same for all 3 spectra and the power-law normalisation, , and allowed to vary independently. This gives an acceptable fit with a /d.o.f. of 151.6/151. The best-fit value of is and increases from atom cm-2 to atom cm-2. The pre-flare is consistent with the interstellar value in the direction of IGR J175442619 of atom cm-2 (Dickey & Lockman d:90 (1990)). However, it is also possible to obtain a fit of similar quality if instead is allowed to be different for the 3 spectra. Thus, it is not possible to draw any firm conclusions on the nature of the spectral changes during the observation, other than to say that they are consistent with either a changing or .
In order to investigate whether similar variability was present during the 2003 September 17 observation the MOS1 data were subdivided in two intensity selected intervals above and below 2.5 count s-1 and spectra extracted. MOS1 data were used due to the significantly longer exposure compared to the pn. The 0.5–10 keV intensities were 3.910-11 erg cm-2 s-1 and 1.110-10 erg cm-2 s-1. The spectra were again fit together allowing either or to vary (together with the normalisation). Again, it is not possible to draw any firm conclusions since the variations are consistent with both a changing or . With constrained to be the same, the best-fit value of is and varies from atom cm-2 to atom cm-2 for a /d.o.f. of 430.3/347. We note that the fit to the high-intensity spectrum is worse than to the low-intensity spectrum. This may be caused by larger spectral variations at high count rate. A summary of the fits to the different spectra is given in Table LABEL:tab:fit.
4 Discussion
The mean 0.5–10 keV unabsorbed luminosity of IGR J175442619 during the 2003 September 11 and 17 observations is 1.11035 erg s-1 and 5.71035 erg s-1 for an (assumed) distance of 8 kpc. The peak reached during the flare on 2003 September 17 is about 8.51035 erg s-1 Such luminosities are only reached in systems where the compact object is a neutron star or black hole. The state observed in 2003 March corresponds to an 0.5–10 keV luminosity of 41032 erg s-1. This upper limit is consistent with the luminosities observed for quiescent X-ray binary transients containing either a neutron star (e.g., Campana & Stella cs:03 (2003)) or a black hole (e.g., Tomsick et al. t:03 (2003)). The total dynamic flux range (quiescence to peak flaring) seen during the three XMM-Newton observations is a factor 2000. This is also typical for such transient X-ray binaries.
The (maximum) observed fluxes from the INTEGRAL observations (Sunyaev et al. s:03 (2003)) may constrain the spectral model in the soft and hard X-ray bands, as well as the level of X-ray activity. Given the quoted fluxes, and assuming that the hard X-ray spectrum consists of a single power-law, the photon index was 4 during the INTEGRAL observations. Assuming the interstellar , this would give an extrapolated absorbed 0.5–10 keV flux of 6.4 Crab. If during the INTEGRAL observations the spectral index was 2.2, as measured in the 0.5–10 keV energy range on 2003 September 11, a high-energy cut-off at 14 keV is required in the spectrum in order to explain the (maximum) 18–25 keV and 25–60 keV fluxes and the 50–100 keV flux upper limit. Extrapolating this spectrum gives an absorbed flux of 0.45 Crab (0.5–10 keV). Note that this value would correspond to an unabsorbed luminosity of about 31038 erg s-1 (at 8 kpc), similar to that reached by classical X-ray binary transients (e.g., Chen et al. 1997). Unfortunately, there are no closeby (i.e., within hours) RXTE All-Sky Monitor (ASM) measurements of IGR J175442619 (R. Remillard, private communication), to verify whether the source was active around the time of the INTEGRAL observations. The RXTE/ASM measurements within days of the INTEGRAL detections give typical upper limits of 50 mCrab. But since the source is highly variable in both soft and hard X-rays, these do not provide stringent constraints either.
We note that the quiescent state and the low-level flaring seen with XMM-Newton and the high-level activity seen by INTEGRAL is reminiscent of SAX J1819.32525 (V4641 Sgr). This system also shows low-level activity around 1036 erg s-1 (in ’t Zand et al. 2000), strong and short high-level activity (e.g., Revnivtsev et al. re:02 (2002)), while in quiescence it reaches 41031 erg s-1 (0.3–8 keV; Tomsick et al. t:03 (2003)). The compact object in SAX J1819.32525 is most probably a black hole (Orosz et al. o:01 (2001)).
Our observed OM magnitudes, combined with the optical/infrared magnitudes reported by Rodriguez et al. (2003a ), and assuming an absorption of 2 atom cm-2 and a distance of 8 kpc, are consistent with an early O-type companion. However, a foreground object cannot be ruled out; we note the possible presence of fainter optical candidates in the XMM-Newton error circle (Rodriguez et al. 2003a ).
Future observations will hopefully shed more light on IGR J175442619. In particular, monitoring campaigns by INTEGRAL and multi-wavelength observations may allow the nature of the compact object to be elucidated.
Acknowledgements.
Based on observations obtained with XMM-Newton, an ESA science mission with instruments and contributions directly funded by ESA member states and the USA (NASA).References
- (1) Campana, S., Stella, L. 2003, in Proc. of the II BeppoSAX Meeting: ”The Restless High-Energy Universe”, E. P. J. van den Heuvel, J. J. M. in ’t Zand, & R. A. M. J. Wijers (eds.), Nucl. Physics B. Suppl. Ser., Elsevier [astro-ph/0309811]
- (2) Chen, W., Shrader, C. R., Livio, M. 1997, ApJ, 491, 312
- (3) den Herder, J. W., Brinkmann, A. C., Kahn, S. M., et al. 2001, A&A, 365, L7
- (4) Dickey, J. M., & Lockman, F. J. 1990, ARA&A, 28, 215
- (5) González-Riestra, R., Santos-Lleó, M., & Pérez-Martínez, R. 2003, IAU Circ., 8202
- (6) Grebenev, S. A., & Lutovinov, A. A. 2003, ATel, 192
- (7) in ’t Zand, J. J. M., Kuulkers, E., Bazzano, A., et al. 2001, A&A, 357, 520
- (8) Jansen, F., Lumb, D., Altieri, B., et al. 2001, A&A, 365, L1
- (9) Lebrun, F., Leray, J. P., Lavocat, P., et al. 2003, A&A, 411, L141
- (10) Mason, K. O., Breeveld, A., Much, R., et al. 2001, A&A, 365, L36
- (11) Matt, G., & Guainazzi, M. 2003, MNRAS, 341, L13
- (12) Orosz, J. A., Kuulkers, E., van der Klis, M., et al. 2001, ApJ, 555, 489
- (13) Patel, S. K., Kouveliotou, C., Tennant, A., et al. 2003, ApJ, submitted
- (14) Revnivtsev, M., Gilfanov, M., Churazov, E., & Sunyaev, R. 2002, A&A, 391, 1013
- (15) Revnivtsev, M., Sazonov, S., Gilfanov, M., & Sunyaev, R. 2003, AstL, 29, 587
- (16) Rodriguez, J., Foschini, L., Courvoiser, T., & Hannikainen, D. 2003a, ATel, 194
- (17) Rodriguez, J., Tomsick, J. A., Forschini, L., et al. 2003b, A&A, 407, L41
- (18) Strüder, L., Briel, U., Dennerl, K., et al. 2001, A&A, 365, L18
- (19) Sunyaev, R., Grebenev, S. A., Lutovinov, A. A., et al. 2003, ATel, 190
- (20) Tomsick, J. A., Corbel, S., Fender, R., et al. 2003, ApJ, 597, L133
- (21) Turner, M. J. L., Abbey, A., Arnaud, M., et al. 2001, A&A, 365, L27
- (22) Walter, R., Rodriguez, J., Foschini, L., et al. 2003, A&A, 411, L427
- (23) Wijnands, R. 2003, ATel, 191
- (24) Winkler, C., Courvoisier, T. J.-L., Di Cocco, G., et al. 2003, A&A, 411, L1