Normal Galaxies
INES Guide No. 2
International Ultraviolet Explorer IUE Newly
Extracted Spectra
Abstract
This guide presents, in a uniform manner, all the information collected by the IUE satellite on normal galaxies. It contains information on 274 galaxies and it supersedes the previous IUE guide to normal galaxies (Longo & Capaccioli 1992). The data shown here are restricted to galaxies defined as “normal” by the observer, and entered as such in the IUE data file header. The information is also restricted to low-dispersion spectra obtained through the large apertures of IUE. For the first time, we provide spectral information from well-defined and identifiable locations in the target galaxies. These are mostly located close to the photocenter of each object, although there are few exceptions. Each representative spectrum of a galaxy consists of a short-wave (SW) and a long-wave (LW) IUE low-dispersion spectrum (where available) combined into a single spectrum covering the wavelength range 1150Å to 3350Å . We selected the two spectra to be combined so as to be, preferably, the deepest exposures available in the INES archive. Each representative spectrum is accompanied by two images of the galaxy, on which the locations of the SW entrance aperture and the LW entrance aperture are marked.
1 Foreword: The INES Access Guides
The International Ultraviolet Explorer (IUE) Satellite project was a joint effort between NASA, ESA and the PPARC. The IUE spacecraft and instruments were operated in a Guest Observer mode to allow ultraviolet spectrophotometry at two resolutions in the wavelength range from 1150Å to 3200Å : low resolution =300 (1,000 km/sec.) and a high resolution mode =10,000 (19 km/sec.). The IUE spacecraft, its scientific instruments as well as the data acquisition and reduction procedures, have been described in “Exploring the Universe with the IUE Satellite”, Part I, Part VI and Part VII (Astrophysics and Space Sciences Library volume 129, Y. Kondo, Editor-in-Chief, Kluwer Acad. Publ. Co.) and references therein. A more recent overview of the IUE project is given in the conference proceedings of the last IUE conference “Ultraviolet Astrophysics beyond the IUE Final Archive” (ESA SP-413, 1998, Eds. W.Wamsteker and R. Gonzalez Riestra) and in “IUE Spacecraft Operations Final Report” (ESA SP-1215, 1997, A. Perez Calpena & J.Pepoy). Additional information on the IUE project can also be found at URL: http://www.vilspa.esa.es/iue/iue.html.
From the very beginning of the project (launched on 26 January 1978), it was expected that the archival value of the data obtained with IUE would be very high. This expectation has been borne out fully after 18.6 years of orbital operations (on 30 September 1996 the science operations with the IUE spacecraft were stopped). The average IUE Archive data retrieval rate, during the operational phase of the project, has been some 61,000 spectra per year. This compares to a new data access rate of 5,500 spectra per year. Considering that the demand for observing time continued to exceed the available time by a factor of three until the end of science operations, it is clear that the IUE Archive remains an important source of data. The IUE ULDA/USSP (Uniform Low Dispersion Archive/ULDA Support Software Package) was developed by ESA in the mid-eighties (Wamsteker et al., 1989, Astron. & Astrophys. Suppl. Ser., 79, pg. 1-10) as the first astronomical archive with direct access for users on a world-wide basis. Over the ten years that the ULDA has been supporting IUE data retrieval, it has driven more than 50% of all IUE Archive usage. The quantity of data in the IUE Archive is sufficiently large that it is not necessarily simple to address the data efficiently in the context of an astrophysical problem, even though access to the data is extremely easy. Therefore, the series of INES Access Guides is intended to facilitate the use of the IUE Archive for scientists with a specific astrophysical problem in mind.
The extremely good reception of the distributed archive model by the scientific community has led to the decision to develop the Final Archive server with a similar philosophy, in the form of INES (IUE Newly Extracted Spectra). The INES system is a complete system design, with
-
•
improvements to the data
-
•
a structure to facilitate the direct application to scientific analysis, and
-
•
an integrated and distributed data retrieval system.
Detailed information on the INES System and its data content has been published in a series of papers “The INES System”. The specific references are: Rodriguez-Pascual et al. 1999, Astron. & Astrophys. Suppl. Ser., 139, pg.183-198; Cassatella et al. 2000, Astron. & Astrophys. Suppl. Ser., 141, pg.331-342; Gonzalez-Riestra et al. 2000 Astron. & Astrophys. Suppl. Ser, 141, pg.343-356; Wamsteker et al. 2000, Astroph. & Space Sci., in press. The INES Users Guide, also collecting these publications, has been published by ESA Publications Division in the INES Newsletter (March 2000).
At the time of this writing 19 National Hosts have functional installations of the INES system Version 2.0 (see below), giving to the end user, direct access to all 104,000 IUE spectra, with the Principal Center (LAEFF) at URL http://ines.vilspa.esa.es/ines/ and its Mirror Site for North America at the Canadian Astronomy Data Centre (CADC) http://ines.hia.nrc.ca in Victoria. The ESA involvement in the IUE Project activities will come to an end in 2000, and, from that moment onward, the INES system will become a part of the astronomical heritage of the IUE project. More National Hosts are forseen to come on-line in the future. The series of INES Access Guides is forseen to continue and consists of a number of subject-oriented books, for which a specialist in the field has been invited to take the scientific responsibility. INES Access Guide No. 2 treats the data for Normal Galaxies and has been compiled by Liliana Formiggini and Noah Brosch of the Wise Observatory and the School of Physics and Astronomy, Tel Aviv University. This volume supersedes the ULDA Guide No. 3. Further volumes of INES Access Guides will be published whenever the necessary data compilation has been completed by the authors. The list of previously published ULDA & INES Access Guides is given below, as well as the INES Guides currently in preparation. For details of the access to INES through the National Hosts we refer to the information supplied at http://ines.vilspa.esa.es/ines/, or recommend contacting the INES Helpdesk at LAEFF at VILSPA, Madrid, Spain ineshelp@iuearc.vilspa.esa.es. Other queries about the data or any specific questions about data content in relation to the INES system should also be directed there or to the National Host Institutes.
Willem Wamsteker
1.1 Previously issued IUE-ULDA Access Guides:
-
No. 1 ESA SP-1114 C. la Dous Dwarf Novae and Nova-like Stars.
-
No. 2 ESA SP-1134 M. Festou Comets.
-
No. 3 ESA SP-1146 G. Longo, M. Capaccioli Normal Galaxies.
-
No. 4 ESA SP-1153 (Vol. A & B) T.J.-L. Courvoisier, S. Paltani Active Galactic Nuclei.
-
No. 5 ESA SP-1181 (Vol. I & II) C. la Dous, A. Gimenez Chromospherically Active Binary Stars.
-
No. 6 ESA SP-1189 E. Cappellaro, M. Turatto, J. Fernley Supernovae
-
No. 7 ESA SP-1203 M. Franchini, C. Morossi, M.L. Malagnini K Stars
-
No. 8 ESA SP-1205 A.I. Gomez de Castro, M. Franqueira T Tauri Stars
1.2 INES Guides:
-
No. 1 ESA SP-1237 A.I. Gomez de Castro, A. Robles Herbig-Haro Objects
-
No. 2 ESA SP-1239 L. Formiggini, N. Brosch Normal Galaxies supersedes ULDA Guide No.3
1.3 INES Guides in preparation:
-
No. 3 A. Niedzielski Wolf-Rayet Stars
-
No. 4 M. Festou Comets Supersedes ULDA Guide # 2
-
No. 5 A. Cassatella & R. Gonzalez-Riestra Novae
1.4 INES National Hosts (as of 18 February 2000):
| Country | Institution |
|---|---|
| Argentina | Facultad de Ciencias Astronomicas y Geofisicas, |
| Buenos Aires | |
| Austria | Kuffner Observatory, Vienna |
| Belgium | Royal Observatory of Belgium, Ukkel |
| Brazil | Instituto Astronomico e Geofisico, Sao Paulo |
| Canada | Canadian Astronomy Data Center, Victoria |
| (Principal Centre Mirror Site) | |
| China | Center for Astrophysics, |
| Hefei (local access only) | |
| ESO | European Southern Observatory, Garching |
| (local access only) | |
| Israel | Wise Observatory, Tel Aviv University, Tel Aviv |
| France | Centre de Donees Astronomiques, Strasbourg |
| Italy | Astronomical Observatory, Trieste |
| Japan | National Astronomical Observatory, Tokyo |
| Korea | Chungbuk National University, Cheongju |
| The Netherlands | Astronomical Institute, Utrecht |
| Poland | Center for Astronomy, Torun |
| Russia | Institute of Astronomy of the Russian Academy of |
| Sciences, Moscow | |
| Spain | LAEFF, Madrid (Principal Centre) |
| Sweden | Astronomical Observatory Uppsala |
| (serving the Nordic Countries) | |
| Taiwan | Institute of Physics and Astronomy, Chung-Li |
| United Kingdom | Rutherford Appleton Laboratory, Didcot |
| United States | Space Telescope Science Institute, Baltimore |
2 Introduction
One of the greatest successes ever of any orbiting astronomical instrument lies with the IUE (International Ultraviolet Explorer) observatory. Launched on 26 January 1978 for a nominal three-year mission, the observatory operated for 18.7 years yielding more than 110,000 spectra of nearly 10,000 diverse astronomical targets. IUE operations closed down on 30 September 1996. The International Ultraviolet Explorer satellite was a joint project between NASA, ESA and PPARC (formerly SERC in UK). This was a trilateral project, in which NASA provided the spacecraft, telescope, spectrographs and one ground station, ESA the solar panels and the second ground station, and the UK supplied the four spectrograph detectors. In addition to controlling the satellite, the ground stations acted as typical astronomical observatories, except that the telescope was in a high orbit around the Earth. ESA’s IUE Observatory was established in 1977 at the Villafranca del Castillo Satellite Tracking Station (VILSPA), Villanueva de la Cañada, Madrid, Spain. The NASA IUE Observatory was located in the Goddard Space Flight Centre (GSFC), in Greenbelt, MD.
The experiment consisted of a 45-cm diameter f/15 Ritchey-Chrétien Cassegrain telescope with an image quality of two arcsec feeding two alternative spectrometers, one for the range 1150-1980Å (short-wave=SW) and the other for 1800-3350Å (long-wave=LW). Two different dispersions were available, low (R=270 at 1500Å and 400 at 2700Å ) and high (R=1.8 104 at 1400Å and 1.3 104 at 2600Å , using an echelle arrangement). The echelle observations used 3 arcsec circular apertures; the low dispersion observations used mainly the oval apertures with dimensions 10”20”. Each of the two spectrographs was equipped with two cameras, a prime one (P) and a redundant one (R). The sensitivity of IUE, for low dispersion operations, was as follows:
| Camera (spectral range) | Sensitivity |
|---|---|
| SWP (1150Å -1980Å ) | 2 10-15 erg s-1 cm-2 Å -1 |
| LWP (1850Å -3350Å ) | 1 10-15 erg s-1 cm-2 Å -1 |
| LWR (1850Å -3350Å ) | 2 10-15 erg s-1 cm-2 Å -1 |
| SWR | Never operational |
In addition, two Fine Error Sensors (FES) were incorporated. These transmitted an optical video image of the sky area around the target reflected off of the focal plane, to the controlling ground station. FES-1 was never used in operations. FES-2 was always used for fine guidance throughout the mission. It has also been important as a photometer to measure the optical brightness of the observed sources. In 1991, scattered light entering the telescope required a revision of the guidance procedures and affected the photometric performance of the FES.
The only serious problems encountered with IUE during its operation stemmed from the failures of five of the six gyroscopes in its attitude control system (in the years 1979, 1982, 1982, 1985, and 1996). When the fourth gyroscope failed, IUE continued operations thanks to an innovative reworking of its attitude control system by using the fine sun sensor as a gyro substitute. Even with another gyroscope lost in the last year of operation, IUE could still be stabilized in three-axes with a single gyroscope, by adding star-tracker measurements. During the unexpectedly long operation period of IUE, its NASA operators at GSFC and ESA personnel at VILSPA devised work-around methods to operate, despite unexpectedly high levels of stray light, when a piece of thermal blanket or reflecting tape fluttered in front of the telescope aperture in 1991.
Until October 1995, IUE was in continuous operation, controlled for 16 hours daily from GSFC and for the remaining eight hours from VILSPA. After that, ESA took on a major role to alleviate financial problems of the partners. The operational schemes were completely redesigned and an innovative control system was implemented. With these innovations, it became feasible to perform science operations controlled only from VILSPA. For practical reasons, only 16 hours were used for scientific operations, while the eight hours in the low-quality (high radiation background) part of the orbit were used for spacecraft housekeeping. In February 1996, ESA decided to discontinue the satellite operations. IUE remained operational until 30 September 1996, when its remaining hydrazine fuel was deliberately vented, its batteries were drained, and its transmitter was turned off.
2.1 The archive
The stability of the IUE instrument, and the care taken to ensure a proper calibration throughout the mission, make the IUE database a very valuable archival resource for specific investigations in the domain of astronomical ultraviolet spectroscopy.
The IUE Uniform Low-Dispersion Archive (ULDA) was the first attempt to put the results of IUE at the disposition of the astronomical community in an orderly manner. Version 3.0 of the ULDA was released in September 1990 and contained 98.7% of all the low-resolution spectra obtained by IUE before January 1, 1989 (44,000 spectra). The ULDA was installed at a number of national hosts and was made available to general users from these hosts.
The lasting value of the IUE archive became even more evident after the final reprocessing of all the low-dispersion spectra into the final IUE Newly Extracted Spectral Archive (INES) was completed. The reprocessing was done using improved extraction techniques and calibrations (NEWSIPS: Nichols et al. 1993). The IUE Final Archive, another collaborative effort by NASA, ESA, and PPARC, was identified during the final phase of the mission as a necessary step in the production of a high-quality and uniform data base. This archive was seen as the final repository of the information collected by IUE, produced at a stage when specialized knowledge of the instrument and of its calibration procedures were still available. The final archive will be maintained accessible to the scientific community as the historical reference of the IUE mission and as a source of information for future studies based on IUE UV spectra. It is a special tribute to the leadership of the IUE project that most of the final archive production was done while the satellite was still in operation.
The final version of the IUE archive contains 104,471 spectra reprocessed with the most up-to-date calibration and includes high-resolution echelle spectra binned to the resolution of the low dispersion observations. The low-resolution version of the IUE archive has been installed at the ESA/INTA INES Primary Center at VILSPA/LAEFF and at 19 national or institutional hosts (as of 18 February 2000).
2.2 Information content
Although the IUE data set does not represent a uniform survey of the sky, the large variety of objects observed by it offers unique opportunities to derive “average” properties of celestial populations. This has been used by many (e.g. Fanelli et al. 1987) to derive UV-to-optical color indices for various stellar spectral types and luminosity classes. These are later used to derive transformations, to create models of the UV sky (Brosch 1991), or to determine the level of the diffuse UV background. Observations of galaxies were used to determine average UV spectra of irregular, spiral, and elliptical galaxies, and of galactic bulges (Ellis et al. 1982, Burstein et al. 1988, Kinney et al. 1993, Storchi-Bergmann et al. 1994), important for the derivation of cosmological k-corrections, and for analyzing observed properties of high-redshift clusters of galaxies (Steindling et al. 2000).
To help the logical usage of the information collected by IUE, atlases of UV spectra of selected types of objects, based on IUE data were published (i.e. Longo & Capaccioli 1992 for normal galaxies, or Courvoisier & Paltani 1992 for active galaxies). Apart from these special-purpose atlases, note those dedicated to the classification of stars from their UV spectra published by ESA and by NASA (Heck et al. 1984; Wu et al. 1991).
2.3 Galaxies in the IUE data set
The ULDA Access Guide No. 3 (Longo & Capaccioli 1992) included spectra obtained up to the 31st of December 1991. The availability of the IUE Final Archive, and of INES, along with the additional information collected until the cessation of IUE observations on 30 September 1996, were the reasons to compile a new collection of UV spectra of normal galaxies, obtained by the IUE Observatory. This collection is presented in this publication. We believe that its compilation will further enhance the lasting value of the IUE observations.
3 UV radiation from galaxies
Far UV radiation from galaxies was detected in the late sixties by space satellites such as the OAO-2 and later the TD-1. It was the advent of the IUE however, that provided a large number of spectra for many galaxies, of different morphological types, that confirmed and greatly expanded the earlier UV data. Attempts to explain the UV emission from galaxies led to a flourishing of modeling work and to new views on star formation and chemical evolution. In spite of the enormous contribution of the IUE experiment, the information about UV emission from galaxies is very sparse and the astronomical community still lacks a large sample of a few thousand galaxies with good UV information, from which to perform adequate statistical studies. This information is very important in order to understand evolution in the Universe.
Significant information on selected objects, mainly on stellar populations and the nature of the ISM, was obtained from the early IUE spectra (O’Connell 1992). Similar observational data, combining UV with optical and near-IR spectrophotometry through matched apertures, were used to derive template spectral energy distributions (SEDs) for various types of galaxies (Storchi-Bergmann et al. 1994; McQuade et al. 1995). A combination of IUE observations and data from other UV imaging missions was used to extract “total” UV information on galaxies (Longo et al. 1991; Rifatto et al. 1995a, 1995b). Some of the latter information was included in the ULDA Guide to Normal Galaxies (Longo & Capaccioli 1992) and in a comparison of galaxy properties in the UV using synthetic photometry from the IUE spectra in seven photometric bands, five of which matched the ANS bands (Longo et al. 1991).
There is hope to derive the star-forming histories of galaxies through a combination of data from the UV to the near-IR, in the manner of the Storchi-Bergmann et al. (1994; SB2) templates. The significant UV data collected by IUE from normal galaxies is usually at 1400Å , except for the very young starburst galaxies and for some ellipticals. This spectral region, in late-type galaxies, contains mainly radiation from A-type stars and requires extrapolation of the stellar population to earlier types in order to account for Lyman continuum photons. The flux below 1400Å , observed in starburst galaxies, originates from stars earlier than type A, mainly B stars, although sometimes a contribution by field O-stars cannot be ruled out (Brosch et al. 1999). Some elliptical galaxies exhibit upturns of their spectral energy distributions below 2000Å (Burstein et al. 1988; Bonatto et al. 1996; O’Connell 1999). These are presumably produced by low-mass, helium-burning stars on the extreme horizontal-branch and in later stages of evolution.
It is impractical to rely only on the detailed modeling of spectral features in the optical region in order to understand large populations of galaxies in terms of stellar populations and star-formation histories. One should combine information from many spectral bands, covering as wide a spectral region as possible. In the absence of very deep UV surveys in more than a single spectral band, such as those expected to result from the GALEX all-sky two-band UV survey (Bianchi & Martin 1997), our information about significant numbers of galaxies measured in the UV originates from the SCAP-2000 (Donas et al. 1987), FOCA (Milliard et al. 1992), and FAUST (Deharveng et al. 1994; Bowyer et al. 1995; Brosch et al. 1995, 1997, 1999, et seq.) measurements. These consist of integrated photometry at 1650Å or 2000Å of a few hundred galaxies. UV spectral information for about two dozen galaxies was also obtained by the ASTRON observatory (Boyarchuk 1994). In the 2000Å band, and in the UV brightness range 16.5-18.5, galaxies apparently dominate the source counts (Milliard et al. 1992). The corresponding blue magnitudes of these galaxies are B=18–20 mag. and their typical color index is 1.5. Comparing this color index with the template spectra of Kinney et al. (1996), the FOCA-detected galaxies seem to fit the SB2 template, i.e., a slightly reddened starburst galaxy. The claim by the FOCA group of a large contribution of UV galaxies in deep-UV sky observations is supported by theoretical arguments requiring a fast-evolving population of perhaps dwarf galaxies for z=0.2-1.0, in order to explain the faint source counts in other spectral domains (Ellis 1997).
4 The INES data
The data sets provided by INES consist of low-resolution spectra extracted with an improved method from the line-by-line images of the IUE Final Archive, and of high-resolution spectra resampled to the low-resolution wavelength step. The new extraction of the low-resolution spectra includes:
-
1.
A better noise model (Schartel & Rodriguez-Pascual 1998).
-
2.
A better spectral extraction procedure, resulting in improved extraction of spectra with lines and in a more adequate background estimation (Rodriguez-Pascual et al. 1998).
-
3.
A better propagation of the quality flags, with a larger number of pixels flagged and more correct information about potential problems.
-
4.
A homogenized wavelength scale for the LW cameras.
-
5.
A major improvement in removing the contribution of stray light into the LWP camera in images obtained after 1991.
-
6.
A revision of the flux density scale.
Another important aspect of INES vs. ULDA is the presentation of spectra in standard FITS format; this implies that the spectra can easily be manipulated by the standard image-processing software packages in general use by the astronomical community.
The noise model used for the production of INES is derived empirically, from hundreds of flat-field images with different exposure times. This was required, given that the IUE detectors are television-type and are different in their behavior from CCD detectors. An improved noise model for the IUE spectra was a necessary first-step of an improved extraction procedure, because the determination of the spatial extent of the object spectrum in the cross-dispersion direction is based on the signal-to-noise (S/N) ratio along the entrance aperture. Also, the determination of the errors in the final extracted spectra is based on propagation of the errors from all the previous stages of the extraction.
The background determination for INES is performed by fits of Chebyshev polynomials across the IUE spectra external to the entrance aperture. The polynomial fit is assumed to be constant across the aperture. The extraction profile is determined by finding the extent of the spectrum through a spline fit along the spatial direction, for extents of S/N30 along the direction of the dispersion, and with a minimum of seven wavelength steps. In cases of weak spectra, where the S/N is below a certain threshold, the extraction is done by adding up all the flux within the entire aperture. In many instances relevant to galaxies, when the aperture is much larger than the dimensions of the target and the surface brightness is relatively low, this is the proper procedure.
The accuracy of INES flux extraction has been tested by Schartel & Skillen (1998) and was found that, in general, NEWSIPS and INES gave consistent results. The definite advantage of INES was demonstrated for spectra with strong and narrow emission lines, where INES gave consistently more reliable results.
In addition, the production of INES was done through a strict configuration control of all the re-processing stages. This resulted in improved quality control of the spectra and also of the information entered in the image headers. This included interactive verification of the input parameters against the hand-written observing logs, as well as automatic checks of the validity of values, correct sizes, and input formats of the raw images.
5 Selection of galaxies for inclusion in the present guide
The selection of objects to be included in this catalog is based primarily on the object classification included in the FITS header of the object spectrum in INES and partly on object selection from the INES archive. The IUE observing class is a two-digit code describing the observed target. In selecting the objects included here, we chose codes 80 (spiral galaxy), 81 (elliptical galaxy), 82 (irregular galaxy), and 88 (emission-line galaxy, non-Seyfert). Searches of the INES archive returned 370 objects corresponding to these definitions. Further consideration of additional data about these 370 objects, mainly collected from the NED333The NASA/IPAC Extragalactic Database (NED) is operated by the Jet Propulsion Laboratory, California Institute of Technology, under contract with the National Aeronautics and Space Administration. data base, indicated that some of them harbor active galactic nuclei (AGNs). These objects may not have been known as AGNs at the time of the IUE observations, or the Guest Observer (GO) did not identify the object as an AGN when the Resident Astronomer (RA) entered the necessary information in the exposure header. Such objects were deleted from the candidate list.
On the other hand, opposite cases of missed normal galaxies could exist. We did not search the more than 100,000 spectra on INES for objects classified by the GO, and entered by the RA in the image header, as anything but classes 80, 81, 82, or 88, which may be “normal galaxies” as defined here. These objects are, therefore, excluded from this guide.
Another reason for rejecting candidates selected as normal galaxies were a few cases where an object was identified as a normal galaxy, had a spectrum present in the archive, but the extracted spectrum contained essentially no flux. In other cases, the location of the IUE entrance aperture was patently off the object and sampled only clear sky, yielding a zero net-flux spectrum in INES. Such cases were not included in our compilation, but have a remark in the appropriate section of the comments.
The 274 galaxies included in the present guide are listed in Table 1. We present there the leading name of the galaxy as it appears in the homogeneous identification of IUE, its J2000 equatorial coordinates, its morphological type and its T-type, its total B magnitude, and (B–V) and (U–B) colors, as listed in the LEDA database.
6 Presentation of the guide data
Given the large number of normal galaxies in the sample, we decided to present for each object the most relevant information on a single page of this Guide. An individual page contains, therefore, the following information:
-
1.
A header with the name of the galaxy as given in INES, its J2000 celestial coordinates ( and ), and its Galactic coordinates (l and b).
-
2.
A list of alternative names for the galaxy culled from LEDA.
-
3.
General information about the object, collected from the LEDA data base: morphological T-type, morphological type, redshift, and logarithmic size parameters d25 and r25.
-
4.
Information about the two IUE spectra (SW and LW) presented on the page: image number, date when each spectrum was acquired, exposure of each spectrum in seconds, and position angle of the aperture’s major axis.
-
5.
Image numbers of at most ten additional IUE spectra of the object. These are selected by decreasing order of exposure time.
-
6.
A plot of the combined UV spectrum of the galaxy, from 1150Å to 3350Å . Note that the LW spectrum was, in some instances, scaled to match the long wavelength end of the SW spectrum, as explained below.
-
7.
Two images of the galaxy, extracted from the Digitized Sky Survey (DSS), with the overlaid outline of the IUE aperture relevant for the specific spectrum displayed here. The left image is always that of the SW aperture position and the right image is that of the LW.
The selection of spectra to be combined into the representative UV spectrum of the galaxy was done according to the following rules:
-
1.
Two spectra, one SW and another LW, with the longest exposures, were selected from INES.
-
2.
The positions of the two IUE entrance apertures, for the SW and LW spectra, were checked in the images with the aperture overlays. If the locations were very similar, the two spectra were retained and combined into the final representative spectrum. If not, INES was searched for a suitable pair of deep spectra conforming to the similar-location criterion.
-
3.
In a number of instances, only SW or only LW spectra were available. In these cases, the left or the right image of the galaxy, with the suitable aperture overlaid, is missing.
The two selected SW and LW spectra were then combined into a single representative UV spectrum of the object. Sometimes, the mean spectral energy density (SED) levels of the SW and LW spectra of the same object were very different from each other. A simple combination, e.g. by concatenation of the SW and LW spectra would then result in a step-like SED. This is clearly visible in some of the spectra displayed in the ULDA Access Guide No. 3 (Longo & Capaccioli 1992), e.g. A1223+4846.
To prevent such an occurence, we decided to bring the LW spectrum to the level of the SW so as to ensure a smooth linkage between the spectra. We averaged the flux density in a 50Å segment at the long wavelength end of the SW spectrum, and in a 50Å segment at the short wavelength end of the LW spectrum. The normalization constant was determined from these flux density averages. The difference between the two averages was added to the LW spectrum to bring it into smooth continuation of the SW spectrum, and is indicated on the spectral plot. This matching was not performed in cases when it would have driven any part of the LW spectrum to negative flux levels. Such cases can be noticed by the gap between the SW and LW spectra displayed on the relevant pages (e.g. IC1613). A marginal case, where the shift was from a spectrum at zero LW flux level, was for AOO ANON1244-53. In few a cases (e.g. NGC 1147) the LW spectrum seems contaminated by additional light between 1900 and 2200Å . In such cases, no flux-matching procedure was applied.
For some extended galaxies, much larger than the IUE entrance apertures, spectra were obtained at a number of physically different regions in the galaxy. When two spectra, one SW and the other LW, could be identified in the same location for such a region, one page was dedicated to the separate presentation of this information. Multiple pages are shown for the following galaxies: NGC 3034, NGC 3690, NGC 4449, NGC 4861, NGC 5236.
For some spectra, the aperture coordinates reported in the image header are incorrect and point to a region outside the target, while the spectra show a significant signal. For these spectra, a new aperture position was computed (Solano, E., private communication) based on the guide star position used by the Guest Observer. Table 2 lists the image number and the revised aperture position.
We emphasize here that the morphological type of an object included in this compilation is the one listed in LEDA. Perusing the contents of this INES Guide, we found that some objects with which we are familiar are obviously mis-classified in LEDA. Such an example is Mrk 49, an E galaxy in LEDA but which is really a compact, starbursting dwarf. It is possible that there are more such mis-classifications, but we have not attempted to sort them out. Along with the morphological type listed in Table 1, the numerical T-type associated with a galaxy should also change. We believe this change not to be significant when considering the statistical distribution of the normal galaxy population displayed here (cf., Figure 3).
7 Comparison with the ULDA Access Guide No. 3
The most important difference between the two guides is inherent in our catalog being a later compilation, including all galaxies observed by IUE that fulfill the selection criteria. The improved extraction procedures of INES resulted in much less noise in the spectrum of a galaxy, in comparison to the spectra presented by Longo & Capaccioli (1992). Furthermore, the method of combining the SW and LW spectra of one object is different; we tried to match the blue end of the LW to the “red” end of the SW by averaging regions of overlap and adding a constant to the LW spectrum, thus the spectra we present are, by definition, smoothly joined.
Longo & Capaccioli (1992) decided to correct the spectra they plotted in the ULDA Access Guide No. 3 for Galactic extinction. They used the Burstein & Heiles (1984) color excess and the Seaton (1979) average extinction curve. It is obvious today that the Galactic extinction is extremely patchy, even when using the improved extinction from Schlegel et al. (1998); we decided therefore not to correct the spectra for galactic extinction.
The present guide contains 274 objects, approximately twice the number of galaxies included in the ULDA guide of normal galaxies. Therefore, it offers a much wider sample of objects for comparison than the previous publication. On the other hand, the same problem that plagued the derivation of template UV spectra of galaxies by Storchi-Bergman et al. (1994) still remains; in many cases the IUE aperture samples only the innermost regions of galaxies.
8 The sample of normal galaxies
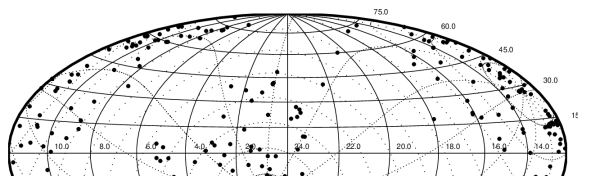
The catalog of normal galaxies here presented includes 274 galaxies distributed over the sky. The distribution is shown in Figure 1. This large collection of data, resulting from many individual research projects, does not constitute a homogeneous sample. The total B magnitude (Figure 2) spans a relative wide range (from 6 to 19 mag), with a mean value of 12.5 and a peak between 13-15 mag, confirming that very few faint galaxies were observed by IUE.

The sample contains galaxies of all the morphological types, from ellipticals to irregulars (Figure 3). The elliptical galaxies, some of which are intrinsically strong UV emitters due to the the UV-upturn phenomenon, represent about one-quarter of the total number of the galaxies in this sample. Figure 3 shows the distribution of galaxies as a function of the continuous T-type morphological parameter. The objects were binned according to their morphological classes: E, E-S0, S0, S0a, Sa, Sab, Sb, Sbc, Sc, Scd, Sd, Sm, Irr.

The distribution of galaxies with redshift is shown in Figure 4. It is clear that IUE observed normal galaxies only in the very nearby Universe.

Many of the galaxies observed by IUE are extended objects with respect to the large aperture of the spectrograh. The large IUE apertures are 10”20” and oval-like, each corresponding to the area of a circular diaphragm having a diameter of 15.1 arcsec (Longo & Capaccioli 1992). In order to estimate the fraction of the galaxy area observed by IUE, we calculated for each galaxy the “coverage parameter” C, defined as the logarithmic ratio between the surface area of the galaxy and the area of the large IUE aperture.
| (1) |
Here D25 and R25 are the major axis and the axial ratio of the optical image of the galaxy as listed in LEDA, in units of arcsec. The numerator approximates the surface area of the galaxy, represented as an ellipse with the major and minor axes of the galaxy.
A C-value of zero implies that the entire galaxy was measured by in the IUE spectrum. The distribution of galaxies as a function of the C parameter is shown in Figure 5 . For 17 faint galaxies, where the axes are not measurable and which are not shown in Figure 5, the C parameter is . For of the sample, the IUE aperture covered less than the of the galaxy.

Figure 6 shows the number of available spectra per galaxy. For 40% of the galaxies included in this Guide to Normal Galaxies only one spectrum, either SW or LW, was obtained. A few galaxies were observed extensively. Among those are the starburst galaxies NGC 4449, NGC 5253, and NGC 5236.

Figure 7 shows the number of galaxies in our sample as a function of the observation date of the two spectra included here. The distribution indicates two periods of enhanced interest in UV spectra of galaxies. From the launch of IUE to the mid-80s there was presumably a learning period of UV properties of galaxies, when many objects were observed. After this, the exploitation of IUE began in earnest. The peak in 1994-5 was probably due to “last-minute” observations, prior to the closing of the IUE Observatory.

In conclusion, the IUE data set for normal galaxies represents mostly a sample of UV spectra of the innermost regions of bright nearby galaxies.
9 Comments of specific objects
In some cases, the coordinates listed for the entrance aperture do not correspond to the coordinates of the galaxy identified in the header as the target of the observation, and IUE did not, in fact, observe an object but rather sampled blank parts of the sky. The galaxies for which the spectra are clearly misplaced, and which were removed from the present catalog, are: MCG +06-20-0022, NGC 3077, NGC 5813, AOO 1204-137, AOO PKS 1543+091, AOO ACG 1116+51, and AOO POX 4. For all the galaxies of the sample but six, the representative spectrum presented was obtained by the matching procedure of the SW and LW spectra (see section 5). The additive constant eventually applied to the LW spectrum is included on the right side of the plot. The LW spectra of five galaxies: NGC 147, NGC 253, AOO GH 10-4, NGC 3642, NGC 6062, shows a rising trend toward short wavelengths; it is possible that an additional light source contributed to the recorded spectrum. The LW spectrum for these galaxies is presented without performing the matching procedure.
Below we provide a few comments on individual objects and for the galaxies for which more than one page is presented:
AOO UM 239: This object was rejected from the list of galaxies included in this guide. The IUE aperture is located on an object that is one arcmin south of the declination quoted by NED for AOO UM 239.
NGC 221: This companion of the Andromeda galaxy, in the Local Group, is one of the most observed elliptical galaxies. The CIV line is absent in the deepest image: SWP30289.
NGC 224: This is M31, a spiral galaxy in the Local Group where the IUE spectra sampled the bulge population at the center. The UV spectral energy distribution appears similar to that of an elliptical galaxy.
NGC 244: The single spectrum of this galaxy available in the archive, belongs actually to the galaxy NGC 224, according to the aperture coordinates.
IC 1613: The SW and LW images refer to different regions of the galaxy. Therefore, the corresponding spectra displayed in the figure are separated.
NGC 300: This very extended galaxy was removed from the list. Only one IUE spectrum was obtained for it, and it corresponds to a region at the outskirts of the galaxy, not to a specific significant region such as the photocenter.
NGC 1022: The signal of the SW spectrum is zero. No matching procedure was applied to the LW spectrum, for obvious reasons.
NCG 1617: Some pixels of the LW spectrum are saturated.
NGC 1705: Although some pixels of the LW spectrum are saturated, the final representative spectrum is reasonably smooth.
PG 0833+652: Some pixels of the LW spectrum are saturated.
MRK 116 A: This object is one of a pair of interconnected blue compact galaxies. As a low metallicity galaxy, it is a good target for studying the star formation history and chemical mixing process.
NGC 3034: This nuclear starburst galaxy, also known as M82, shows a bipolar outflow along its minor axis. The IUE aperture was located on its center and on two regions near the outflow, named BD+ 70 5888A KNOT A and BD+ 70 5888A KNOT B. This galaxy has been extensively studied at various wavelengths.
AOO GH 10-4: The coordinates listed for this galaxy are from NED.
AOO ACG 1116+51: The IUE coordinates of this target are wrong. The IUE spectrograph missed the object, which is at 11h 19m 34s.24 +51∘ 30’ 11”.84 (PMM USNO-A2.0). As explained above, this galaxy was excluded from our compilation.
AOO 1214-277 and AOO 1214-28: These targets are near the Tololo 21 galaxy. The coordinates reported in the corresponding pages are those of some objects near the galaxy, listed in the PMM USNO-A2.0 catalog.
NGC 4449: Up to 48 spectra were obtained by IUE for NGC 4449. There are many HII regions and a complex of supernova remnants in this irregular galaxy. Eight pages are shown here for NGC 4449, representing the different regions sampled by IUE.
AOO ANON 1244-53: The level of the spectrum in the LW frame is consistent with a noisy zero signal.
NGC 4861: This system consists of IC 3961 plus a blue compact HII region in the south-west, identified as NGC 4861. Individual pages are shown for the two objects.
AOO POX 120: The declination quoted in LEDA is wrong. The coordinates listed here for this galaxy are from NED.
NGC 5236: This galaxy, better known as M83, is a nearby bright starburst spiral. Young massive star cluster systems are located in the nucleus and in the arms. Many IUE spectra were obtained at the position of some of the large number of historical supernovae observed in this galaxy.
NGC 5253: This nearby dwarf starburst galaxy hosts many bright knots embedded in its amorphous central region. It is believed that this complex of starburst regions is the source of the strong soft thermal X-ray emission detected by ROSAT. The representative spectrum is quite smooth, although the SW spectrum is saturated from 1800 to 1900Å.
NGC 5461 and NGC 5471: These are two HII regions in the outskirts of M101.
AOO PKS 1543+091: The IUE coordinates are wrong, and the spectrograph pointed at an unidentified faint object. The object is not included in our “normal galaxies” sample.
ESO B338-IG4: This is a compact galaxy with double nuclei that was extensively studied by IUE.
AOO AM 2020-504; The declination listed in LEDA is wrong. The coordinates presented here for this galaxy are from NED.
MCG-07-47-023: The signal in the SW and LW spectra is consistent with a noisy zero signal.
NGC 7673: The coordinates of the LW frame are outside the object. The correct location of the aperture, calculated from the position of the guide star as stored in the header of this image, is still outside the galaxy.
10 Conclusions
We present here a compilation of all galaxies classified as “normal”, i.e. not containing an AGN, which were observed by the IUE satellite. This is an updated and enlarged version of the previous IUE ULDA Guide to Normal Galaxies, produced by Longo & Capaccioli, and supersedes it. We took advantage of the final processing of IUE observations within the INES archive to extract all the observations of galaxies classified as normal and we present their UV spectra after matching the fluxes between the SW and LW segments that were observed toward the same location in the galaxy.
We believe that although most IUE observations of normal galaxies were only of their central regions, as defined by the optical light distributions, this compilation will be of some use in understanding the UV light produced by the different stellar populations in objects lacking a central, compact, massive object.
Acknowledgments
This compilation was produced in support of the TAUVEX mission. UV research at Tel Aviv University is supported by grants from the Ministry of Science, Culture and Sport through the Israel Space Agency, from the Austrian Friends of Tel Aviv University, and from a Center of Excellence Award from the Israel Science Foundation. NB acknowledges support from an US-Israel Binational Award to study UV sources measured by the FAUST experiment. In this publication we made use of the LEDA database, http://www-obs.univ-lyon1.fr.
We are grateful to Willem Wamsteker for encouraging us to go ahead with the production of this Guide. Enrique Solano helped us by recalculating the true pointing of IUE of some 20 discrepant IUE spectra. This solved the mystery of reasonable spectra apparently obtained on blank sky.
References
-
Bianchi, L. & Martin, C. 1997, in “The Ultraviolet Astrophysics beyond the IUE final Archive” (R. Harris, ed.) ESA SP-413, 797.
-
Bonatto, C., Bica, E., Pastoriza, M.G. & Alloin, D. 1996, Astron. Astrophys. Suppl. 118, 89.
-
Bowyer, S., Sasseen, T., Wu, X. & Lampton, M. 1995, Astrophys. J. Suppl 96, 461.
-
Boyarchuk, A.A. 1994, “Astronomical investigations with the ASTRON cosmic station” (in Russian) Moscow: FIZMATLIT.
-
Brosch, N. 1991, Mon. Not. R. astr. Soc. 250, 780.
-
Brosch, N., Almoznino, E., Leibowitz, E.M., Netzer, H., Sasseen, T.P., Bowyer, S., Lampton, M. & Wu, X. 1995, Astrophys. J. 450, 137.
-
Brosch, N., Formiggini, L., Almoznino, E., Sasseen, T., Lampton, M. & Bowyer, S. 1997, Astrophys. J. Suppl. 111, 143.
-
Brosch, N., Ofek, E., Almoznino, E., Sasseen, T., Lampton, M. & Bowyer, S. 1998, Mon. Not. R. astr. Soc., 295, 959.
-
Brosch, N., Shara, M., MacKenty, J., Zurek, D. & McLean, B. 1999, Astron. J, 117, 206.
-
Burstein, D., Bertola, F., Buson, L.M., Faber, S.M. & Lauer, T.R. 1988, Astrophys. J. 328, 440.
-
Burstein, D. & Heiles, C. 1984, ApJS, 54, 33.
-
Courvoisier, T.J.-L., Paltini, S. 1992, “IUE ULDA Access Guide No. 4: Active Galactic Nuclei, ESA SP-1153 (Vol. A & B)
-
Deharveng, J.-M., Sasseen, T.P., Buat, V., Bowyer, S., Lampton, M. & Wu, X. 1994, Astron. Astrophys. 289, 715.
-
Donas, J., Deharveng, J.-M., Laget, M., Milliard, B. & Huguenin, D. 1987, Astron. Astrophys. 180, 12.
-
Ellis, R.S., Gondhalekar, P.M. & Efstathiou, G. 1982, Mon. Not. R. astr. Soc. 201, 223.
-
Ellis, R.S. 1997, Ann. Rev. Astron. Astrophys. 35, 389.
-
Fanelli, M.N., O’Connell, R.W. & Thuan, T.X. 1987, Astrophys. J. 321, 768.
-
Heck, A., Egret, D., Jaschek, M. & Jaschek, C. 1984, “IUE Low-Dispersion Spectra Reference Atlas - Part 1. Normal Stars”, Paris: ESA SP-1052.
-
Kinney, A.L., Bohlin, R.C., Calzetti, D., Panagia, N. & Wyse, R.F.G. 1993, Astrophys. J. Suppl. 86, 5.
-
Kinney, A.L., Calzetti, D., Bohlin, R.C., McQuade, K., Storchi-Bergmann, T. & Schmitt, H.R. 1996, Astrophys. J., 467, 38.
-
Longo, G., Capaccioli, M.& Ceriello, A. 1991, Astron. Astrophys. Suppl. 90, 375.
-
Longo, G. & Capaccioli, M. 1992, “IUE ULDA Access Guide No. 3: Normal Galaxies”, ESA SP-1152.
-
Milliard, B., Donas, J., Laget, M., Armand, C. & Vuillemin, A. 1992, Astron. Astrophys. 257, 24.
-
McQuade, K., Calzetti, D. & Kinney, A.L. 1995, Astrophys. J. Suppl., 97, 331.
-
Nichols, J.S., Garhart, M.P., De La Pena, M.D. & Levay, K.L. 1993, ”IUE NEWSIPS Image Processing System Information Manual: Low Dispersion Data”, Version 1.0, CSC/SD-93/6062.
-
O’Connell, R.W. 1992, in “The stellar population of galaxies” (B. Barbuy and A. Renzini, eds.) Dordrecht: Reidel Publishing Co., p. 233.
-
O’Connell, R.W., Bohlin, R.C., Collins, N.R., Cornett, R.H., Hill, J.K., Hill, R.S., Landsman, W.B., Roberts, M.S., Smith, A.M. & Stecher, T.P. 1992, Astrophys. J. Lett. 395, L45.
-
O’Connell, R.W. 1999, Ann. Rev. Astron. Astrophys., 37, 603.
-
Rifatto, A., Longo, G. & Capaccioli, M. 1995a, Astron. Astrophys. Suppl. 109, 341.
-
Rifatto, A., Longo, G. & Capaccioli, M. 1995b, Astron. Astrophys. Suppl. 114, 527.
-
Rodriguez-Pascual, P.M., Schartel, N., Wamsteker, W. & Perez-Calpena, A. 1998, ”Extraction of Low Dispersion Spectra for INES”, INES Document 4.3.
-
Schartel, N. & Rodriguez-Pascual, P.M. 1998, ”INES Noise Model”, INES Document 4.2.
-
Schartel, N. & Skillen, I. 1998, in ”Ultraviolet Astrophysics beyond the IUE Final Archive”, ESA SP-413 (W. Wamsteker & R. G0nzales Riestra, eds.), p. 735.
-
Schlegel, D.J., Finkbeiner, D.P. & Davis, M. 1998, ApJ, 500, 525.
-
Seaton, M.J. 1979, Mon. Not. R. astr. Soc. 187, 73.
-
Storchi-Bergmann, T., Calzetti, D. & Kinney, A.L. 1994, Astrophys. J. 429, 572 (SB2).
-
Steindling, S., Brosch, N. & Rakos, K. 2000, Astrophys. J., submitted.
-
Wu, C.-C., Crenshaw, D.M., Blackwell, J.H., Wilson-Diaz, D. Schiffer, F.H., Burstein, D., Fanelli, M.N. & O’Connell, R.W. 1991, “IUE Ultraviolet Spectral Atlas”, IUE NASA Newsletter No. 43.
| IUE ID | Nsp | h | m | s | ∘ | ’ | ” | Morph. Type | T | BT | B–V | U–B |
|---|---|---|---|---|---|---|---|---|---|---|---|---|
| NGC7828 | 1 | 00 | 06 | 27 | -13 | 24 | 54 | Sc | 5.484 | 14.37 | 0.51 | -0.20 |
| NGC118 | 1 | 00 | 27 | 16 | -01 | 46 | 48 | E | -5.000 | 14.63 | ||
| NGC147 | 2 | 00 | 33 | 12 | 48 | 30 | 28 | E | -4.785 | 10.37 | 0.95 | |
| ESOB350-IG38 | 1 | 00 | 36 | 53 | -33 | 33 | 24 | S? | 10.000 | 15.45 | ||
| NGC205 | 9 | 00 | 40 | 23 | 41 | 41 | 11 | E | -4.763 | 8.73 | 0.86 | |
| NGC210 | 2 | 00 | 40 | 35 | -13 | 52 | 26 | SBb | 2.986 | 11.83 | 0.71 | 0.07 |
| ABCG85 | 5 | 00 | 41 | 51 | -09 | 18 | 15 | E-S0 | -3.460 | 14.50 | 1.00 | |
| NGC221 | 10 | 00 | 42 | 42 | 40 | 51 | 55 | E | -4.712 | 8.73 | 0.95 | 0.48 |
| NGC224 | 18 | 00 | 42 | 44 | 41 | 16 | 08 | Sb | 2.996 | 4.18 | 0.93 | 0.50 |
| NGC245 | 1 | 00 | 46 | 06 | -01 | 43 | 20 | Sb | 3.129 | 12.82 | ||
| ESOB474- 26 | 1 | 00 | 47 | 08 | -24 | 22 | 14 | Sc | 4.826 | 14.94 | ||
| NGC253 | 4 | 00 | 47 | 33 | -25 | 17 | 18 | SBc | 5.055 | 7.92 | 0.86 | 0.38 |
| IC1586 | 1 | 00 | 47 | 56 | 22 | 22 | 28 | compact | 14.90 | |||
| MRK960 | 2 | 00 | 48 | 35 | -12 | 43 | 01 | S0 | -1.984 | 13.97 | ||
| NGC337 | 1 | 00 | 59 | 50 | -07 | 34 | 41 | SBcd | 6.905 | 12.03 | 0.45 | -0.09 |
| IC1613 | 5 | 01 | 04 | 54 | 02 | 07 | 60 | Irr | 9.870 | 9.94 | 0.68 | |
| NGC404 | 5 | 01 | 09 | 27 | 35 | 43 | 04 | E-S0 | -2.798 | 10.97 | 0.94 | 0.28 |
| ESOB296-IG11 | 4 | 01 | 19 | 57 | -41 | 14 | 10 | Sd | 7.901 | 14.47 | 0.26 | 0.34 |
| NGC520 | 1 | 01 | 24 | 35 | 03 | 47 | 25 | S? | 3.840 | 12.14 | 0.82 | 0.17 |
| AOO PKS0123-16 | 5 | 01 | 25 | 48 | 01 | 22 | 18 | Irr | 10.000 | 14.42 | ||
| NGC584 | 1 | 01 | 31 | 21 | -06 | 52 | 06 | E | -4.620 | 11.31 | 0.96 | 0.50 |
| NGC598 | 13 | 01 | 33 | 51 | 30 | 39 | 37 | Sc | 5.961 | 6.20 | 0.56 | -0.09 |
| NGC625 | 2 | 01 | 35 | 05 | -41 | 26 | 11 | SBm | 9.295 | 11.60 | 0.56 | -0.06 |
| NGC660 | 1 | 01 | 43 | 01 | 13 | 38 | 37 | SBa | 1.091 | 11.83 | 0.87 | |
| MRK2 | 1 | 01 | 54 | 53 | 36 | 55 | 02 | SBa | 0.599 | 13.92 | 0.59 | -0.14 |
| NGC835 | 1 | 02 | 09 | 25 | -10 | 08 | 09 | SBab | 1.945 | 12.97 | 0.81 | 0.19 |
| IC214 | 1 | 02 | 14 | 06 | 05 | 10 | 32 | Sd | 7.500 | 14.68 | 0.53 | -0.27 |
| NGC936 | 1 | 02 | 27 | 38 | -01 | 09 | 17 | S0-a | -0.983 | 11.01 | 0.98 | 0.56 |
| NGC992 | 1 | 02 | 37 | 26 | 21 | 05 | 55 | Sc | 5.116 | 15.56 | 0.41 | -0.43 |
| NGC1022 | 2 | 02 | 38 | 33 | -06 | 40 | 41 | SBab | 1.867 | 12.09 | 0.75 | 0.24 |
| IC1830 | 1 | 02 | 39 | 04 | -27 | 26 | 43 | S0-a | -0.862 | 13.34 | 0.41 | -0.25 |
| NGC1023 | 1 | 02 | 40 | 24 | 39 | 03 | 46 | E-S0 | -2.610 | 10.12 | 1.00 | 0.56 |
| MRK600 | 1 | 02 | 51 | 04 | 04 | 27 | 09 | Sc | 5.000 | 14.99 | ||
| ABCG400A | 1 | 02 | 57 | 42 | 06 | 01 | 38 | E | -4.250 | 13.86 | 1.16 | 0.67 |
| IC298A | 1 | 03 | 11 | 20 | 01 | 18 | 46 | SBbc | 3.640 | 15.98 | ||
| NGC1313 | 4 | 03 | 18 | 15 | -66 | 29 | 51 | SBcd | 6.990 | 9.66 | 0.50 | -0.23 |
| NGC1316 | 2 | 03 | 22 | 42 | -37 | 12 | 28 | S0 | -1.738 | 9.37 | 0.89 | 0.39 |
| NGC1326 | 2 | 03 | 23 | 56 | -36 | 27 | 50 | S0-a | -0.776 | 11.39 | 0.88 | 0.29 |
| NGC1385 | 2 | 03 | 37 | 28 | -24 | 30 | 12 | SBc | 6.004 | 11.45 | 0.51 | -0.17 |
| AOO SBSG 0335-052 | 3 | 03 | 37 | 47 | -05 | 02 | 47 | EmLS | ||||
| NGC1399 | 3 | 03 | 38 | 29 | -35 | 26 | 58 | E | -4.548 | 10.39 | 0.96 | 0.50 |
| NGC1404 | 4 | 03 | 38 | 52 | -35 | 35 | 36 | E | -4.749 | 10.89 | 0.98 | 0.56 |
| NGC1407 | 4 | 03 | 40 | 12 | -18 | 34 | 52 | E | -4.550 | 10.69 | 1.03 | |
| ESOB156-IG7 | 3 | 03 | 41 | 12 | -54 | 00 | 39 | S0 | 2.000 | 15.71 | ||
| NGC1510 | 3 | 04 | 03 | 33 | -43 | 24 | 01 | S0 | -1.949 | 13.51 | 0.45 | -0.19 |
| NGC1512 | 4 | 04 | 03 | 55 | -43 | 21 | 03 | SBa | 1.138 | 11.05 | 0.81 | 0.17 |
| NGC1533 | 1 | 04 | 09 | 51 | -56 | 07 | 14 | S0 | -2.396 | 11.82 | 0.99 | 0.50 |
| NGC1549 | 2 | 04 | 15 | 45 | -55 | 35 | 31 | E | -4.283 | 10.69 | 0.94 | 0.50 |
| NGC1553 | 3 | 04 | 16 | 10 | -55 | 46 | 51 | S0 | -2.344 | 10.31 | 0.88 | 0.48 |
| AOO TOL 0420-414 | 1 | 04 | 21 | 59 | -41 | 19 | 21 | EmLS | 18.26 | |||
| NGC1617 | 1 | 04 | 31 | 39 | -54 | 36 | 05 | S0-a | 0.183 | 11.29 | 0.94 | 0.50 |
| ABCG496 | 2 | 04 | 33 | 38 | -13 | 15 | 38 | E | -4.067 | 13.83 | ||
| NGC1637 | 2 | 04 | 41 | 28 | -02 | 51 | 30 | SBc | 5.029 | 11.38 | 0.64 | 0.05 |
| AOO TOL 0440-381 | 1 | 04 | 42 | 08 | -38 | 01 | 03 | EmLS | ||||
| NGC1705 | 11 | 04 | 54 | 14 | -53 | 21 | 44 | E-S0 | -2.963 | 12.77 | 0.38 | -0.44 |
| NGC1691 | 1 | 04 | 54 | 38 | 03 | 16 | 06 | S0-a | 0.064 | 12.77 | ||
| NGC1741 | 5 | 05 | 01 | 38 | -04 | 15 | 25 | Sm | 8.913 | 15.52 | ||
| NGC1800 | 1 | 05 | 06 | 26 | -31 | 57 | 16 | Irr | 9.908 | 13.04 | 0.55 | -0.17 |
| MRK1094 | 1 | 05 | 10 | 48 | -02 | 40 | 54 | S? | 3.400 | 13.87 | ||
| NGC1819 | 1 | 05 | 11 | 46 | 05 | 12 | 01 | S0 | -1.972 | 13.38 | ||
| AOO TOL 0513-393 | 1 | 05 | 15 | 20 | -39 | 17 | 41 | EmLS | ||||
| NGC1947 | 1 | 05 | 26 | 48 | -63 | 45 | 41 | E-S0 | -3.165 | 11.70 | 1.01 | 0.50 |
| AOO GH 10- 4 | 2 | 06 | 00 | 46 | -68 | 40 | 00 | SBb | ||||
| NGC2146 | 1 | 06 | 18 | 40 | 78 | 21 | 19 | SBab | 2.268 | 11.16 | 0.80 | 0.29 |
| NGC2217 | 3 | 06 | 21 | 40 | -27 | 14 | 00 | S0-a | -0.639 | 11.63 | 1.00 | 0.55 |
| AOO 0644-741 | 1 | 06 | 43 | 00 | -74 | 14 | 11 | E-S0 | -2.970 | 13.88 | 0.88 | 0.19 |
| AOO TOL 0645-376 | 1 | 06 | 46 | 49 | -37 | 43 | 25 | EmLS | 17.38 | |||
| MRK7 | 2 | 07 | 28 | 11 | 72 | 34 | 20 | Sd | 7.752 | 14.44 | ||
| IC2184 | 2 | 07 | 29 | 25 | 72 | 07 | 41 | Sbc | 4.077 | 14.38 | ||
| NGC2403 | 5 | 07 | 36 | 54 | 65 | 35 | 58 | SBc | 5.967 | 8.83 | 0.47 | |
| AOO HARO 1 | 2 | 07 | 36 | 57 | 35 | 14 | 33 | Irr | 9.711 | 12.72 | 0.42 | -0.20 |
| MRK12 | 3 | 07 | 50 | 48 | 74 | 21 | 32 | SBc | 4.987 | 13.11 | 0.44 | -0.38 |
| NGC2537 | 4 | 08 | 13 | 15 | 45 | 59 | 29 | SBm | 8.617 | 12.19 | 0.63 | -0.14 |
| MCG +12-08-0033 | 2 | 08 | 19 | 06 | 70 | 42 | 51 | Irr | 9.813 | 11.10 | 0.44 | |
| PK 248+08 1 | 2 | 08 | 36 | 16 | -26 | 24 | 40 | E-S0 | -2.621 | 12.47 | ||
| MCG +12-08-0048 | 3 | 08 | 37 | 03 | 69 | 46 | 29 | Irr | 9.867 | 15.30 | ||
| PG 0833+652 | 4 | 08 | 38 | 23 | 65 | 07 | 16 | pec | ||||
| NGC2623 | 3 | 08 | 38 | 24 | 25 | 45 | 01 | Sb | 2.700 | 13.99 | 0.63 | 0.12 |
| AOO T 0840+120 | 1 | 08 | 42 | 21 | 11 | 50 | 01 | |||||
| MRK702 | 2 | 08 | 45 | 34 | 16 | 05 | 48 | compact | 15.57 | |||
| NGC2684 | 2 | 08 | 54 | 53 | 49 | 09 | 38 | Sc | 5.186 | 13.65 | 0.69 | -0.20 |
| NGC2773 | 1 | 09 | 09 | 44 | 07 | 10 | 26 | S? | 2.700 | 14.46 | ||
| NGC2768 | 2 | 09 | 11 | 38 | 60 | 02 | 22 | E | -4.422 | 10.80 | 0.98 | 0.47 |
| NGC2784 | 2 | 09 | 12 | 19 | -24 | 10 | 22 | S0 | -2.075 | 11.17 | 1.14 | 0.73 |
| MRK19 | 1 | 09 | 16 | 43 | 59 | 46 | 20 | BCG | 15.50 | |||
| NGC2798 | 3 | 09 | 17 | 23 | 42 | 00 | 02 | SBa | 1.068 | 13.04 | 0.73 | -0.01 |
| IC2458 | 2 | 09 | 21 | 29 | 64 | 14 | 11 | S0-a | 0.000 | 15.41 | 0.41 | -0.63 |
| NGC2865 | 2 | 09 | 23 | 31 | -23 | 09 | 48 | E | -4.115 | 12.41 | 0.92 | 0.41 |
| NGC2903 | 5 | 09 | 32 | 10 | 21 | 30 | 02 | SBbc | 4.006 | 9.48 | 0.68 | 0.06 |
| MRK116 A | 11 | 09 | 34 | 02 | 55 | 14 | 25 | compact | 15.61 | 0.11 | -0.64 | |
| NGC2997 | 3 | 09 | 45 | 39 | -31 | 11 | 28 | SBc | 5.076 | 10.08 | ||
| NGC3023 | 2 | 09 | 49 | 53 | 00 | 37 | 13 | SBc | 5.473 | 12.95 | ||
| NGC3049 | 3 | 09 | 54 | 50 | 09 | 16 | 19 | SBab | 2.466 | 13.27 | ||
| NGC3034 | 5 | 09 | 55 | 54 | 69 | 40 | 57 | Sd | 7.932 | 9.07 | 0.89 | 0.31 |
| ESOB435-IG20 | 1 | 09 | 59 | 21 | -28 | 07 | 54 | Sb | 3.000 | 14.40 | ||
| MRK25 | 3 | 10 | 03 | 52 | 59 | 26 | 11 | E-S0 | -3.243 | 14.82 | 0.57 | -0.27 |
| NGC3115 | 5 | 10 | 05 | 14 | -07 | 43 | 07 | E-S0 | -2.807 | 9.86 | 0.98 | 0.55 |
| NGC3125 | 3 | 10 | 06 | 34 | -29 | 56 | 10 | E | -4.931 | 13.47 | 0.50 | -0.47 |
| ESOB316- 32 | 1 | 10 | 09 | 06 | -38 | 24 | 33 | SBab | 1.925 | 13.53 | ||
| MRK26 | 1 | 10 | 11 | 51 | 58 | 53 | 31 | Sc | 15.99 | |||
| NGC3156 | 3 | 10 | 12 | 41 | 03 | 07 | 50 | S0 | -2.451 | 13.08 | 0.77 | 0.26 |
| NGC3256 | 3 | 10 | 27 | 51 | -43 | 54 | 20 | Sb | 3.225 | 12.08 | 0.64 | -0.07 |
| MRK33 | 3 | 10 | 32 | 31 | 54 | 23 | 56 | Irr | 9.711 | 12.98 | ||
| NGC3311 | 1 | 10 | 36 | 43 | -27 | 31 | 41 | E-S0 | -3.429 | 12.42 | 1.00 | 0.57 |
| NGC3310 | 4 | 10 | 38 | 46 | 53 | 30 | 08 | SBbc | 3.993 | 11.08 | 0.35 | -0.43 |
| NGC3351 | 2 | 10 | 43 | 58 | 11 | 42 | 15 | SBb | 3.077 | 10.39 | 0.81 | 0.19 |
| NGC3353 | 2 | 10 | 45 | 23 | 55 | 57 | 33 | Sb | 3.004 | 13.22 | 0.47 | -0.34 |
| NGC3379 | 4 | 10 | 47 | 50 | 12 | 34 | 57 | E | -4.808 | 10.22 | 0.96 | 0.53 |
| MRK153 | 1 | 10 | 49 | 05 | 52 | 19 | 58 | Sc | 4.900 | 14.98 | 0.19 | -0.63 |
| NGC3395 | 1 | 10 | 49 | 49 | 32 | 58 | 51 | SBc | 5.925 | 12.40 | 0.34 | -0.23 |
| NGC3396 | 1 | 10 | 49 | 56 | 32 | 59 | 22 | SBm | 9.435 | 12.48 | ||
| NGC3432 | 1 | 10 | 52 | 31 | 36 | 37 | 08 | SBm | 8.852 | 11.65 | 0.42 | -0.36 |
| MRK1267 | 2 | 10 | 53 | 04 | 04 | 37 | 43 | E? | 14.16 | |||
| ABCG1126 | 1 | 10 | 53 | 50 | 16 | 51 | 00 | 15.12 | ||||
| NGC3448 | 2 | 10 | 54 | 39 | 54 | 18 | 24 | S0-a | 0.200 | 12.41 | 0.44 | -0.19 |
| NGC3471 | 1 | 10 | 59 | 09 | 61 | 31 | 51 | Sa | 1.000 | 13.24 | 0.71 | 0.17 |
| NGC3504 | 2 | 11 | 03 | 11 | 27 | 58 | 25 | SBab | 2.070 | 11.65 | 0.73 | 0.00 |
| AOO APG 148 | 1 | 11 | 03 | 54 | 40 | 51 | 00 | S? | 9.200 | |||
| MRK36 | 2 | 11 | 04 | 58 | 29 | 08 | 22 | BCD | 15.64 | 0.28 | -0.66 | |
| AOO CASG 816 W | 1 | 11 | 12 | 08 | 35 | 52 | 43 | compact | 17.50 | |||
| NGC3610 | 2 | 11 | 18 | 26 | 58 | 47 | 14 | E | -4.197 | 11.65 | 0.87 | 0.47 |
| NGC3622 | 3 | 11 | 20 | 13 | 67 | 14 | 27 | S? | 3.800 | 13.65 | 0.50 | |
| NGC3640 | 2 | 11 | 21 | 07 | 03 | 14 | 08 | E | -4.846 | 11.30 | 0.93 | 0.53 |
| NGC3642 | 2 | 11 | 22 | 18 | 59 | 04 | 34 | Sbc | 3.997 | 11.53 | 0.50 | |
| MRK170 | 2 | 11 | 26 | 50 | 64 | 8 | 16 | S? | 2.700 | 15.03 | ||
| NGC3682 | 2 | 11 | 27 | 43 | 66 | 35 | 25 | S0-a | -0.037 | 13.26 | 0.76 | 0.04 |
| MCG +13-08-0058 | 1 | 11 | 28 | 01 | 78 | 59 | 29 | pec | 15.08 | |||
| NGC3690 | 8 | 11 | 28 | 34 | 58 | 33 | 51 | SBm | 8.754 | 11.71 | ||
| MRK178 | 2 | 11 | 33 | 29 | 49 | 14 | 12 | Irr | 9.933 | 14.45 | 0.35 | -0.30 |
| NGC3738 | 3 | 11 | 35 | 49 | 54 | 31 | 22 | Irr | 9.783 | 11.98 | 0.41 | -0.19 |
| NGC3810 | 2 | 11 | 40 | 58 | 11 | 28 | 17 | Sc | 5.164 | 11.24 | 0.58 | -0.06 |
| MCG +03-30-0066 | 1 | 11 | 43 | 49 | 19 | 58 | 12 | Irr | 9.702 | 14.10 | 0.50 | -0.31 |
| AOO ARP 248B | 1 | 11 | 46 | 45 | -03 | 50 | 54 | SBbc | 3.825 | 15.15 | ||
| NGC3894 | 1 | 11 | 48 | 51 | 59 | 25 | 01 | E | -4.090 | 12.63 | 1.00 | 0.59 |
| NGC3991 | 4 | 11 | 57 | 31 | 32 | 20 | 00 | SBd | 7.900 | 13.52 | 0.39 | -0.33 |
| NGC3994 | 2 | 11 | 57 | 36 | 32 | 16 | 44 | Sc | 5.010 | 13.32 | 0.62 | -0.14 |
| NGC3995 | 2 | 11 | 57 | 44 | 32 | 17 | 38 | SBm | 8.833 | 12.69 | 0.28 | -0.41 |
| NGC4004 | 1 | 11 | 58 | 05 | 27 | 52 | 38 | Irr | 9.932 | 13.97 | 0.44 | -0.27 |
| AOO POX 36 | 1 | 11 | 58 | 59 | -19 | 01 | 36 | Scd | 6.725 | 14.28 | ||
| AOO MKW 4 | 1 | 12 | 04 | 27 | 01 | 53 | 48 | E | -4.103 | 12.46 | 1.00 | |
| AOO HE 1203-2644 | 2 | 12 | 05 | 59 | -27 | 00 | 54 | S0-a | -1.000 | 14.98 | ||
| NGC4102 | 1 | 12 | 06 | 23 | 52 | 42 | 41 | SBb | 3.087 | 12.03 | ||
| NGC4111 | 4 | 12 | 07 | 03 | 43 | 04 | 02 | S0-a | -1.353 | 11.46 | 0.89 | 0.44 |
| NGC4125 | 2 | 12 | 08 | 07 | 65 | 10 | 22 | E | -4.817 | 10.63 | 0.94 | 0.50 |
| IC3017 | 1 | 12 | 09 | 25 | 13 | 34 | 25 | S? | 4.800 | 14.82 | ||
| AOO VCC 22 | 1 | 12 | 10 | 24 | 13 | 10 | 13 | BCD? | 16.13 | |||
| AOO VCC 24 | 2 | 12 | 10 | 36 | 11 | 45 | 37 | BCD | 15.10 | |||
| NGC4194 | 2 | 12 | 14 | 10 | 54 | 31 | 39 | Irr | 9.940 | 12.96 | 0.55 | -0.20 |
| MCG +01-31-030 | 1 | 12 | 15 | 19 | 05 | 45 | 42 | E | -4.899 | 14.99 | 0.39 | -0.47 |
| NGC4214 | 8 | 12 | 15 | 39 | 36 | 19 | 39 | Irr | 9.810 | 10.13 | 0.47 | |
| AOO 1214-277 | 2 | 12 | 17 | 21 | -28 | 02 | 32 | EmLS | ||||
| AOO 1214-28 | 1 | 12 | 17 | 17 | -28 | 02 | 33 | EmLS | ||||
| NGC4244 | 2 | 12 | 17 | 30 | 37 | 48 | 27 | Sc | 6.032 | 10.67 | 0.50 | |
| MRK49 | 1 | 12 | 19 | 10 | 03 | 51 | 28 | E | -4.924 | 14.29 | 0.50 | -0.31 |
| NGC4314 | 3 | 12 | 22 | 32 | 29 | 53 | 47 | SBa | 1.020 | 11.42 | 0.86 | 0.29 |
| AOO VCC 562 | 1 | 12 | 22 | 36 | 12 | 09 | 28 | BCD | 16.43 | -0.61 | ||
| NGC4321 | 7 | 12 | 22 | 55 | 15 | 49 | 23 | SBbc | 4.048 | 10.00 | 0.70 | -0.01 |
| NGC4350 | 5 | 12 | 23 | 58 | 16 | 41 | 34 | S0 | -1.786 | 11.91 | 0.95 | 0.47 |
| NGC4374 | 3 | 12 | 25 | 04 | 12 | 53 | 15 | E | -4.009 | 10.01 | 0.99 | 0.53 |
| NGC4382 | 2 | 12 | 25 | 25 | 18 | 11 | 27 | S0-a | -1.332 | 9.94 | 0.89 | 0.42 |
| NGC4385 | 4 | 12 | 25 | 43 | 00 | 34 | 24 | S0-a | -0.706 | 13.16 | 0.69 | 0.02 |
| NGC4406 | 3 | 12 | 26 | 12 | 12 | 56 | 49 | E | -4.719 | 9.79 | 0.94 | 0.50 |
| MRK209 | 3 | 12 | 26 | 16 | 48 | 29 | 31 | Sm pec | 14.65 | |||
| IC3370 | 1 | 12 | 27 | 37 | -39 | 20 | 18 | E | -4.578 | 11.99 | 0.98 | 0.41 |
| NGC4438 | 2 | 12 | 27 | 45 | 13 | 00 | 36 | S0-a | 0.500 | 10.89 | 0.86 | 0.35 |
| NGC4449 | 48 | 12 | 28 | 11 | 44 | 05 | 40 | Irr | 9.790 | 9.84 | 0.41 | -0.34 |
| NGC4472 | 11 | 12 | 29 | 46 | 07 | 59 | 58 | E | -4.723 | 9.20 | 0.96 | 0.56 |
| NGC4500 | 3 | 12 | 31 | 22 | 57 | 57 | 52 | SBa | 1.076 | 13.11 | 0.61 | -0.07 |
| NGC4494 | 1 | 12 | 31 | 24 | 25 | 46 | 25 | E | -4.817 | 10.68 | 0.88 | 0.45 |
| NGC4552 | 6 | 12 | 35 | 40 | 12 | 33 | 25 | E | -4.611 | 10.68 | 0.99 | 0.56 |
| NGC4566 | 1 | 12 | 36 | 01 | 54 | 13 | 13 | Sbc | 4.148 | 13.85 | 0.75 | -0.01 |
| NGC4564 | 1 | 12 | 36 | 27 | 11 | 26 | 21 | E | -4.717 | 11.86 | 0.94 | 0.47 |
| NGC4621 | 3 | 12 | 42 | 03 | 11 | 38 | 49 | E | -4.766 | 10.67 | 0.94 | 0.48 |
| NGC4649 | 4 | 12 | 43 | 40 | 11 | 32 | 58 | E | -4.580 | 9.71 | 0.98 | |
| MGC UGC 7905 S | 1 | 12 | 43 | 48 | 54 | 53 | 45 | Sab | 1.913 | 14.06 | ||
| AOO HARO 33 | 3 | 12 | 44 | 38 | 28 | 28 | 19 | Sc | 5.516 | 14.74 | ||
| NGC4650A | 1 | 12 | 44 | 50 | -40 | 42 | 54 | S0-a | 0.000 | 13.92 | ||
| NGC4670 | 3 | 12 | 45 | 17 | 27 | 07 | 34 | S0-a | 0.301 | 13.07 | 0.41 | -0.47 |
| MCG +02-33-0012 | 1 | 12 | 46 | 05 | 08 | 28 | 31 | BCD | 14.78 | |||
| AOO ANON 1244-53 | 2 | 12 | 47 | 38 | -53 | 33 | 08 | E? | -0.500 | 14.80 | ||
| NGC4697 | 4 | 12 | 48 | 36 | -05 | 48 | 02 | E | -4.789 | 10.13 | 0.92 | 0.39 |
| NGC4696 | 2 | 12 | 48 | 48 | -41 | 18 | 39 | E | 3.868 | 11.54 | ||
| AOO TOL 1247-232 | 1 | 12 | 50 | 19 | -23 | 33 | 57 | EmLS | ||||
| NGC4736 | 11 | 12 | 50 | 54 | 41 | 07 | 10 | Sb | 2.519 | 8.74 | 0.75 | 0.16 |
| NGC4742 | 2 | 12 | 51 | 48 | -10 | 27 | 18 | E | -4.788 | 12.08 | 0.81 | 0.31 |
| NGC4762 | 4 | 12 | 52 | 56 | 11 | 13 | 48 | S0 | -1.826 | 11.11 | 0.87 | 0.41 |
| NGC4774 | 1 | 12 | 53 | 07 | 36 | 49 | 07 | Sd | 7.867 | 14.81 | 0.48 | -0.09 |
| MRK54 | 5 | 12 | 56 | 56 | 32 | 26 | 55 | Sc | 5.056 | 15.29 | 0.28 | |
| NGC4853 | 4 | 12 | 58 | 35 | 27 | 35 | 50 | E-S0 | -2.951 | 14.40 | 0.81 | 0.24 |
| NGC4861 | 6 | 12 | 59 | 03 | 34 | 51 | 38 | SBm | 8.932 | 14.10 | ||
| NGC4874 | 1 | 12 | 59 | 36 | 27 | 57 | 44 | E | -3.634 | 12.71 | 0.95 | 0.50 |
| NGC4889 | 2 | 13 | 00 | 08 | 27 | 58 | 45 | E | -4.301 | 12.53 | 1.04 | 0.52 |
| QSO 1300+361 | 1 | 13 | 03 | 03 | 35 | 51 | 29 | 18.00 | ||||
| AOO POX 120 | 1 | 13 | 06 | 42 | -12 | 04 | 22 | EmLS | 15.70 | |||
| AOO POX 124 | 1 | 13 | 07 | 26 | -13 | 11 | 01 | EmLS | 15.51 | |||
| NGC5018 | 2 | 13 | 13 | 01 | -19 | 31 | 12 | E | -4.548 | 11.66 | 0.93 | 0.48 |
| MCG +07-27-0052 | 1 | 13 | 14 | 10 | 39 | 08 | 51 | 15.58 | ||||
| MRK450 | 2 | 13 | 14 | 48 | 34 | 52 | 44 | Irr | 9.846 | 14.33 | 0.56 | -0.43 |
| NGC5044 | 1 | 13 | 15 | 24 | -16 | 23 | 09 | E | -4.778 | 11.69 | 1.00 | 0.55 |
| MGC UGC 8335 N | 1 | 13 | 15 | 35 | 62 | 07 | 27 | Sab | 1.700 | 14.62 | ||
| NGC5055 | 1 | 13 | 15 | 49 | 42 | 02 | 06 | Sbc | 3.971 | 9.18 | 0.73 | |
| NGC5102 | 8 | 13 | 21 | 58 | -36 | 37 | 47 | E-S0 | -2.972 | 10.28 | 0.73 | 0.23 |
| NGC5122 | 2 | 13 | 24 | 15 | -10 | 39 | 16 | S? | 2.700 | 14.10 | ||
| AOO POX 186 | 3 | 13 | 25 | 51 | -11 | 37 | 35 | EmLS | 17.00 | |||
| MRK66 | 1 | 13 | 25 | 54 | 57 | 15 | 05 | BCG | 15.05 | |||
| NGC5204 | 1 | 13 | 29 | 36 | 58 | 25 | 04 | Sm | 8.851 | 11.66 | 0.41 | -0.33 |
| NGC5195 | 1 | 13 | 29 | 59 | 47 | 16 | 05 | S0-a | 0.064 | 10.26 | 0.90 | 0.31 |
| NGC5236 | 23 | 13 | 37 | 00 | -29 | 52 | 04 | SBc | 5.028 | 7.92 | 0.67 | 0.04 |
| ESOB383-G44 | 2 | 13 | 37 | 27 | -33 | 00 | 22 | Scd | 6.815 | 14.05 | ||
| NGC5253 | 19 | 13 | 39 | 56 | -31 | 38 | 41 | S? | 7.689 | 10.77 | 0.44 | -0.23 |
| MRK67 | 1 | 13 | 41 | 56 | 30 | 31 | 11 | BCD | 16.36 | |||
| NGC5266 | 1 | 13 | 43 | 02 | -48 | 10 | 12 | E-S0 | -2.589 | 12.13 | ||
| NGC5291 | 1 | 13 | 47 | 24 | -30 | 24 | 27 | E | -3.940 | 13.64 | ||
| ABCG1795 | 7 | 13 | 48 | 52 | 26 | 35 | 35 | cD-S0 | 15.20 | 1.00 | .44 | |
| AOO Z 13502+0022 | 1 | 13 | 52 | 44 | 00 | 07 | 51 | Sm | 9.000 | 15.43 | 0.65 | |
| MCG +04-33-038 | 1 | 14 | 01 | 09 | 21 | 14 | 15 | S? | 3.400 | 15.04 | ||
| NGC5398 | 3 | 14 | 01 | 21 | -33 | 03 | 46 | SBd | 7.836 | 13.84 | ||
| AOO TOL 41 | 1 | 14 | 02 | 59 | -30 | 14 | 25 | EmLS | 18.00 | |||
| NGC5457 | 6 | 14 | 03 | 13 | 54 | 21 | 03 | SBc | 5.944 | 8.20 | 0.45 | |
| NGC5408 | 5 | 14 | 03 | 21 | -41 | 22 | 35 | Irr | 9.918 | 12.21 | 0.56 | -0.33 |
| AOO 1401+114 | 1 | 14 | 03 | 24 | 11 | 09 | 14 | |||||
| MCG +02-36-0024 | 1 | 14 | 03 | 27 | 09 | 27 | 57 | Sbc | 4.005 | 14.67 | ||
| NGC5461 | 7 | 14 | 03 | 42 | 54 | 18 | 59 | |||||
| NGC5471 | 13 | 14 | 04 | 28 | 54 | 23 | 49 | |||||
| AOO PKS 1404-267 | 1 | 14 | 07 | 31 | -27 | 01 | 02 | E-S0 | 0.008 | 13.73 | ||
| NGC5670 | 2 | 14 | 35 | 37 | -45 | 57 | 58 | S0 | -2.010 | 12.96 | 1.00 | 0.50 |
| IC4448 | 1 | 14 | 40 | 28 | -78 | 48 | 37 | SBd | 7.670 | 14.06 | 0.58 | -0.14 |
| MRK288 | 1 | 14 | 50 | 47 | 73 | 49 | 24 | S? | 4.900 | 15.70 | ||
| MCG +06-33-0004 | 3 | 14 | 50 | 57 | 35 | 34 | 17 | Sd | 8.000 | 14.77 | 0.26 | -0.72 |
| ABCG1991 | 2 | 14 | 54 | 32 | 18 | 38 | 24 | E | -4.817 | 15.29 | ||
| NGC5846 | 1 | 15 | 06 | 29 | 01 | 36 | 25 | E | -4.677 | 10.98 | 1.01 | 0.48 |
| AOO CASEG 657 | 1 | 15 | 12 | 13 | 47 | 16 | 31 | 16.30 | ||||
| QSO 1514+072 | 2 | 15 | 16 | 44 | 07 | 01 | 16 | E? | -2.025 | 14.52 | ||
| MRK487 | 1 | 15 | 37 | 04 | 55 | 15 | 47 | E | -5.000 | 15.46 | 0.50 | -0.41 |
| NGC5996 | 2 | 15 | 46 | 59 | 17 | 53 | 08 | Sc | 5.339 | 13.01 | 0.42 | -0.25 |
| MRK492 | 1 | 15 | 58 | 44 | 26 | 48 | 51 | E-S0 | -2.633 | 14.86 | 0.83 | 0.22 |
| NGC6052 | 3 | 16 | 05 | 13 | 20 | 32 | 38 | Sc | 5.058 | 13.45 | 0.44 | -0.43 |
| NGC6062 | 4 | 16 | 06 | 23 | 19 | 46 | 44 | SBbc | 3.833 | 14.23 | 0.58 | -0.17 |
| NGC6090 | 1 | 16 | 11 | 40 | 52 | 27 | 21 | Sab | 1.700 | 14.49 | ||
| NGC6166 | 5 | 16 | 28 | 38 | 39 | 33 | 04 | E | -4.327 | 12.86 | 1.00 | |
| MRK499 | 1 | 16 | 48 | 24 | 48 | 42 | 23 | Im | 14.60 | |||
| NGC6340 | 1 | 17 | 10 | 26 | 72 | 18 | 22 | S0-a | 0.396 | 11.95 | 0.87 | |
| AOO AM 1724-622 | 1 | 17 | 29 | 09 | -62 | 26 | 43 | S0-a | -1.000 | 12.68 | ||
| NGC6500 | 1 | 17 | 55 | 59 | 18 | 20 | 26 | Sab | 1.621 | 13.01 | ||
| AOO FRL 44 | 1 | 18 | 13 | 39 | -57 | 43 | 58 | S? pec | ||||
| ESOB338-IG4 | 15 | 19 | 27 | 58 | -41 | 34 | 28 | pec | 13.42 | 0.29 | -0.41 | |
| NGC6822 | 7 | 19 | 44 | 58 | -14 | 48 | 11 | Irr | 9.777 | 9.33 | ||
| ESOB185-IG13 | 1 | 19 | 45 | 01 | -54 | 15 | 03 | compact | 15.00 | 0.19 | -0.17 | |
| NGC6868 | 1 | 20 | 09 | 54 | -48 | 22 | 44 | E | -4.447 | 11.61 | 1.01 | 0.62 |
| AOO AM 2020-504 | 4 | 20 | 23 | 56 | -50 | 39 | 06 | pec ring ? | ||||
| ESOB462-IG20 | 1 | 20 | 26 | 57 | -29 | 07 | 06 | E | -4.000 | 14.60 | ||
| NGC6946 | 2 | 20 | 34 | 52 | 60 | 09 | 15 | SBc | 5.938 | 9.58 | 0.81 | |
| ESOB400-G43 | 1 | 20 | 37 | 42 | -35 | 29 | 11 | 14.28 | ||||
| NGC7083 | 2 | 21 | 35 | 45 | -63 | 54 | 17 | Sbc | 4.006 | 11.89 | 0.65 | 0.02 |
| NGC7173 | 1 | 22 | 02 | 04 | -31 | 58 | 25 | E | -4.173 | 13.14 | 0.93 | 0.47 |
| NGC7176 | 1 | 22 | 02 | 09 | -31 | 59 | 25 | E | -4.644 | 12.42 | ||
| NGC7196 | 2 | 22 | 05 | 55 | -50 | 07 | 11 | E | -4.764 | 12.63 | 0.94 | 0.47 |
| NGC7233 | 3 | 22 | 15 | 49 | -45 | 50 | 51 | S0-a | 0.371 | 13.53 | 0.62 | -0.01 |
| NGC7250 | 3 | 22 | 18 | 18 | 40 | 33 | 45 | Sd | 7.960 | 13.20 | 0.64 | -0.04 |
| NGC7252 | 2 | 22 | 20 | 45 | -24 | 40 | 41 | S0 | -2.026 | 13.47 | 0.67 | 0.20 |
| NGC7412 | 5 | 22 | 55 | 45 | -42 | 38 | 28 | SBb | 3.327 | 11.91 | 0.53 | 0.02 |
| NGC7513 | 3 | 23 | 13 | 13 | -28 | 21 | 34 | SBb | 3.118 | 12.71 | 0.76 | 0.12 |
| MCG -07-47-023 | 2 | 23 | 13 | 59 | -42 | 43 | 39 | E | -3.873 | 15.51 | ||
| NGC7552 | 4 | 23 | 16 | 11 | -42 | 35 | 01 | SBab | 2.385 | 11.20 | 0.69 | 0.10 |
| NGC7609 B | 2 | 23 | 19 | 31 | 09 | 30 | 10 | Sd | 8.462 | 16.00 | ||
| NGC7648 | 1 | 23 | 23 | 54 | 09 | 40 | 04 | S0 | -1.941 | 13.77 | 0.81 | 0.28 |
| ABCG2597 | 1 | 23 | 25 | 20 | -12 | 07 | 27 | E | 16.32 | |||
| NGC7673 | 2 | 23 | 27 | 42 | 23 | 35 | 24 | Sc | 4.950 | 13.10 | 0.41 | -0.33 |
| AOO Z 2327.6+251 | 2 | 23 | 30 | 09 | 25 | 31 | 43 | SB+S0 | 15.06 | |||
| NGC7714 | 5 | 23 | 36 | 15 | 02 | 09 | 18 | SBb | 3.106 | 12.98 | 0.52 | -0.44 |
| ABCG2626 | 1 | 23 | 36 | 30 | 21 | 08 | 48 | Sc | 5.056 | 15.31 | ||
| ABCG2634 | 1 | 23 | 38 | 30 | 27 | 01 | 51 | E | -4.100 | 13.47 | 1.05 | 0.49 |
| NGC7771 | 2 | 23 | 51 | 25 | 20 | 06 | 49 | SBa | 1.050 | 13.07 | 0.83 | 0.34 |
| NGC7793 | 6 | 23 | 57 | 49 | -32 | 35 | 24 | Scd | 7.429 | 9.70 |
Note. — The positional information is for J2000. It is presented in columns 3, 4, 5 (Right Ascension), and 6, 7, 8 (Declination).
| IUE ID | Image ID | h | m | s | ∘ | ’ | ” |
|---|---|---|---|---|---|---|---|
| IC1586 | SWP27190 | 00 | 45 | 17.3 | 22 | 06 | 05.2 |
| NGC584 | SWP24973 | 01 | 28 | 50.8 | -07 | 07 | 28.6 |
| MRK600 | SWP22347 | 02 | 48 | 27.2 | 04 | 14 | 53.9 |
| NGC1404 | SWP09189 | 03 | 36 | 57.5 | -35 | 45 | 19.9 |
| NGC1404 | LWR07958 | 03 | 36 | 57.6 | -35 | 45 | 20.1 |
| MRK7 | SWP11139 | 07 | 22 | 20.0 | 72 | 40 | 33.5 |
| NGC3125 | LWR09894 | 10 | 04 | 18.3 | -29 | 41 | 26.5 |
| MRK153 | SWP17314 | 10 | 46 | 04.5 | 52 | 36 | 02.3 |
| MRK1267 | LWP01769 | 10 | 50 | 28.3 | 04 | 53 | 51.8 |
| MCG +03-30-0066 | SWP33212 | 11 | 41 | 13.4 | 20 | 14 | 36.7 |
| NGC3995 | LWR12534 | 11 | 55 | 09.9 | 32 | 34 | 23.6 |
| NGC4194 | SWP22784 | 12 | 11 | 41.6 | 54 | 48 | 16.9 |
| NGC4194 | LWP03412 | 12 | 11 | 41.7 | 54 | 48 | 17.7 |
| NGC4244 | SWP20476 | 12 | 15 | 04.3 | 38 | 04 | 38.9 |
| MRK209 | LWP12696 | 12 | 23 | 50.7 | 48 | 46 | 05.7 |
| NGC4566 | LWR14420 | 12 | 33 | 40.3 | 54 | 29 | 50.7 |
| NGC5044 | SWP41960 | 13 | 12 | 43.6 | -16 | 07 | 42.9 |
| MRK66 | SWP24384 | 13 | 23 | 58.5 | 57 | 30 | 54.2 |
| MCG +02-36-0024 | SWP32987 | 14 | 00 | 59.2 | 09 | 42 | 39.3 |
| MCG +02-36-0004 | LWR09826 | 14 | 48 | 54.9 | 35 | 46 | 34.1 |
| NGC7250 | SWP11227 | 22 | 16 | 09.1 | 40 | 18 | 43.4 |
| NGC7250 | LWR09846 | 22 | 16 | 09.0 | 40 | 18 | 42.6 |
| NGC7673 | LWR09760 | 23 | 25 | 11.8 | 23 | 18 | 59.4 |
Note. — The positional information is for J1950, in order to match the coordinate system of the INES header. For the following images no information on the guide star was stored: SWP04207 (NGC520), LWR14561 (NGC2784), LWR13025 (NGC4125), LWR10631 (NGC4500), SWP07918 (NGC5471), SWP07936 (MCG +06-33-0004), SWP07303 (NGC7673).