Phototmetry of V1062 Tau: low states, short outbursts, and period-switching
Abstract
Time resolved photometry of the long-period intermediate polar V1062 Tau confirmed the presence of the previously reported orbital and spin periods, and revealed the presence of a third one, corresponding to the beat of the two. While the orbital periodicity was present throughout our data, only one of the shorter periods was detectable at any given time. On a time-scale of 90 days, the short-period modulation in the light curve of the star changed three times between the spin period and the beat. On longer time-scales, we report two outbursts of V1062 Tau (the first to be recorded for this object) – both of which were probably short, low-amplitude ones ( mag). Our data also suggest a brief low state phase in 2002 January. Thus, this system joins two exclusive groups of intermediate polars: those undergoing short outbursts, and those having low states.
We propose that the alternations between the short periods that modulate the light curve were caused by changes in the accretion mode, from disc-fed accretion, to disc-overflow accretion. We further suggest that these changes may have been triggered by changes in mass-transfer rate, which were manifested by the low-state/outburst activity of the system.
keywords:
accretion, accretion discs – stars: individual: V1062 Tau – novae, cataclysmic variables.1 Introduction
Intermediate polars (IPs) are a subclass of Cataclysmic Variables (CVs) having a white dwarf, the magnetic field of which is strong enough to control (at least partially) the accretion flow from the secondary star, but is not strong enough to synchronize the spin of the primary star with the orbital revolution (for a review of IPs see e.g. Patterson 1994; Warner 1995; Hellier 1995; Hellier 1996).
A prominent observational characteristic of IPs is multiple periodicities in the light curve, which may be modulated by the spin and orbital periods, and a myriad of combinations of the two.
The intermediateness of the IPs, between the non-magnetic CVs and the strongly-magnetic polars, makes this class a diverse one, which includes stars with a wide range of asynchronism and magnetic-field strengths. The diversity of the class is further enhanced by the few accretion modes found in IPs. While most systems are predominantly disc-fed, some accrete predominantly in the disc-overflow mode (Hellier 1995) and one object is a discless, stream-fed IP.
V1062 Tau (1 H 0459+248) was discovered with the HEAO 1 Scanning Modulation Collimator (A3 experiment) and the Large-Area Sky Survey (A-1 experiment). A low-resolution spectrum with EXOSAT indicated that the source is a cataclysmic variable (Remillard et al. 1994, hereafter R94). The optical counterpart was identified as a UV-bright star, with spectral features characteristic of a cataclysmic variable. Time-resolved observations revealed two periodicities: a h period detected in optical photometry was suggested to be the orbital period of the underlying binary system (; we note, however that confirmation by radial velocity measurements is required). Another periodicity, min, which was detected both in X-ray and in the optical band, was naturally interpreted as the spin period () of the magnetic white dwarf in an intermediate polar system (R94). Further X-ray observations with ASCA and RXTE confirmed the suggested classification of the system, and refined the spin period to min (Hellier, Beardmore & Mukai 2002).
Here we report on the results of a photometric campaign of V1062 Tau in 2002 and 2003, during which the object exhibited unusual activity both on short time scales and on long ones
2 Observations and data reduction
We conducted time-resolved photometry of V1062 Tau during 21 nights in 2001 Dec – 2002 March. Additional 10 nights of time-resolved photometry, and about three dozen snapshots were recorded in 2002 August – 2003 March. Most of the observations were conducted from the Wise Observatory in Israel (WO), using the Tektronix 1K back-illuminated CCD mounted on the 1-m telescope (a description of the telescope and the instrumentation is given in Kaspi et al. 1995).
Our first run was a combined two-site operation with the Wisconsin Indiana Yale NOAO (WIYN) 0.9-m telescope at the Kitt Peak National Observatory (KPNO) in Arizona, USA. The detector of the WIYN 0.9-m was the 2KSB CCD (see the WIYN 0.9-m internet page at http://www.noao.edu/0.9m/ for details about the telescope and CCD). The long temporal base-line between the two observatories allowed us to achieve superior coverage in this run, as long as 20 h a day. The nearly continuous coverage proved particularly useful for the analysis of V1062 Tau because of its long orbital period and the presence of additional periodicities in its light curve.
Photometry was conducted mostly through the filter. A number of images were taken in . A few snapshots in and were also recorded. A journal of our observations is given in appendix A.
Photometric measurements on the bias-subtracted and flat-field corrected images were performed using the NOAO IRAF111IRAF (Image Reduction and Analysis Facility) is distributed by the National Optical Astronomy Observatories, which are operated by AURA, Inc., under cooperative agreement with the National Science Foundation. daophot package (Stetson 1987). Instrumental magnitudes of V1062 Tau, as well as of a dozen or so reference stars (depending on image quality), were measured in each frame. We used the WO reduction program daostat (Netzer et al. 1996) to obtained a set of internally consistent magnitudes of the object in each of the two data subsets acquired, by minimizing the scatter of the reference stars over each subset. We Cross-calibrated of the two subsets by setting the instrumental magnitudes of seven comparison stars to be the same in both subsets. Because of a possible difference in the spectral sensitivity of the two instruments used, this procedure may introduce some second-order systematic errors. From measurements of the common reference stars, we estimate this systematic effect to be less than mag. Finally, to transform our set of instrumental magnitudes to true ones, we calibrated the reference stars using the photometric standards of Landolt (1992). The systematic error of the transformation is estimated to be less than mag.
3 Results
3.1 Long-term variations
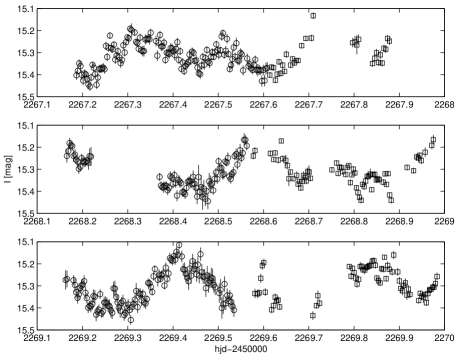
The -band light curve of V1062 Tau during 2001 December – 2003 April is shown in figure 1. A detailed view of three segments of the light curve is given in Fig. 2. The light curve exhibits 0.2 mag modulations on a time-scale of 10 h, and weaker modulations on a time-scale of 1 h. On longer time-scales, the object maintains constant brightness, apart for three notable events.
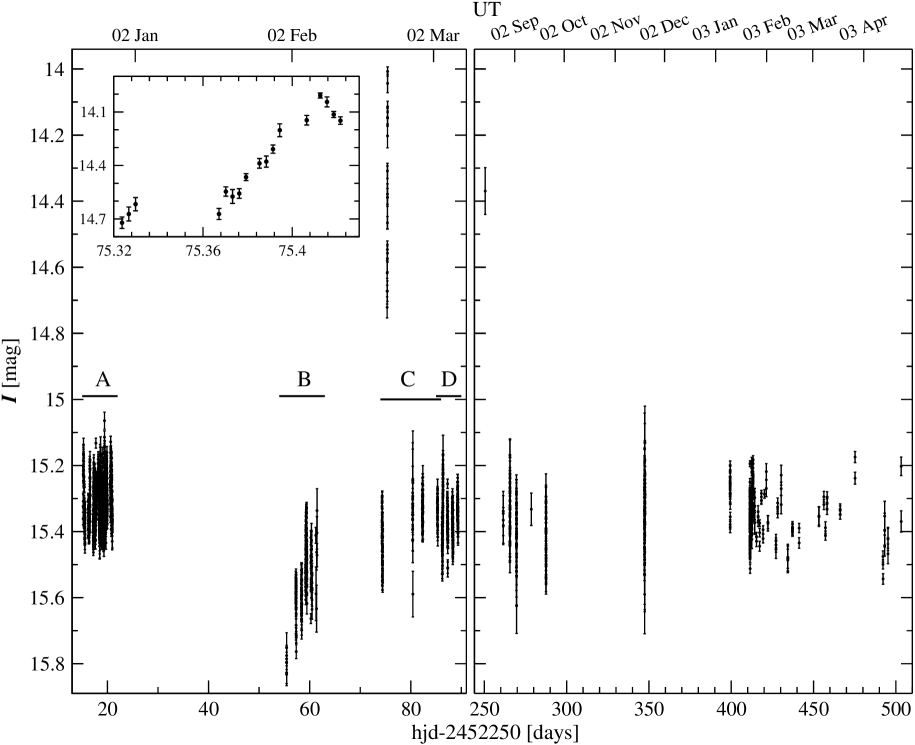
On 2002 January 30 the star was mag fainter than in the preceding observations, 34 days before. Over the following 50 nights, the star gradually brightened, and nearly returned to its brightness state of early 2002 January (Fig. 1). The rising trend of the light curve in February suggests a brief low state of the star in 2002 January.
On 2002 February 19, V1062 Tau was in outburst ( mag). In subsequent observations five days later, the star was back in its normal brightness level (Fig. 1). The outburst light curve is presented in figure 1 (inset). The ending section of the outburst light curve is a 0.14 mag decline, which is greater than the typical flickering of the light curve, and is not phased with any of the system’s periodicities. This decline is therefore interpreted as beginning of the decline from outburst maximum, making it a short ( days), and weak outburst ( mag).
Another outburst was detected in a snapshot taken on 2002 August 13, wherein the star was 0.8 mag brighter than its normal state (Fig. 1). The brighter state of the object was confirmed by a manual inspection of the outburst frame. The isolated observation does not allow us to set limits on the amplitude or the duration of this outburst.
3.2 Period analysis
A power spectrum (PS, Scargle 1982) of the 2001-2002 light curve reveals three independent periodicities in the data (Fig. 3). Two of the signals, the orbital period and the spin period were previously reported by R94. The third one, corresponding the first orbital sideband of the spin, (synodic period of the system) is reported here for the first time.
The lower end of the PS (Fig. 3) is dominated by the fundamental frequency of at h, and by its first and third harmonics. The high end of the PS features , at min, and the orbital side band, min.
The quoted periods were derived by finding a minimum of for a simultaneous fit of three periodicities (see Lipkin et al. 2001 for details of the analysis method). The errors are 1- confidence levels, estimated using the bootstrap method (Efron & Tibshirany 1993). The periods we derived for and agree with former measurements of the two (R94; Hellier et al. 2002).
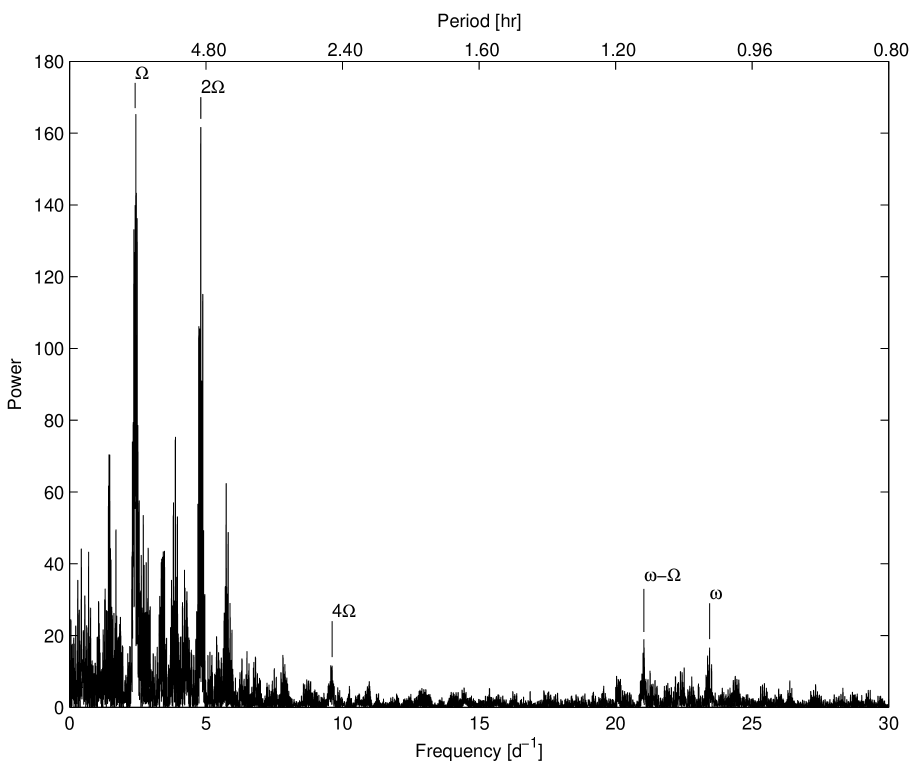
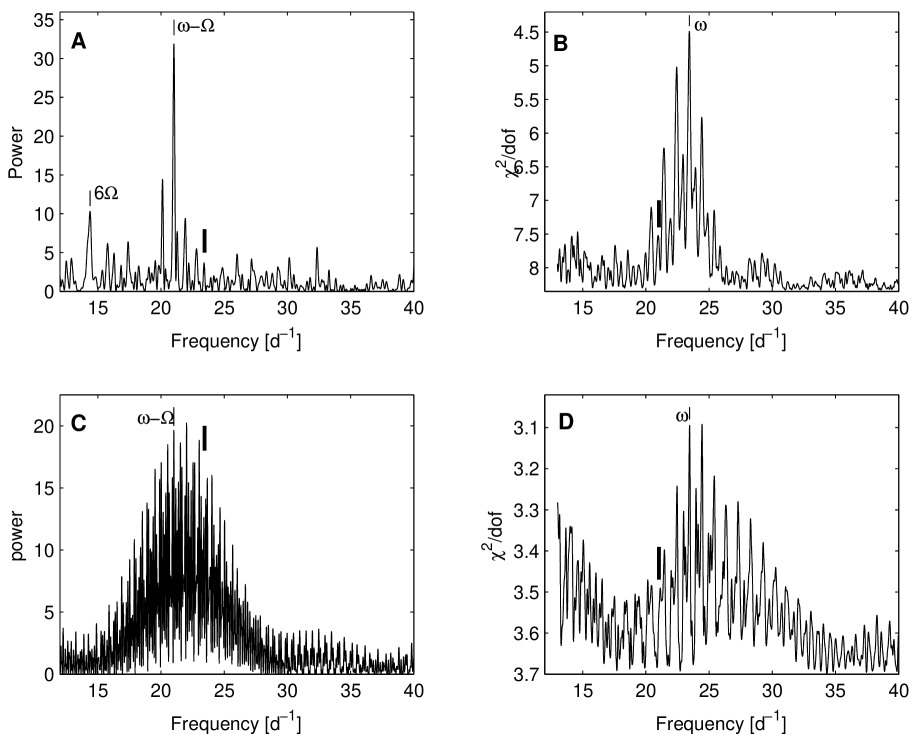
Figure 4 shows periodigrams of four subsets of our data (the subsets are marked by the letters A–D in Fig. 1. Note a 2-night overlap between sets C and D). The orbital signal is present in all four subsets. However, the datasets yield different results in the high frequency range. In Sets A and C, is detected, but is not (the upper limits for the semi-amplitude of a signal at in sets A and C are 0.005, and 0.01 mag, respectively). On the other hand, Sets B and D are dominated by the signal of , and is not detected (with an upper limit of 0.005, and 0.01 mag, respectively). Analysis of a segment of our light curve, in which a transition from to occurred (sets C and D, Fig. 1), revealed that the time-scale of the transition is two days.
Considering the changes of the short period in our data, we re-examined frequency analysis of two nights of time-resolved -band photometry in presented in R94. Using variance analysis, the authors deduced the existence of a single short periodicity in the data, at min (Fig. 11 of R94). Two shallower troughs, adjacent to the one selected by R94, were probably interpreted by these authors as 1-day aliases. However, we find that these troughs, corresponding to 61.0, and 66.7 min, are in better agreement with and , respectively. Another distinct trough, at 30.7 min, probably corresponds to the first harmonic of . We therefore conclude that during the 2 nights of R94’s observations, the star’s light was probably modulated by both and . Naturally, reanalysis of the data of R94 is required in order to verify this conclusion.
3.3 Wave Forms
The 2001 December – 2002 January light curve (set A), folded over the orbital period, and binned into 40 evenly-spaced bins is shown in Fig. 7 below (lower two frames; The signals of and were subtracted prior to the folding). The orbital waveforms which we derived in different subsets agree with the one shown in Fig. 7 (although having greater uncertainties because of the poorer sampling).
The asymmetric double-humped orbital waveform may be decomposed into a fundamental component with a semi amplitude mag, and a first harmonic with mag, which is lagging by cycle. As noted by R94, ellipsoidal variations of the secondary are likely to be the source of the first harmonic. The leading fundamental component may arise from a few different sources, such as aspect variation of a bright spot at the outer edge of the accretion disc, or reflection effect, where light from the bright spot is reflected by the secondary. A detailed analysis of the relative phases between the different components of the orbital modulation would allow us to locate the various sources taking part in the orbital modulation (e.g. the hot spot) in the binary reference frame.
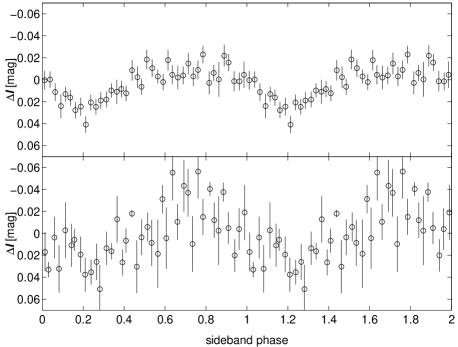
The waveform of (Fig. 5) maintained the phase and a similar symmetric shape in both subsets in which it was detected. However, the amplitude of the signal in the first set was half the amplitude in the second one (0.05 and 0.1 mag in sets A and C, respectively).
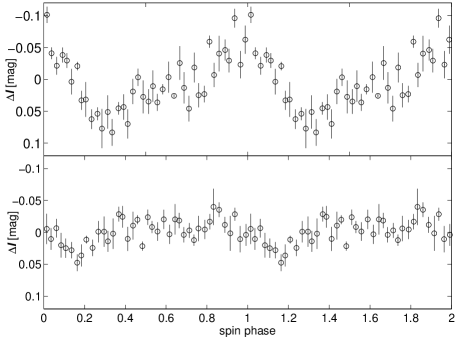
The amplitude of the spin also changed considerably between set B and set D, decreasing by half in the latter ( 0.18, and 0.09 mag, respectively, Fig. 6). The spin waveform also changed between the two sets, both in phase and shape, however the significance of these differences is questionable.
3.4 Variation of the short signals over the orbital cycle
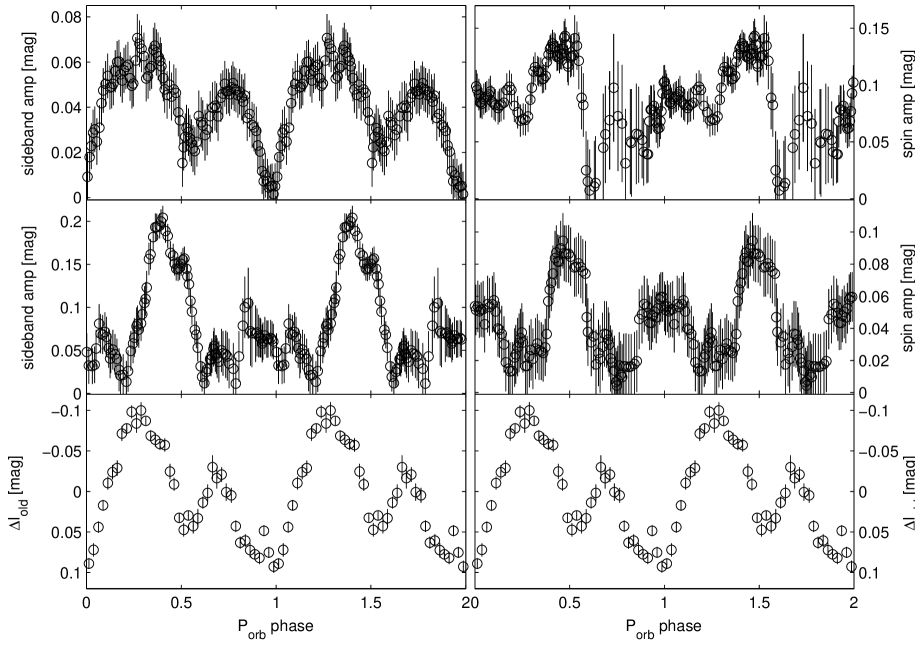
Measurements of the spin and sideband amplitudes over different orbital phases are shown in Fig. 7. The upper- and middle-left panels show the measured amplitudes of in sets A and C, respectively. The measurements of the spin amplitude in set B and set D are shown in the upper- and middle-right panels. The bottom panels show the orbital waveform, for reference use.
The amplitudes at different orbital phases were derived by fitting a sine wave to a subset of data points, located within a small phase interval about . The error bars in figure 7 are the calculated 1- errors of the fit.
The amplitude of varied strongly over the orbital cycle, acquiring a maximum value twice every orbital cycle. Indeed, the amplitude is strongly correlated with the changing brightness of the star over the orbital cycle. In set A the correlation coefficient is , and the phase lag is , whereas in set C, , and . Note the different phase lags, as well as the different amplitudes of the two sets (Fig. 7).
Similarly, measurements of the spin over different orbital phases revealed that the spin amplitude also varied strongly over the orbital phase. For the spin signal we obtained , and in set B, and , in set D.
4 Discussion
4.1 Long-term variations
Our data suggest a low state of V1062 Tau in 2002 January, only the ascent of which was observed (Sec. 3.1). In the (sparse) published material of V1062 Tau we find three additional occasions in which V1062 Tau was possibly observed in low-state. The object was observed by R94 in five different occasions between 1988 February 22 – 1990 December 11. In one (1988 February 22), the object was 3-4 times fainter. Munari, Zwitter & Bragaglia (1997) present a spectrum of the star from 1995 November 4, which yielded an integrated magnitude of – about a magnitude fainter than the star’s normal brightness level which was reported by R94. Finally, we note that R94 reported that V1062 Tau is UV bright (indeed this was the criterion by which they identified the optical counterpart of the X-ray source). A blank spectrum which was obtained after four hours of integration with IUE on 1994 November 3 (Szkody & Silber 1996) may imply a low state of the star during this epoch.
Low state are observed in all well-studied polars, as well as in many non-magnetic CVs (see Warner 1999 for a recent review of low states in CVs). However only two IPs (both with orbital periods 4 h) have been observed in low states. Low states appear to come in two types. ’slightly low’ states are brightness reduction with an amplitude 1 mag, usually having recurrence time-scales which are characteristic for each object (typically 5–10 yr). This type is observed only in non-magnetic CVs. In contrast ’very low’ states are more extreme drops in brightness, with no characteristic recurrence time-scales, occurring both in magnetic and non-magnetic CVs.
Although commonly attributed to reduced mass-transfer from the secondary star, the underlying mechanism of low states is still poorly understood. ’Very low’ states have been proposed to be the result of migration of star-spots through L1, reducing the Roche-lobe overfill of the secondary at L1 (Livio & Pringle 1994). ’Slightly low’ states may be the effect of magnetic cycles in the secondary star (see e.g. Warner 1988).
Garnavich and Szkody(1988) found in a sample of magnetic and non-magnetic CVs that for systems with orbital periods min, the magnitude difference between low- to high-state increases with . For V1062 Tau, low states are expected to be 6 mag fainter than the normal state. That out of three recorded low-states in V1062 Tau, two were observed only 1 mag fainter than its mean brightness may suggest that low states of V1062 Tau do not follow the expected trend. Alternatively, the time V1062 Tau spends in low states may be short relative to the ascension/descension times.
There are a number of IPs which undergo dwarf-nova like outbursts. However, two systems exhibit shorter, low amplitude outbursts, which are suggested to be the result of increased mass transfer from the secondary (Hellier et al. 2000; Hellier, Mukai & Beardmore 1997): V1223 Sgr (only one observed outburst, van Amerongen & van Paradijs, 1989), and TV Col (a few short outbursts, e.g. Hellier & Buckley, 1993). Another IP, EX Hya, shows outbursts on intermediate time scales ( d; Hellier et al. 2000)). It is yet unclear whether these events are the result of disc-instabilities, or mass-transfer enhancements (Hellier et al. 2000).
The 2002 February 19 outburst of V1062 Tau, which was only partially recorded (Sec. 3.1), should probably be classified as a short burst. The 0.14 mag decline at ending section of the outburst light curve probably marked the start of the decline from maximum brightness (Fig. 1, inset). Additionally, the upper limit for the duration of the 2002 February outburst is d – less that half the expected duration for a dwarf nova-like outburst of a 10 h CV (Warner, 1995). The outburst of 2002 August 13, which was recorded only by a single snapshot, is also consistent with a short-type burst (Sec. 3.1). Therefore, V1062 Tau is probably a new member in the exclusive group of IPs having short outbursts.
Finally, the different characteristics of the outburst of 2002 February 19, and of the 2002 Jan low state suggest that the two are caused by different instability mechanisms in the secondary star. The superposition of the short outburst on the recovering branch of the low state present a remarkable interplay between the two different instabilities.
4.2 Short-term signals
During 2001 December – 2002 March V1062 Tau oscillated with either the spin, or the orbital sideband period, switching three times between the two. The transition time-scale between these two modes was 2 d. The characteristic time scale for maintaining a period was 5–25 d (Sec. 3.2). The amplitude of both periods was correlated with the orbital phase, with different phase lags in the different subsets.
Modulations at the spin period are the signature of a disc-fed IP system. Possible sources of such variations are aspect variation of the accretion zone (e.g. Hellier et al. 1987), or reprocessing of X-ray emission in axisymmetric regions of the disc, either the inner edge of the magnetically-truncated disc, and/or the outer rim of a concave disc (Warner 1986). Sideband modulations may also occur in disc-fed systems, arising from reprocessing of X-ray light in fixed locations in the binary reference frame: the secondary star (Patterson & Price 1981), and/or the bright spot bulge on the outer rim of the accretion disc (Hassall et al. 1981). In predominantly stream-fed IPs, optical sideband modulations may also arise from the accretion stream flipping between the magnetic poles twice every synodic cycle.
The detection of both and in the -band light curve of V1062 Tau, and the absence of both in (see Sec. 3.2 and Fig. 11 of R94), suggest that the source of the two signals is more likely to be reflection rather than emission from the hotter accretion region. The strong variation of the amplitude of both signals over the orbital cycle (sec. 3.4, Fig. 7) also supports reflection as the source of the modulations. Had these variations emanated from the accretion region of the CV system, strong variability of the amplitudes of the short periodicities would require the obscuration of most of this inner region during some part of the orbital cycle. However the orbital wave form is hardly an eclipsing one. If the accretion region is not obscured, any flux modulations it may exhibit should not be affected by the orbital cycle. Thus, measured in magnitude units, changes in the amplitude of such modulations over orbital cycle should only reflect the varying relative contribution of the fixed signal the to the changing total brightness of the system. This is hardly the case in V1062 Tau (Fig. 7). Finally, the changes in the characteristics of the short signals between different data sets (Fig. 7) would be difficult to account for if these variation are emission from the accretion region.
On the other hand, a simple reflection model also seems insufficient to account for the properties of the short-term modulations. In particular, the changes between the different data sets and the form of the amplitude dependence on the orbital phase introduce similar difficulties when ascribing the short periodicities to reflection.
The transitions between and imply changes in the accretion mode and/or in the geometry of the system. A similar effect had been observed in the X-ray light of TX Col – a long period IP ( h), in which both the spin and the sideband are observable. The relative intensities of the two signals were found to vary by an order of magnitude over a typical time-scale of 1 month (Buckley & Tuohy 1989; Norton et al. 1997; Wheatley 1999). Changes in the relative power of the sideband signal were also observed in FO Aqr (Beardmore et al. 1998), AO Psc, V1223 Sgr and BG CMi (e.g. Hellier 1998). Such changes are usually attributed to variable amounts of disc- and disc-overflow accretion. The cause of such transitions is not clear. X-ray observations of TX Col suggest that periods of enhanced disc-overflow are related to decreased (Wheatley 1999). However changes in the accretion mode may also be driven by various mechanisms in the binary system which are not related to changes in (see, e.g., Norton et al. 1997).
The period switching which we observed in the optical light of V1062 Tau may also reflect changes in the accretion mode, between predominantly disc-accretion and predominantly disc-overflow accretion. The exclusive appearance of the two signals may imply that during periods of predominantly disc-overflow accretion, disc-accretion became negligible or ceased completely, making the disc a ’nonaccretion-disc’ during these periods (see King & Lasota 1991). The average brightness of V1062 Tau was not considerably different during periods in which the system’s light was modulated by different a short-period modulation (see Fig. 1; particularly, the average brightness of set C and that of set D are indistinguishable). However, we note the close coincidence of period switching events with the low-state/outburst activity of the star: one transition from to coincided with the apparent low state of 2002 Jan, and another occurred shortly after the short outburst of 2002 February 19.
Period switching may also be caused as a result of changes in scale-height of the accretion disc, if both short signals emanate from reprocessed light (e.g. the beat is reflection from the bright spot bulge and/or from the secondary star, and the spin is reflection from the outer rim of a concave disc). Orbital sideband modulations would occur during periods when the accretion disc is thin. Conversely, when the disc rim thickens considerably (e.g. following changes in mass-transfer rate from the secondary), it may obscure the secondary star, and the axi-symmetric outer rim of the disc would become the main source of reflection, varying at the spin period. It would be hard, however to reconcile such a change in the accretion disc with the stable average magnitude of V1062 Tau over the periods of changing short modulation.
5 Summary
-
1.
We report two outbursts of V1062 Tau, the first to be reported for this object. One, and possibly both bursts are short, low amplitude ones. V1062 Tau is thus a member of the exclusive group of IPs harboring short bursts.
-
2.
Our observations and previously published data imply four different low state events of V1062 Tau. Only two other IPs, both with much shorter orbital periods, are known to have low states.
-
3.
During 2002 December – 2003 March, the light of V1062 Tau was modulated by the orbital period and either of two short periods: , and . during our observations the star switched three times between the two short period. Our data suggests that the time-scale of transition is 2 d.
-
4.
We suggest that a likely mechanism for the transition between the two short periods is temporal changes in the accretion mode, changing between disc-fed, and disc-overflow accretion.
Acknowledgments
This work is supported by grants from the Israel Science Foundation. YML is grateful to the Dan-David prize foundation for financial support.
References
- (1) Beardmore A. P., Mukai K., Norton A. J., Osborne J. P., Hellier C., 1998, MNRAS, 297, 337
- (2) Buckley D. A. H., Tuohy I. R., 1989, ApJ, 344, 376
- Efron & Tibshirani (1993) Efron, B., Tibshirani, R. J. 1993, An Introduction to the Bootstrap, Chapman & Hall
- (4) Garnavich P., Szkody P., 1988, PASP, 100, 1522
- (5) Hassall B. J. M. et al., 1981, MNRAS, 197, 275
- (6) Hellier C., 1995, in Buckley D. A. H., Warner B., eds., Cape Workshop on Magnetic Cataclysmic Variables. ASP Conf. Ser., Vol. 85. Astron. Soc. Pac., San Francisco, p. 185
- (7) Hellier C., 1996, in Evans N., Wood J.H., eds., Proc. IAU Colloq. 158, Cataclysmic Variables and Related Objects. Kluwer, Dordrecht, p. 143
- (8) Hellier C., 1998, Adv. Space Res., 22, 973
- (9) Hellier C., Buckley D. A. H., 1993, MNRAS, 265, 766
- (10) Hellier C., Mukai K., Beardmore A. P., 1997, MNRAS, 292, 397
- (11) Hellier C., Mason K. O., Rosen S. R., Cordova F. A., 1987, MNRAS, 228, 463
- (12) Hellier C., Kemp J., Naylor T., Bateson F. M., Jones A., Overbeek D., Stubbings R., Mukai K., 2000, MNRAS, 313, 703
- (13) Hellier C., Beardmore A. P., Mukai K., 2002, A&A, 389, 904
- (14) Kaspi S., Ibbetson P. A., Mashal E., Brosch N., 1995, Wise Obs. Tech. Rep., No 6
- (15) King A. R., Lasota J., 1991, ApJ, 378, 674
- Landolt (1992) Landolt A. U., 1992, AJ, 104, 340
- (17) Lipkin Y., Leibowitz E. M., Retter A., Shemmer O., 2001, MNRAS, 328, 1169
- (18) Livio M., Pringle J. E., 1994, ApJ, 427, 956
- (19) Munari U., Zwitter T., Bragaglia A., 1997, A&AS, 122, 495
- Netzet et al. (1996) Netzer H., Heller A., Loinger F., Alexander T., Baldwin J. A., Wills B.J., Han M., Frueh M., Higdon L., 1996, MNRAS, 279, 429
- (21) Norton A. J., Hellier C., Beardmore A. P., Wheatley P. J., Osborne J. P., Taylor P., 1997, MNRAS, 289, 362
- (22) Patterson J., 1994, PASP, 106, 209
- Patterson & Price (1981) Patterson J., Price C. M., 1981, ApJ, 243, L83
- (24) Remillard R. A., Bradt H. V., Brissenden R. J. V., Buckley D. A. H., Schwartz D. A.,Silber A., Stroozas B. A., Tuohy I. R., 1994, ApJ, 428, 785
- (25) Scargle J.D., 1982, ApJ, 263, 835
- (26) Szkody P., Silber A., 1996, AJ, 112, 289
- (27) Stetson P. B., 1987, PASP, 99, 191
- (28) van Amerongen S., van Paradijs J., 1989, A&A, 219, 195
- (29) Warner B., 1986, MNRAS, 219, 347
- (30) Warner B., 1988, Nat, 336, 129
- (31) Warner B., 1995, Cataclysmic Variable Stars. Cambridge University Press, Camebridge
- (32) Warner B., 1999, in C. Hellier, K. Mukai, eds., ASP. Conf. Ser. Vol. 157, Annapolis Workshop on Magnetic Cataclysmic Variables. Astron. Soc. Pac., San Francisco, p. 63
- Wheatley (1999) Wheatley P. J., 1999, in C. Hellier, K. Mukai, eds., ASP. Conf. Ser. Vol. 157, Annapolis Workshop on Magnetic Cataclysmic Variables. Astron. Soc. Pac., San Francisco, p. 47
Appendix A Log of observations
| UT | Time of Start | Run Time | Points per Filter | |||
|---|---|---|---|---|---|---|
| Date | (HJD-2452200) | (h) | I | B | V | R |
| 20011221 | 65.18 | 9.85 | 55 | 55 | ||
| 20011222 | 66.17 | 10.01 | 43 | 43 | ||
| 20011223 | 67.18 | 10.12 | 140 | |||
| 20011223 | 67.61 | 6.34 | 39 | (WIYN0.9m) | ||
| 20011224 | 68.16 | 9.54 | 87 | |||
| 20011224 | 68.58 | 9.56 | 74 | (WIYN0.9m) | ||
| 20011225 | 69.16 | 9.99 | 135 | |||
| 20011225 | 69.81 | 9.66 | 74 | (WIYN0.9m) | ||
| 20011226 | 70.58 | 9.67 | 97 | (WIYN0.9m) | ||
| 20020130 | 104.43 | 0.36 | 6 | |||
| 20020201 | 107.25 | 2.29 | 33 | |||
| 20020202 | 108.35 | 2.13 | 31 | |||
| 20020203 | 109.19 | 6.25 | 89 | |||
| 20020204 | 110.22 | 6.23 | 28 | 28 | ||
| 20020205 | 111.21 | 5.91 | 11 | 8 | ||
| 20020218 | 124.31 | 3.17 | 45 | |||
| 20020219 | 125.32 | 2.35 | 23 | |||
| 20020224 | 130.36 | 1.44 | 21 | |||
| 20020226 | 132.27 | 3.29 | 46 | |||
| 20020301 | 135.24 | 2.11 | 23 | 2 | 2 | |
| 20020302 | 136.20 | 4.50 | 61 | |||
| 20020303 | 137.23 | 2.63 | 38 | |||
| 20020304 | 138.20 | 3.93 | 56 | |||
| 20020305 | 139.22 | 3.14 | 45 | |||
| 20020318 | 152.26 | 0.16 | 1 | 1 | 1 | |
| 20020813 | 300.56 | 0.07 | 1 | |||
| 20020824 | 311.51 | 0.69 | 9 | |||
| 20020828 | 315.52 | 1.99 | 29 | |||
| 20020901 | 319.49 | 2.84 | 32 | |||
| 20020910 | 328.55 | 0.08 | 1 | 1 | ||
| 20020919 | 337.44 | 1.77 | 26 | |||
| 20020926 | 344.57 | 0.07 | 1 | |||
| 20021118 | 397.27 | 7.32 | 84 | |||
| 20030109 | 449.34 | 1.05 | 16 | |||
| 20030120 | 460.27 | 0.15 | 3 | |||
| 20030121 | 461.31 | 4.83 | 60 | 1 | 1 | |
| 20030122 | 462.41 | 2.67 | 33 | 1 | 1 | |
| 20030123 | 463.23 | 3.63 | 15 | 1 | 1 | |
| 20030124 | 464.24 | 1.19 | 6 | 1 | 3 | |
| 20030125 | 465.33 | 0.07 | 2 | |||
| 20030126 | 466.31 | 0.14 | 3 | |||
| 20030127 | 467.26 | 0.14 | 3 | |||
| 20030128 | 468.32 | 0.14 | 3 | |||
| 20030129 | 469.34 | 0.08 | 2 | |||
| 20030130 | 470.19 | 0.33 | 1 | 1 | 1 | 1 |
| 20030131 | 471.32 | 0.08 | 2 | |||
| 20030201 | 472.30 | 0.08 | 2 | |||
| 20030206 | 477.19 | 0.16 | 3 | |||
| 20030207 | 478.21 | 0.18 | 3 | |||
| 20030209 | 480.34 | 0.23 | 3 | |||
| 20030213 | 484.36 | 0.14 | 3 | |||
| 20030216 | 487.18 | 0.15 | 3 | |||
| 20030220 | 491.24 | 0.08 | 2 | |||
| 20030304 | 503.28 | 0.08 | 2 | |||
| 20030307 | 506.26 | 0.08 | 2 | |||
| 20030308 | 507.22 | 0.08 | 2 | |||
| 20030309 | 508.24 | 0.14 | 3 | |||
| 20030317 | 516.20 | 0.14 | 6 | |||
| 20030326 | 525.24 | 0.15 | 3 | |||
| 20030412 | 542.22 | 0.17 | 3 | |||
| 20030413 | 543.21 | 0.16 | 3 | |||
| 20030415 | 545.21 | 0.15 | 3 | |||
| 20030423 | 553.23 | 0.51 | 2 | 1 | 1 | 1 |
| 20030424 | 554.21 | 0.15 | 3 | |||