11email: jorge.iglesias,veronique.buat,jose.donas,alessandro.boselli,bruno.milliard@oamp.fr
UV and FIR selected samples of galaxies in the local Universe
We have built two samples of galaxies selected at 0.2m (hereafter UV) and 60 m (hereafter FIR) covering a sky area of 35.36 deg2. The UV selected sample contains 25 galaxies brighter than . All of them, but one elliptical, are detected at 60 m with a flux density larger or equal to 0.2 Jy. The UV counts are significantly lower than the euclidean extrapolation towards brighter fluxes of previous determinations. The FIR selected sample contains 42 galaxies brighter than =0.6 Jy. Excepting four galaxies, all of them have a UV counterpart at the limiting magnitude mag. The mean extinction derived from the analysis of the FIR to UV flux ratio is mag for the UV selected sample and mag for the FIR selected one. For each sample we compare several indicators of the recent star formation rate (SFR) based on the FIR and/or the UV emissions and we find linear relationships with slopes close to unity, meaning that no trend with the SFR exists when converting between each other. Various absolute calibrations for both samples are discussed in this paper. A positive correlation between extinction and SFR is found when both samples are considered together although with a considerable scatter. A similar result is obtained when using the SFR normalized to the optical surface of the galaxies.
Key Words.:
ISM: dust extinction – ultraviolet: galaxies – infrared: galaxies1 Introduction
Tracing the star formation activity in galaxies at all redshifts is a fundamental step towards the understanding of the formation and evolution of the Universe. The star formation activity is commonly quantified by the Star Formation Rate (SFR) defined as the stellar mass formed per unit of time. In order to efficiently constrain the models of galaxy formation and evolution it is important to measure a SFR as current as possible in order not to integrate on too large lookback times. Quite naturally, the light emitted by young stars can be used to measure this SFR. The most commonly used tracers of the SFR in galaxies, at least in the nearby Universe, are the UV, FIR and H emissions (e.g. Kennicutt 1998). In the present study we focus our attention on the UV and FIR emissions.
Concerning the FIR window, the IRAS mission provided us with several now well studied samples such as the Point Source Catalog (PSC, Joint IRAS Science 1994), the Faint Source Catalog (FSC, Moshir et al. 1990) and the redshift survey of the Point Source Catalog (PSCz, Saunders et al. 2000). The UV window, less explored mostly because limited observations have been available until now (e.g. Donas et al. 1987; Deharveng et al. 1994; Milliard et al. 1992; Kinney et al. 1993; Bell & Kennicutt 2001), has been extensively studied (e.g. Milliard et al. 1992; Donas et al. 1995; Treyer et al. 1998). This situation should change dramatically in the near future once the GALEX data will be available.
The first step towards the determination of statistical properties of UV and FIR selected samples of galaxies is the determination of the galaxy counts and the luminosity function (LF). Accurate determinations of these observables are important for constraining models of galaxy formation and evolution. Nevertheless very few models predict the luminosity distribution and spectral energy distribution of galaxies over a large range of wavelength from UV to FIR (Totani & Takeuchi 2002 and references therein; Xu et al. 1998). This is due, at least in part, to our poor knowledge of the dust extinction in the universe (amount of dust, dust emission, mechanism of stellar absorption on large scales). The reconstruction of the whole SED of galaxies from UV to FIR is difficult even in the well sampled nearby Universe because of the lack of multiwavelength data on large and homogeneous samples of galaxies (Boselli et al. 2003; Flores et al. 1999; Rigopoulou et al. 2000; Cardiel et al. 2003). This situation should evolve dramatically in the future with the planned observations of large fields with telescopes working at very different wavelengths (SIRTF, GALEX, VIMOS, ASTRO-F).
The FIR to UV flux ratio has been proved to be the best indicator of the dust extinction in normal galaxies (e.g. Buat & Xu 1996; Meurer et al. 1999), becoming a fundamental parameter in the determination of their present SFR (e.g. Buat et al. 1999,2002; Hirashita et al. 2003, hereafter HBI).
The aim of the present paper is to study the statistical properties of two samples extracted from the same area of the sky, selected according to UV and FIR criteria. The two selections (UV and FIR) appear very complementary since the sample of UV selected galaxies will be biased towards active star forming galaxies with low extinction, and on the contrary a FIR selection is likely to favor galaxies with high extinction. An accurate knowledge of the statistical properties of UV and FIR selected samples is crucial for the analysis of similarly selected samples at higher , where the lack of complementary data prevents a precise determinations of the dust extinction and SFR.
With these two samples in hand, we study the extinction and SFR related properties and their dependence on the selection method. More precisely we address the following issues: (1) determine the mean extinction of purely UV or FIR selected samples of galaxies, (2) observationally constrain models of galaxy formation and evolution, and (3) provide the best recipes for the determination of the SFR, valid for UV and/or FIR selected samples of galaxies.
The paper is organized as follows: Section 2 presents the FIR and UV data and the region of the sky where the data were taken. Sections 3 and 4 describe the selection procedure of the UV and FIR selected samples. Section 5 discusses the extinction properties of the samples and Section 6 is devoted to the comparison between the different SFR tracers. A final summary of the main results of the paper is presented in Section 7.
2 The FIR and UV data
An accurate comparison between the properties of UV and FIR galaxies can be done if both samples are extracted from the same region of the sky. With this purpose we selected some fields covered by the FOCA experiment (Milliard et al. 1991) at UV wavelengths (0.2m). A total of 9 FOCA fields were chosen. The area of each field is circular with a radius of 1.13 . Accounting for some overlapping of the fields, a total area of 35.36 was covered. Table 1 shows the basic properties of the selected fields. Four out of the nine observed fields are centered on nearby clusters of galaxies: m010 (Cancer), m028 (Coma), m067 (Abell 1367) and m050 (Virgo), and two of them point to the external parts of the Coma cluster (m030, m031). The Cancer cluster is however in Hubble flow (Gavazzi et al. 1991), thus its members are similar to field galaxies. The fractions of cluster galaxies in our UV selected and FIR selected (hereafter UVsel and FIRsel respectively) samples are 64% and 50% respectively. The possible contribution of the cluster environment to the properties of the UVsel and FIRsel galaxies are discussed in the text.
The detection and flux extraction of the UV objects in the FOCA plates was carried out in an automatic way. Only UV sources with surface brightness (averaged over arcsec2) brighter than 2.8 times the sky (the detection limit established by the automatic detection algorithm for each frame, given in Col. 5 of Table 1) were considered as detections. The automatic determination of the UV flux is accurate for point like sources but uncertain for extended objects, so the UV fluxes of the FIRsel galaxies were determined in two ways: (1) for the galaxies which were not resolved by the automatic detection algorithm (i.e. only one UV source was detected) we used the UV flux provided by the detection algorithm111The automatic algorithm performs aperture photometry around the selected UV sources using increasing radii. The adopted aperture is selected when the magnitude stabilizes. More details about this procedure are given in Moulinec (1989).. (2) for the galaxies which were splitted in several sources (i.e. several Hii regions were detected as individual sources) we performed aperture photometry by hand. The optical images were used to set the size of the apertures in order to be sure that all the UV flux corresponding to the galaxies, even the most external star forming regions, was included in the total UV flux. In both cases the apertures used to measure the UV fluxes are close to the optical diameters of the galaxies. The average zero point uncertainty of the FOCA data is about 0.2 mag. The spatial resolution of the FOCA frames is arcsecs FWHM and the astrometric uncertainty is arcsecs.
Concerning the FIR data, the IRAS all sky survey ensures a total coverage of our selected FOCA fields. The total photometric uncertainty of the FIR data of the IRAS mission is % at 60 and 100m. The positional uncertainty is variable and of elliptical shape with major axis arcsecs. The spatial resolution shows irregular shape and depends on the bandwidth and coordinates of the object. In the direction where it is maximal being arcmin at 60m (see Moshir et al. 1990 for details).
3 The UV selected sample
3.1 Selection of UV galaxies
The UVsel sample includes all galaxies with mag 222The UV magnitudes will always be referred in the system defined as , where is expressed in erg cm-2 s-1 Hz-1.. This limit is chosen in order to have a good chance to find FIR counterparts (Jy for IRAS FSC). The combination of the adopted limits of both the UV and FIR flux densities sets the completeness limit for the extinction of our sample to mag (see Eq. 1 in Sec. 5.2).
The determination of the UVsel sample is difficult because of the high contribution of field stars to the total UV counts extracted from the FOCA frames and the poor spatial resolution of the UV data (see below). This might result in misclassification of stars as galaxies. To get rid of this technical problem we followed this procedure:
-
1.
At first we crosscorrelated the sample of UV sources brighter than mag with the NED database and obtained 25 galaxies. Fig 1 shows the UV (from the FOCA frames) and optical (from the DSS blue plates) images of these galaxies. As can be seen from the figure, all these galaxies show a clear extended structure and by no means can be misclassified as point like objects.
-
2.
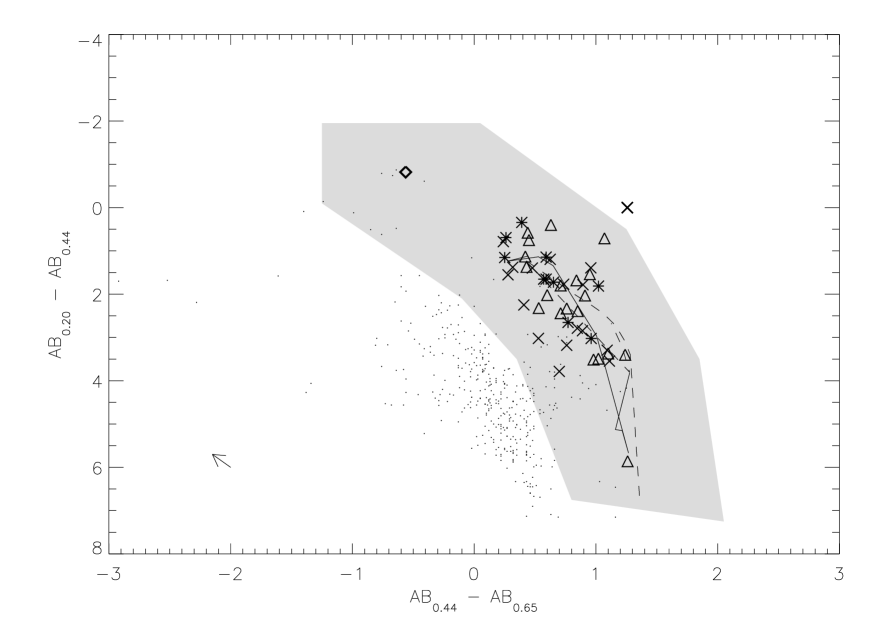
The remaining UV sources brighter than mag, a total of 375, were not found to be classified as galaxies in the NED database nor in the 2MASS extended source catalog. These UV sources do not show an extended appearance in the FOCA frames nor in the optical DSS plates. However, for the faintest of them some doubts arise from their optical appearance: they could be very compact galaxies whose external faint surface brightness envelopes are lost in the DSS plates. Given that the spatial resolution of the FOCA experiment is poor (FWHM arcsecs), a star/galaxy separation based on standard methods is not possible. Thus a systematic search in the USNO-B1.0 catalog (Monet et al. 2003) for the optical counterparts of our UV sources was performed. In order to shed light on the nature of these non extended UV sources, a diagnostic based on the fluxes at 0.2m (from FOCA), and at 0.44m and 0.65m (corresponding to the Johnson and Cousins respectively, from the USNO-B1.0 catalog) was applied. We present in Fig 2 the vs. diagram for our 375 UV sources and we compare their combined UV-optical colors with those of real galaxies and with the prediction of synthetic models of galaxies. We have selected an area in the figure which encloses the region expected for galaxies, taking into account the typical uncertainties of the USNO/FOCA photometry333Details about the uncertainties of the USNO-B1.0 photometry are given in Appendix A. The shaded area was defined from the position of the observed galaxies (observed with FAUST experiment) and was made larger using the typical photometric errors of galaxies in order to be conservative. Most of the UV sources, 314 in total, fall out of this region and thus they are discarded from the list of galaxy candidates444Optical frames from the blue DSS plates centered at these objects are available upon request: jorge.iglesias@oamp.fr.
-
3.
The remaining 61 UV sources, falling within the shaded region of Fig 2, have colors consistent with those of real and synthetic galaxies. Blue DSS plates centered at the optical counterparts of these 61 UV sources are presented in Fig 3. After a visual inspection of the optical plates we conclude that excepting 6, all of the sources are undoubtedly point-like objects and they are ruled out as being galaxy candidates.
-
4.
The UV-optical colors of these 6 UV sources are listed in Table 2. m030-768 and m028-817 are removed since they are listed as stars with spectral types WD and sdB respectively555m028-817 is misclassified as a cluster galaxy in SIMBAD based on the report of Brosch et al. (1998), but in this paper the authors clearly classify this object as the star TON 140. in the SIMBAD database. Thus, at the end only 4 UV sources remain as uncertain objects.
-
5.
Out of the remaining four UV objects, three of them, m010-538, m018-542 and m033-310, are listed as point sources in the 2MASS All Sky Point Source Catalog. Although this fact enforces their point-like nature, it is completely conclusive, being necessary multiwavelength or spectral information to accurately determine their real nature. None of these four objects have a FIR counterpart in the IRAS FSC catalog. Since no evidence was found for them being galaxies, we will not include these objects in the UVsel sample, we only keep them as objects with an uncertain nature.
At the end our UVsel sample is composed by the 25 galaxies found after a crosscorrelation our list of UV detections with the NED catalog. The selection of NED objects does not introduce a bias from the selection of the dubious objects because the NED objects would have been classified as secure galaxies by just a visual inspection (as is evident from the optical plates presented in Fig. 1). So, the only bias may come from the selection by-eye of objects from the DSS blue plates, in the sense that very compact objects are not included in the list of secure galaxies (but they are listed as dubious objects). In Table 3 we present some of the basic properties of the 25 UV selected galaxies, as follows:
Column (1): Galaxy name, from LEDA database.
Column (2): FOCA field were the galaxy was detected.
Column (3): Uncorrected UV () magnitude in the AB system at 0.2m.
Column (4): Galactic extinction correction at 0.2m according to Schlegel et al. (1998) and the MW extinction curve of Pei (1992).
Column (5): Flux density at 60m from the IRAS FSC catalog, in Jy.
Column (6): Flux density at 100m from the IRAS FSC catalog, in Jy.
Column (7): of the optical axial ratio, from the LEDA database.
Column (8): Morphological type, from NED database.
Column (9): Distance to the galaxy in Mpc, from LEDA database666The LEDA database assumes km s-1 Mpc-1
Column (10): -band magnitude, from LEDA database.
Column (11): Aggregation, from GOLDMINE (Gavazzi et al. 2003).
The sample galaxies are mainly spirals (21 out of the total of 25) with only 3 irregulars and one elliptical.
The magnitudes used in the following analysis are corrected for Galactic extinction using the values listed in Table 3.
3.2 Properties of the UVsel sample
In this section we show some properties our UVsel sample and compare them with those of other UV samples of galaxies.
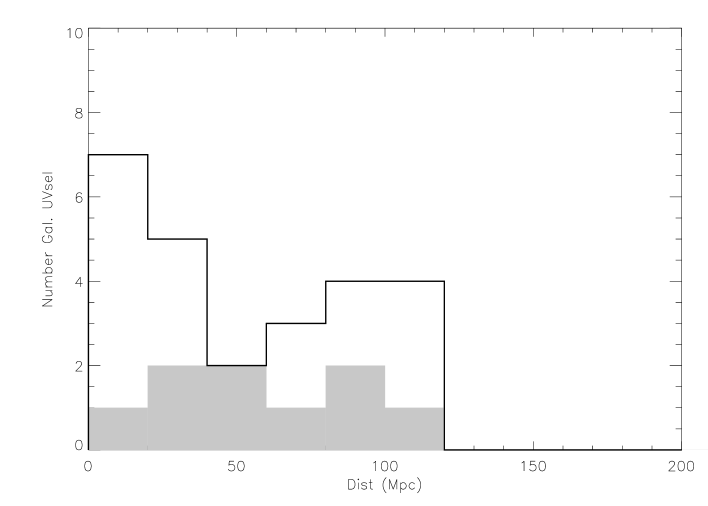
Fig 4 shows the distribution of distances of the UVsel galaxies. Two peaks are present in the distribution, due to the presence of cluster galaxies (mainly Virgo, Coma and Abell 1367). The median distance of the total sample is 56 Mpc. The shape of the distribution becomes flatter when we remove the cluster galaxies, and the median distance changes to 59 Mpc.
In Fig 5, we present our UV galaxy counts corrected for Galactic extinction compared to the UV galaxy counts brighter than already published: Milliard et al. (1992) with FOCA data and Deharveng et al. (1994) with FAUST data. An extrapolation of the counts of Milliard et al. with slope 0.6, representative of an euclidean distribution, has been overplotted for comparison. In order to visualize the effect of the cluster galaxies we show both the total counts and those corresponding only to galaxies not associated to clusters. The UV counts not including the cluster galaxies agree well with the FAUST counts and deviate significantly from the euclidean extrapolation at mag ( dex). When including the cluster contribution, the total UV counts increase, but even in this case the counts lie below the euclidean extrapolation to the counts of Milliard et al. (1992).
Despite our poor statistics, we check whether our UVsel sample is representative of the local Universe by comparing its UV LF, derived using the method777We call the attention of the reader to the fact that the method suffers from systematic errors in the derived parameters of the LF for small samples of galaxies (see Willmer 1997 for details)., to that of Sullivan et al. (2000), as shown in Fig 6. It can be seen that our sample lacks of galaxies brighter than as compared to the sample of Sullivan et al. whereas for fainter magnitudes both samples show a fairly good agreement. When excluding the cluster galaxies of our sample, our LF shows a similar shape as that of Sullivan et al. and is shifted by dex at all UV magnitudes. This shift in the normalization of the LF is related to the difference between our UV counts and the extrapolation to those of Milliard et al. We stress the fact that our goal in this work is not to construct an UV LF but just to compare the representativity of our UVsel sample to larger samples of UV galaxies in the local Universe.
3.3 FIR identifications
We searched for FIR counterparts of our UVsel sample using the 60m detections from the IRAS FSC catalog. For each UV galaxy we selected a FIR counterpart if the UV coordinates fall within the 3- uncertainty ellipse centered at the position of each FIR source. The uncertainty in the UV coordinates ( arcsecs) was not taken into account since it is much smaller than the IRAS one ( arcsecs for the major axis of the 1- uncertainty ellipse).
The FIR flux densities of the galaxies NGC 3883, NGC 4411 have been measured with the IRAS Scan Processing and Integration facility (SCANPI) since no FIR sources associated to them were present in the FSC catalog. At the end, 24 out of the 25 UV galaxies are identified at 60 m, which corresponds to a detection rate of 96%. The only galaxy without a FIR counterpart is the elliptical galaxy NGC 4472.
4 The FIR selected sample
4.1 Selection of FIR galaxies
The FIRsel sample is extracted from the IRAS PSCz catalog. The PSCz catalog was chosen to simplify the cross identification with FOCA since this catalog, complete to Jy, includes only galaxies with an optical identification.
42 galaxies from the PSCz fall within our surveyed region of the sky. Some basic properties of the sample galaxies are listed in Table 4. The columns are the same as in Table 3 except for the identifier in column 2 which is now the PSCz identifier of the galaxies.
A comparison with the UVsel sample yields a total of 13 galaxies in common.
4.2 Properties of the FIRsel sample
As for the UV selected sample we first analyze the statistical properties of the FIRsel sample by comparing with those of other FIR selected samples.
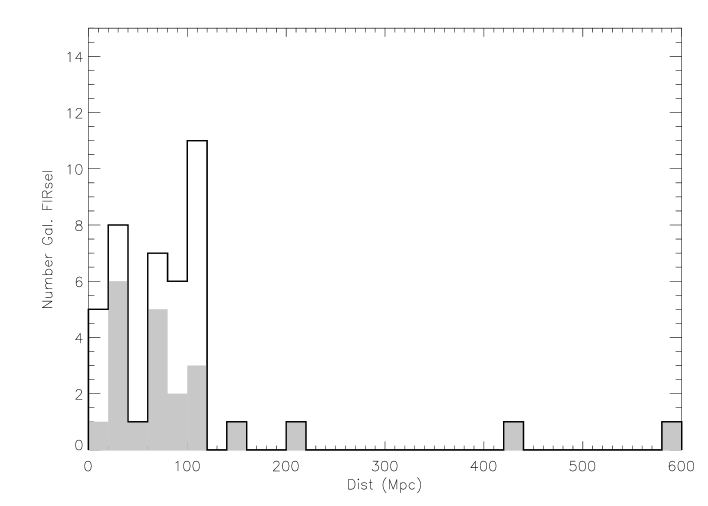
We show the distribution of distances of the FIRsel galaxies in Fig 7. It can be clearly seen that we are sampling a larger volume of the Universe than for the UVsel sample. Again the distribution of distances shows two peaks at the redshifts of the clusters (approximately 17 and 90 Mpc). The average distance of the FIRsel sample is 81 Mpc, and it goes to 78 Mpc when removing the contribution of the cluster galaxies, slightly higher than the average 45 Mpc of the total PSCz catalog (Saunders et al. 2000). We attribute this difference to the small statistics of our sample.
Fig 8 shows the galaxy counts as a function of for the FIRsel sample. Again we plot separately the total counts and those excluding the cluster galaxies. As a comparison we show the average counts for three different subsamples of the PSCz (Saunders et al. 2000). Whereas for the total counts there is an excess of galaxies at most flux densities, removing the contribution of the cluster galaxies reduces the differences with the PSCz counts.
We also show in Fig 9 the luminosity function of the FIRsel sample estimated using the method, compared with that of Takeuchi et al. (2003) for the PSCz using an analytical method. The LF of the total FIRsel sample is below the PSCz LF for galaxies with and shows an excess for faint luminosities. The FIRsel LF restricted to galaxies not associated to clusters is also below the LF for the total FIRsel sample and shows the two features mentioned above. The lack of galaxies with is probably due to low statistics in both cases. However, the excess found at faint luminosities, although not present in the parametric LF of Takeuchi et al. (2003), is also found by these authors when computing the LF using the method.
4.3 UV identifications
We searched for UV counterparts to the FIRsel sources using the entire FOCA dataset (down to ) with a similar procedure as the one detailed in Section 3.3. At the end of the identification process, UV counterparts were found for 38 of the FIRsel sources, which corresponds to a detection rate of 90%. For the four non detections – Q02378+3829, Q09031+7855, Q13074+2852 and Q12217+0848 – an upper limit to their UV flux corresponding to the detection limit of the corresponding frame is given.
5 The Far-infrared to UV flux ratio and the internal extinction
5.1 The distribution
We define and as where is a monochromatic density flux at 60m and 0.2m; the ratio has no units. The histograms of are plotted in Fig 10 for both samples. As expected the median values of are significantly different: for the UVsel sample vs. for the FIRsel sample. When removing the cluster galaxies of both samples we obtain median values of 0.25 and 1.04 for the UVsel and FIRsel samples respectively, consistent with the values obtained for the total samples. The differences in the median values obtained for can be understood in terms of selection biases, as it is illustrated in Fig 11. The FIR selection (limited by the low horizontal line in the Fig 11) favors galaxies with high ratio. At the opposite, the UV selection (limited by the right vertical line in the Fig 11) is biased towards galaxies with low values.
The very high detection rates found in UV (respectively FIR) for the FIRsel (respectively UVsel) sample as well as the small difference in found between the samples argue for a tight distribution of FIR/UV fluxes in galaxies. Nevertheless, because of our small statistics, we cannot exclude the presence of different sub-populations of galaxies such as the very blue galaxies with very low values of predicted by some models of galaxy evolution (C. Xu, private communication). No such galaxies are present in our UVsel sample888Although in the case that any of the four dubious objects listed in Section 3.1 were confirmed galaxies they would show a very low dust content.
The FIRsel sample contains four galaxies with no UV counterpart. These galaxies, together with the few ones with mag, might belong to a population of bright FIR objects with a higher than normal ratio. This kind of galaxies, already reported by several authors (e.g. Sanders & Mirabel 1996; Trentham et al. 1999), are rare in the local Universe (Buat et al. 1999).
5.2 Internal dust extinction
It is now commonly accepted that a reliable method to estimate the dust extinction is to compare the emission of the dust to the emission of the stars observed in UV. The method is based on an energetic budget: all the stellar light absorbed by the dust is re-emitted in FIR-submm wavelengths. The models account for the dust heating by all the stars (old and young), they assume a geometrical distribution for the dust and the stars as well as dust characteristics (absorption and scattering) and they solve the radiation transfer equation to deduce the extinction at all wavelengths. The complexity of the analysis varies according to the authors and their goals (e.g. Xu & Buat 1995; Granato et al. 2000; Popescu et al. 2000; Panuzzo et al. 2003). Within the frame of these models, the comparison of the total dust emission and the observed UV one gives and estimate of the extinction at UV wavelengths which is found very robust against the details of the models, as soon as the galaxies form stars actively (Buat & Xu 1996; Meurer et al. 1999; Panuzzo et al. 2003; Gordon et al. 2001). All the models need as input the total dust emission (10–1000m). This can be done by extrapolating the FIR flux to the total dust emission. In general one starts with the FIR (40–120m) flux computed as the combination of the fluxes at 60 and 100m (Helou et al. 1988) and applies a correcting factor (Xu & Buat 1995; Meurer et al 1999; Calzetti et al. 2000). Recent ISO data allowed an accurate determination of . Here we use the calibration proposed by Dale et al. (2001) for because it is suited for normal galaxies and only based on the fluxes at 60 and 100m. With this calibration we find median values of of for the UVsel sample and 2.31.1 for the FIRsel sample. The values obtained after removing the cluster galaxies are 2.41 and 2.29 for the UVsel and FIRsel samples respectively. Following Buat et al. (1999) and adopting the new calibration, the extinction can be expressed as
| (1) |
where . This formula is fully consistent with that used in HBI (their Eq. 14 but expressed in terms ) since both are issued from the same model. Here we prefer to use the observable quantities . An important issue for the following analysis is that there is no need to correct the dust emission from the heating by old stars to derive the extinction from the FIR to UV flux ratio since the contribution of all the stars to the dust heating is accounted for by the models and included in the calibration of Eq. 1 which deals with the total FIR emission. Fig 12 compares the calibration of given in Eq. 1 with the ones of Buat et al. (1999), Calzetti et al. (2000) and Panuzzo et al. (2003), illustrating that the calibration proposed in this work (Eq. 1) is, in particular, in very good agreement with the one proposed by Panuzzo et al. (2003) for face-on galaxies. These authors take into account the inclination angle of the galaxy when computing the extinction. They also propose a calibration for the extinction of nearly edge-on galaxies which results in higher extinctions for the same value of .
When applying Eq 1 to our samples, we obtain median values of of mag and mag for the UVsel and the FIRsel samples respectively. Removing the cluster galaxies yields median values of 1.00 and 2.38 for the UVsel and FIRsel samples respectively, again consistent with the values obtained for the total samples. The median value of mag found for the UVsel sample is consistent with the one reported by Buat & Xu (1996) – mag – for a sample of galaxies essentially UV selected: it was based on UV detections from the SCAP (Donas et al. 1987) and FAUST (Deharveng et al. 1994) observations with available FIR counterparts. The value obtained for the FIRsel sample is larger than the one reported by Buat et al. (1999) – mag – for a sample of galaxies with UV and FIR data in the FOCA and IRAS FSC catalogs respectively. However, this last sample was not truly FIR selected since it only contained FIR detections confirmed as galaxies in the IRAS FSC catalog of associations and thus some galaxies with a FIR counterpart but with an association of a different nature in this catalog were rejected.
Concerning the four galaxies with no UV counterpart, their as well as a lower limit for are given in Table 5. These four galaxies show very large IR luminosities (two of them are LIRGs with ). They are also detected as radio sources by the NVSS survey. This kind of galaxy, often associated to interacting systems (Sanders & Mirabel 1996), is not very common in the local Universe. In fact, this could be the case of Q02378+3829, whose optical counterpart reveals the existence of a close pair of galaxies. Values of the extinction of mag have been reported for nearby LIRGs from other samples in the literature (Buat et al. 1999), consistent with mag we find for these four galaxies.
6 Calibration of the FIR and UV emissions as SFR tracers
6.1 SFR estimators
Both UV and FIR emissions in star forming galaxies are related to young stars and thus are potential tracers of the recent star formation. The aim of this section is to make use of the FIR and UV emissions to properly estimate the SFRs for our UVsel and FIRsel samples and to propose a method to obtain reliable SFRs when only UV or FIR fluxes are available.
Various assumptions must be made for the calculation of the SFR from UV or FIR luminosities. A star formation history and an initial mass function (IMF) must be assumed in order to relate the stellar emission to the SFR. Hereafter we make the assumption of a constant SFR in the last yr and we adopt a Salpeter IMF between 0.1 and 100 in order to convert UV and FIR luminosities to SFRs. Under these conditions, the conversion between the luminosity of a galaxy at a given wavelength and its SFR is given by stellar synthesis models. Here we list the most popular methods to estimate the SFRs of galaxies from UV and/or FIR luminosities.
-
1.
SFR deduced from the UV flux corrected for dust extinction. The assumption of a constant SFR in the last yr together with the fact that most of the UV flux comes from stars with lifetimes yr allows to estimate the SFR from the UV luminosity. The validity of this approximation requires a proper correction for internal extinction at UV wavelengths. This method has been used intensively (Donas et al. 1987; Buat & Xu 1996; Buat et al. 2002; Madau et al. 1998; Bell & Kennicutt 2001; Boselli et al. 2001). Using the code Starburst99 with a Salpeter IMF from 0.1 to 100 solar masses we obtain:
(2) with in yr-1 and in erg s-1 Å-1. corresponds to the UV luminosity at 0.2m corrected for dust extinction using Eq 1. This calibration is consistent with that of Kennicutt (1998) within less than 10%.
-
2.
SFR is calculated from the dust emission. This method relies on two major assumptions: (1) the dust extinction must be high enough in order that the stellar light escaping the galaxy is negligible and (2) the contribution of the old stars to the dust heating is negligible. These assumptions are likely to be true for galaxies very active in star forming and FIR luminous. However, the extension of this approximation to normal star formation galaxies (e.g. optically selected) becomes problematic due to the contamination of the FIR emission by a cooler cirrus component heated by stars older than yr (Sauvage & Thuan 1992), and also because of the stellar light which escapes the galaxies without being absorbed by the dust. A further difficulty of this method is to estimate the total dust emission from the observations: they are often restricted to 60 and/or 100m and average factors must be used to obtain the ratio. We apply the calibration from Dale et al. (2001, c.f. Sec. 5.2) and then we obtain the following HBI:
(3) with in yr-1 and in erg s-1. Again this calibration is consistent with that of Kennicutt (1998) within less than 5%.
-
3.
SFR is deduced by combining the UV (uncorrected for extinction) and the dust emissions. This method takes into account the UV light coming directly from young stars as well as the emission of the dust heated by these young stars. The observed UV flux and the dust emission at FIR wavelengths can be calibrated into SFR using the above expressions (Eqs. 2 and 3):
(4) where is expressed in erg s-1, in erg s-1 Å-1 and the SFR in yr-1.
As previously quoted, in normal star forming galaxies (not starbursting) a fraction of FIR luminosity is due to old stars. To properly estimate the SFR, this contribution should be removed from the conversion formula. Under this assumption, Eq 4 is modified as follows:
(5) HBI have recently studied the consistency of the H, UV and FIR emissions of galaxies in terms of SFR in order to estimate the fraction of dust heated by stars older than yr. They found for a sample of star forming galaxies selected to be observed in UV, FIR and in the Balmer (at least H) emission lines. The parameter was found to be robust against variations of model assumptions: SFR constant over or yr, or slight variations of . Such a low dispersion found for is probably due to the selection of the sample, which contains optically selected nearby spiral or irregular galaxies active in star formation. Indeed for a sample of starburst galaxies UV selected, HBI found , all the dust heating being attributed to young ( yr) stars. A very low value of is also probably valid for galaxies whose spectral energy distribution is dominated by their FIR luminosity, with very intense star formation activity. Nevertheless, as shown in Fig. 11, galaxies with a very high dust content are almost absent of our samples: only four of the FIRsel galaxies show extinction larger than mag. For two of them only an upper limit to the UV flux is available (and thus, they could present a very large extinction) and they will not be included in the subsequent analysis. Xu et al. (1994) also estimated the contribution to the FIR () emission of stars less massive than in spiral galaxies and found that % of the FIR emission is due to these stars. More recently, Misiriotis et al. (2001) gave an upper limit of % for the heating by old stars distributed in a thick disk and the bulge. One of the aims of the present paper is to test whether the value of estimated in HBI for star forming galaxies remains valid, at least on average, for galaxy samples selected according to different criteria.
Using or as a quantitative estimator of the SFR assumes implicitly that both the observed UV and FIR emission are isotropic since they relate the luminosities to SFR. However the UV emission of a galaxy affected by the extinction is certainly not isotropic. Therefore the relations defined by Eqs 4 and 5 have only a statistical significance assuming that the galaxies are randomly oriented. This caveat is less important for and since the dust and UV emissions corrected for dust extinction are supposed to be isotropic.
In the following we will compare these four determinations of the SFR – , , and – for both our UVsel and FIRsel samples with the aim of comparing the results of the different methods and of finding the best way to estimate the SFR when only UV or FIR data are available.
6.2 Estimating the SFR in the UVsel sample
Fig 13 shows the comparison between the four different estimations of the SFR for the galaxies in the UVsel sample (excepting the galaxy for which only un upper limit to the FIR flux is available).
In panel a we present the comparison between the SFRs estimated from the UV fluxes using a proper extinction correction for each galaxy () and those estimated also from the UV fluxes but using the average extinction correction mag, a value similar to the one found for our UVsel sample. This last estimation of the SFR is very useful for UV selected samples when FIR data are not available. It appears that the agreement between both determinations of the SFR is quite good over two orders of magnitude in SFR.
The remaining three panels of the figure show the comparison between and the other three estimators mentioned above. As it is shown in panel b, is systematically lower than ( dex). Panel c shows that using with leads to an almost perfect agreement between and , thus confirming the conclusion reached by HBI. Finally, we show in panel d that is in quite good agreement with . This result comes out from the combination of two effects (dust heating due to old stars is not subtracted and the contribution of the young stars not absorbed by the dust is not included in the estimation) which are not taken into account but which compensate each other producing the agreement between and . We stress however the accidental nature of this relationship.
In general, we show that the slopes of all these relations are close to unity, that is, the shifts between the different estimations of the SFR are almost constant over the whole range of SFRs of our UVsel sample and no trends with the luminosity are found.
These results seem to be in conflict with the trend found by HBI (see also Buat 2003) that the dust emission under-predicts the SFR for galaxies with SFR /yr. Once again the difference is probably due to selection effects: the galaxy sample used by HBI is biased towards late type galaxies for which a Balmer decrement (and therefore a H line) has been measured and does not sample accurately the UV luminosity function. Indeed the mean extinction found by HBI is only 0.75 mag against 1 mag for the present UVsel sample.
6.3 Estimating the SFR in the FIRsel sample
Concerning the FIRsel sample, we show in Fig 14 the comparisons between and the other estimators already proposed: , , . Only FIRsel galaxies detected in the UV frames are included in this analysis.
is almost similar to , as shown in panel a, since the contribution of the observed UV flux is rather negligible for the FIRsel galaxies. In the same way, decontaminating from the dust heated by old stars leads to % lower than and therefore than , as it is illustrated in panel b. Contrary to what observed in the UV selected sample, is lower than , as illustrated in panel c. This different behavior is probably due to the fact that the accidental compensation between the cold stellar contribution to the total dust emission and the emission of the young stellar population not absorbed by dust, observed in the UVsel sample, is here not reproduced. Finally, panel d shows that is in good agreement with as it was also found for the UVsel sample. Combining the results from panels c and d we argue that the assumption that all the dust emission comes from young stars is not valid for galaxies like the ones we find in our samples, and that we must assume that a fraction of this emission comes from older stars.
The slopes of the relations between the SFRs for the FIRsel samples are again close to unity meaning that no trend with luminosity does exist and that the conversions between the different methods to estimate the SFR are valid over the range of SFRs covered by our sample. Even the two galaxies included in this analysis with mag follow the same trends as the other galaxies of the FIRsel sample. This fact argues for the validity of the calibrations between the different estimators of the SFR even for very extincted galaxies, expected to be more numerous at high . However, larger and deeper samples are necessary to confirm this hypothesis.
6.4 SFR vs. extinction for UVsel and FIRsel samples
It has been reported by several authors a correlation between the extinction and the SFR (Calzetti et al. 1995; Wang & Heckman 1996; Buat et al. 1999; Adelberger & Steidel 2000; Hopkins et al 2001; Sullivan et al 2001), which may be attributed to both the increase of metallicity and the increase of surface mass density with increasing luminosity (Wang & Heckman 1996). In order to verify this effect, we show in Fig 15 versus for the UVsel and FIRsel samples. A very dispersed correlation is apparent between both quantities when considering both samples together. However this trend seems to be mainly due to the FIRsel galaxies since it disappears when considering only the UVsel galaxies. In any case, it is clear that the scatter of the relationship is enhanced by the different selection criteria.
We show in Fig 16 versus , where is the optical surface of the galaxies in kpc2. As can be seen, a very dispersed correlation is apparent both samples although the larger scatter corresponds again to the FIRsel sample.
7 Conclusions
We have presented the properties of two samples of galaxies selected from the same region of the sky by their UV and FIR fluxes. The detection rate for the UVsel sample at FIR wavelengths was found to be 96% whereas that for the FIRsel sample at UV wavelengths equals 90%. The UV counts are lower than the expected from the extrapolation of previous determinations at fainter magnitudes, even when including the contribution of the cluster galaxies. We showed that their dust extinction properties are different, the UV selected galaxies exhibiting a lower extinction than the FIR selected ones (1 mag on average for the UVsel vs. 2 mag for the FIRsel). Four galaxies of the FIRsel sample do not have a UV counterpart, implying lower limits to the UV extinction of mag. These galaxies could be part of the population of very extincted objects already reported in the literature.
We compared different indicators of the SFR calculated with the FIR and/or UV luminosities and we showed that they correlate well with each other for both samples. The relations between the different estimators of the SFR present a slope close to unity for both samples, meaning that no trend with the SFR exists when converting between each other. For both samples we found the best agreement between the following quantities: (a) the SFR calculated from the UV luminosities corrected for dust extinction using the FIR/UV ratio and (b) the sum of the SFR calculated from the dust luminosities corrected for the average contribution of the dust heating due to old stars (%) and of the SFR calculated from the observed UV luminosities.
Putting both samples together we find the correlation between SFR and extinction already reported for other samples of galaxies but with a very large scatter. Most of the trend is due to the galaxies selected in FIR.
The results of this work seem not affected by the cluster environment since we have shown that the global properties of cluster and field galaxies present in our samples are similar. This is expected from the similarities between field and cluster LFs at UV and FIR wavelengths (Bicay & Giovanelli 1987; Cortese et al. 2003).
Acknowledgements.
Thanks are given to C. Xu for interesting suggestions and comments. This research has made use of the NASA/IPAC Extragalactic Database (NED) and the NASA/IPAC Infrared Science Archive, which are operated by the Jet Propulsion Laboratory, California Institute of Technology, under contract with the National Aeronautics and Space Administration. This research has made use of the SIMBAD database, operated at CDS, Strasbourg, France. The LEDA database (http://leda.univ-lyon1.fr/) was used throughout this work.References
- Adelberger & Steidel (2000) Adelberger, K. L. & Steidel, C. C. 2000, Ap.J., 544, 218
- Bell & Kennicutt (2001) Bell, E. F. & Kennicutt, R. C. 2001, Ap.J., 548, 681
- Bicay & Giovanelli (1987) Bicay, M. D. & Giovanelli, R. 1987, Ap.J., 321, 645
- Boselli, Gavazzi, Donas, & Scodeggio (2001) Boselli, A., Gavazzi, G., Donas, J., & Scodeggio, M. 2001, A.J., 121, 753
- Boselli, Gavazzi, & Sanvito (2003) Boselli, A., Gavazzi, G., & Sanvito, G. 2003, A.& A., 402, 37
- Brosch et al. (1998) Brosch, N., Ofek, E. O., Almoznino, E., Sasseen, T., Lampton, M., & Bowyer, S. 1998, M.N.R.A.S., 295, 959
- Buat & Xu (1996) Buat, V. & Xu, C. 1996, A.& A., 306, 61
- Buat, Donas, Milliard, & Xu (1999) Buat, V., Donas, J., Milliard, B., & Xu, C. 1999, A.& A., 352, 371
- Buat, Boselli, Gavazzi, & Bonfanti (2002) Buat, V., Boselli, A., Gavazzi, G., & Bonfanti, C. 2002, A.& A., 383, 801
- Calzetti et al. (1995) Calzetti, D., Bohlin, R. C., Gordon, K. D., Witt, A. N., & Bianchi, L. 1995, Ap.J., 446, L97
- Calzetti et al. (2000) Calzetti, D., Armus, L., Bohlin, R. C., Kinney, A. L., Koornneef, J., & Storchi-Bergmann, T. 2000, Ap.J., 533, 682
- Calzetti (2002) Calzetti, D. 2002, American Astronomical Society Meeting, 201,
- Cardiel et al. (2003) Cardiel, N., Elbaz, D., Schiavon, R. P., Willmer, C. N. A., Koo, D. C., Phillips, A. C., & Gallego, J. 2003, Ap.J., 584, 76
- Chapman et al. (2000) Chapman, S. C. et al. 2000, M.N.R.A.S., 319, 318
- (15) Cortese, L., Gavazzi, G., Boselli, A., Iglesias-Páramno, J., Donas, J., & Milliard, B. 2003, A.& A., astro-ph/0310024
- Dale et al. (2001) Dale, D. A., Helou, G., Contursi, A., Silbermann, N. A., & Kolhatkar, S. 2001, Ap.J., 549, 215
- Deharveng et al. (1994) Deharveng, J.-M., Sasseen, T. P., Buat, V., Bowyer, S., Lampton, M., & Wu, X. 1994, A.& A., 289, 715
- Donas et al. (1987) Donas, J., Deharveng, J. M., Laget, M., Milliard, B., & Huguenin, D. 1987, A.& A., 180, 12
- Donas, Milliard, & Laget (1995) Donas, J., Milliard, B., & Laget, M. 1995, A.& A., 303, 661
- Fioc & Rocca-Volmerange (1997) Fioc, M. & Rocca-Volmerange, B. 1997, A.& A., 326, 950
- Flores et al. (1999) Flores, H. et al. 1999, Ap.J., 517, 148
- Gardner, Brown, & Ferguson (2000) Gardner, J. P., Brown, T. M., & Ferguson, H. C. 2000, Ap.J., 542, L79
- Gavazzi, Scodeggio, Boselli, & Trinchieri (1991) Gavazzi, G., Scodeggio, M., Boselli, A., & Trinchieri, G. 1991, Ap.J., 382, 19
- Gavazzi et al. (2003) Gavazzi, G., Boselli, A., Donati, A., Franzetti, P., & Scodeggio, M. 2003, A.& A., 400, 451
- Gordon, Calzetti, & Witt (1997) Gordon, K. D., Calzetti, D., & Witt, A. N. 1997, Ap.J., 487, 625
- Gordon, Misselt, Witt, & Clayton (2001) Gordon, K. D., Misselt, K. A., Witt, A. N., & Clayton, G. C. 2001, Ap.J., 551, 269
- Granato et al. (2000) Granato, G. L., Lacey, C. G., Silva, L., Bressan, A., Baugh, C. M., Cole, S., & Frenk, C. S. 2000, Ap.J., 542, 710
- Helou, Khan, Malek, & Boehmer (1988) Helou, G., Khan, I. R., Malek, L., & Boehmer, L. 1988, Ap.J.S., 68, 151
- Hirashita, Buat, & Inoue (2003) Hirashita, H., Buat, V., & Inoue, A. K. 2003, A.& A., 410, 83
- Høg et al. (2000) Høg, E. et al. 2000, A.& A., 355, L27
- Hopkins, Connolly, Haarsma, & Cram (2001) Hopkins, A. M., Connolly, A. J., Haarsma, D. B., & Cram, L. E. 2001, A.J., 122, 288
- Kennicutt (1998) Kennicutt, R. C. 1998, A.R.A.& A., 36, 189
- Kinney et al. (1993) Kinney, A. L., Bohlin, R. C., Calzetti, D., Panagia, N., & Wyse, R. F. G. 1993, Ap.J.S., 86, 5
- Kharchenko (2001) Kharchenko, N. V. 2001, Kinematika i Fizika Nebesnykh Tel, 17, 409
- Leitherer et al. (1999) Leitherer, C. et al. 1999, Ap.J.S., 123, 3
- Madau, Pozzetti, & Dickinson (1998) Madau, P., Pozzetti, L., & Dickinson, M. 1998, Ap.J., 498, 106
- Meurer, Heckman, & Calzetti (1999) Meurer, G. R., Heckman, T. M., & Calzetti, D. 1999, Ap.J., 521, 64
- Milliard, Donas, & Laget (1991) Milliard, B., Donas, J., & Laget, M. 1991, Advances in Space Research, 11, 135
- Milliard et al. (1992) Milliard, B., Donas, J., Laget, M., Armand, C., & Vuillemin, A. 1992, A.& A., 257, 24
- Misiriotis, Popescu, Tuffs, & Kylafis (2001) Misiriotis, A., Popescu, C. C., Tuffs, R., & Kylafis, N. D. 2001, A.& A., 372, 775
- Monet et al. (2003) Monet, D. G. et al. 2003, A.J., 125, 984
- Moshir & et al. (1990) Moshir, M. & et al. 1990, IRAS Faint Source Catalogue, version 2.0 (1990),
- Moulinec (1989) Moulinec, H. 1989, Ph.D. Thesis, Université de Nice
- Panuzzo et al. (2003) Panuzzo, P., Bressan, A., Granato, G. L., Silva, L., & Danese, L. 2003, A.& A., 409, 99
- Pei (1992) Pei, Y. C. 1992, Ap.J., 395, 130
- Popescu et al. (2000) Popescu, C. C., Misiriotis, A., Kylafis, N. D., Tuffs, R. J., & Fischera, J. 2000, A.& A., 362, 138
- Rigopoulou et al. (2000) Rigopoulou, D. et al. 2000, Ap.J., 537, L85
- Sanders & Mirabel (1996) Sanders, D. B. & Mirabel, I. F. 1996, A.R.A.& A., 34, 749
- Saunders et al. (2000) Saunders, W. et al. 2000, M.N.R.A.S., 317, 55
- Sauvage & Thuan (1992) Sauvage, M. & Thuan, T. X. 1992, Ap.J., 396, L69
- Schlegel, Finkbeiner, & Davis (1998) Schlegel, D. J., Finkbeiner, D. P., & Davis, M. 1998, Ap.J., 500, 525
- Steidel et al. (1999) Steidel, C. C., Adelberger, K. L., Giavalisco, M., Dickinson, M., & Pettini, M. 1999, Ap.J., 519, 1
- Sullivan et al. (2001) Sullivan, M., Mobasher, B., Chan, B., Cram, L., Ellis, R., Treyer, M., & Hopkins, A. 2001, Ap.J., 558, 72
- Takeuchi, Yoshikawa, & Ishii (2003) Takeuchi, T. T., Yoshikawa, K., & Ishii, T. T. 2003, Ap.J., 587, L89
- Totani & Takeuchi (2002) Totani, T. & Takeuchi, T. T. 2002, Ap.J., 570, 470
- Trentham, Kormendy, & Sanders (1999) Trentham, N., Kormendy, J., & Sanders, D. B. 1999, A.J., 117, 2152
- Wang & Heckman (1996) Wang, B. & Heckman, T. M. 1996, Ap.J., 457, 645
- Willmer (1997) Willmer, C. N. A. 1997, A.J., 114, 898
- Xu, Lisenfeld, Volk, & Wunderlich (1994) Xu, C., Lisenfeld, U., Volk, H. J., & Wunderlich, E. 1994, A.& A., 282, 19
- Xu & Buat (1995) Xu, C. & Buat, V. 1995, A.& A., 293, L65
- Xu et al. (1998) Xu, C. et al. 1998, Ap.J., 508, 576
|
|
|
Pair of galaxies not resolved by FOCA.
|
Pair of galaxies not resolved by IRAS.
|


Appendix A Photometric quality of the USNO-B1.0 catalog
The USNO-B1.0 catalog is a compilation from the digitization of various photographic sky surveys plates by the Precision Measuring Machine (PMM) located at the US Naval Observatory Flagstaff Station (NOFS). Details about the data handling and photometric calibration can be found in Monet et al. (2003). We show in Fig 17 the comparison of the -band photometry of the USNO-B1.0 objects in common with Tycho-2 (Høg et al. 2000) and ASCC-2.5 (Kharchenko 2001). As shown by this figure, the agreement between the photometry of the three catalogs is quite good (within 0.3 mag). This is not surprising since the Tycho-2 catalog was used to calibrate the brightest objects of USNO-B1.0 and since ASCC-2.5 partially overlaps Tycho-2. But even for the ASCC-2.5 objects not present in Tycho-2, we show that the agreement between the photometry of ASCC-2.5 and USNO-B1.0 is good enough so that we can rely on the USNO-B1.0 photometry. Concerning the -band photometry of the USNO-B1.0 catalog, no comparison was made because of the lack of available catalogs with -band photometry. However since the -band photometry is fairly good, we feel confident about the quality of the -band one.

