Chandra Observations of X-Ray Weak Narrow-Line Seyfert 1 Galaxies
Abstract
We present Chandra observations of 17 optically-selected, X-ray weak narrow-line Seyfert 1 (NLS1) galaxies. These objects were optically identified by Williams et al. (2002) in the Sloan Digital Sky Survey Early Data Release, but were not found in the ROSAT All-Sky Survey (RASS) despite having optical properties similar to RASS–detected NLS1s. All objects in this sample were detected by Chandra and exhibit a range of 0.5–2 keV photon indices . One object was not detected in the soft band, but has a best–fit over the full 0.5–8 keV range. These photon indices extend to values far below what are normally observed in NLS1s. A composite X-ray spectrum of the hardest objects in this sample does not show any signs of absorption, although the data do not prohibit one or two of the objects from being highly absorbed. We also find a strong correlation between and ; this may be due to differences in among the NLS1s in this sample. Such variations are seemingly in conflict with the current paradigm that NLS1s accrete near the Eddington limit. Most importantly, this sample shows that strong, ultrasoft X-ray emission is not a universal characteristic of NLS1s; in fact, a substantial number may exhibit weak and/or low– X-ray emission.
1 Introduction
Osterbrock & Pogge (1985) initially defined narrow-line Seyfert 1 galaxies (NLS1s) by their striking optical spectral characteristics: strong, narrow H emission (later formally defined to be FWHM by Goodrich, 1989), weak [O III] relative to H, and strong Fe II. These properties put NLS1s at one extreme end of the so–called Boroson & Green (1992) “Eigenvector 1,” thought to correspond to emission from lower-mass nuclear black holes coupled with near–Eddington accretion rates (Boroson, 2002). X-ray observations have revealed a strong soft X-ray “excess” in NLS1s (e.g., Leighly, 1999), further bolstering the high —low–mass black hole hypothesis (Pounds, Done, & Osborne, 1995; Wang, Brinkmann & Bergeron, 1996). Indeed, Boller, Brandt, & Fink (1996, hereafter BBF96) found a possible anticorrelation between X-ray spectral slope and H line width, with NLS1s generally having softer X-ray spectra than other AGN. Ultrasoft X-ray selection has consequently proven to be an essential tool for the discovery of large numbers of NLS1s (e.g. Grupe, 2000; Grupe et al., 2004).
The disadvantage of selecting NLS1s solely upon their X-ray properties is that it can introduce into NLS1 samples a strong bias toward those exhibiting an ultrasoft excess (Forster, 1999). Since NLS1s are primarily defined by their optical properties, the true nature of their X-ray emission is thus difficult to determine. Though it is well known that some NLS1s are ultrasoft X-ray sources, previous samples of optically selected NLS1s were simply too sparse to determine how many, as well as whether or not a significant number of NLS1s have hard X-ray spectra. With the advent of the Sloan Digital Sky Survey (SDSS; York et al., 2000), it is possible to build large catalogues of NLS1s with homogeneous selection criteria based on their optical spectra alone (see Williams, Pogge & Mathur, 2002, hereafter WPM02).
Of the 150 NLS1s listed in WPM02, 52 were detected in the ROSAT All-Sky Survey (RASS; Voges et al., 1999). Forty–five of these had sufficient counts in the 0.1–2.0 keV range to derive power-law photon indices (, where ) based on hardness ratios. Most of these objects were optically bright (), low–redshift (), and exhibited typical NLS1 photon indices of . However, a substantial number of optically–bright, low–redshift NLS1s did not have RASS source identifications. The optical spectra of these objects appear completely normal (within the limitations of the SDSS resolution and signal–to–noise) and only one or two are in regions of high Galactic H I column density, which could potentially obscure the X-ray flux.
It is thus possible that these objects represent a subset of NLS1s which are optically normal but X-ray weak. Only a few such objects have previously been found; for example, RX J2217.9-5941 (Grupe, Thomas, & Leighly, 2001) and PHL 1811 (Leighly et al., 2001). Since these SDSS NLS1s were not detected in the RASS, however, the nature and extent of their X-ray weakness could not be determined. They could emit significant flux at higher energies not covered by the 0.1–2.4 keV ROSAT band, or they might also be ultrasoft X-ray sources but with substantially lower overall X-ray fluxes than typically seen in NLS1s (i.e., much higher ). Another possible explanation is variability, but it seems unlikely that such a large fraction () would be in an exceptionally low state during the RASS observations. In reality, all three of these factors probably have some bearing on the X-ray weakness of these objects, but we cannot infer how many are affected by which factors, if any, from the existing data.
As a first step toward solving this puzzle, we have observed 17 of these optically–selected but RASS–undetected NLS1s with Chandra. Due to its excellent sensitivity and low background levels, Chandra is able to detect objects at far lower flux levels than ROSAT, and its large (0.5–8 keV) energy range allows detection of objects with harder X-ray spectra as well. Our primary goals are (1) to detect these objects in X-rays, or set upper limits to their X-ray emission, and (2) to obtain rough estimates of for the Chandra–detected NLS1s. Given this information, we can gain some insight as to which of the aforementioned scenarios (if any) sufficiently explain these ROSAT–unobserved NLS1s. In this paper we present the results of these Chandra observations, and the possible implications for the NLS1s in our sample.
2 Target Selection
A full description of the spectroscopic selection and preliminary X-ray analysis can be found in WPM02; a brief summary follows. The NLS1s in the WPM02 sample were initially selected from the SDSS Early Data Release (Stoughton et al., 2002) solely on the basis of narrow H emission. Subsequently, each spectrum was visually inspected and a more accurate measurement was taken of the H line width. Objects which did not fulfill the criteria of Osterbrock & Pogge (1985) and Goodrich (1989) were discarded. X-ray power law slopes and luminosities were estimated for the 45 objects with adequate RASS data available.
Figure 1 shows the SDSS magnitude–redshift distribution for the WPM02 sample, differentiating between NLS1s detected in RASS, those not detected, and those chosen for Chandra follow-up. In this diagram, the fainter, higher–redshift NLS1s are detected in the RASS less frequently, and most NLS1s with and were detected by RASS. We adopted these as rough limits for our follow–up sample. To rule out the possibility that high foreground extinction prevented some objects from being detected in the RASS, we restricted our sample to objects in regions of low Galactic H I column density111Found for each location using the nh utility, part of the HEAsoft package, available at http://heasarc.gsfc.nasa.gov/lheasoft/. ( cm-2, although one relatively bright NLS1 in the sample has cm-2). The resulting 17 objects which comprise this follow–up sample appear normal in all other respects.
3 Observations and Data Reduction
We observed the 17 NLS1s in this sample with Chandra for ksec each between 3 January and 15 September 2003. The Advanced CCD Imaging Spectrometer Spectroscopic array (ACIS-S; Garmire, 2003) was employed, and all observations were offset by 3′ from the nominal aimpoint along each detector axis to mitigate the effects of pileup should any of the sources be unexpectedly bright. This resulted in a slight () reduction in detector efficiency as well as a broadening of the point–spread function. Neither of these effects significantly hinders our source detection efficiency, thanks to Chandra’s exceptionally low background levels. These observing parameters allow detections of point sources down to (for respectively) in the 0.5–8 keV band.
3.1 Data preparation
All data were reprocessed with the newest version of the Chandra Interactive Analysis of Observations (CIAO 3.0.1) software employing the most recent calibration files (CALDB version 2.23).222Both available at http://cxc.harvard.edu/ciao/download_ciao_reg.html We then defined circular extraction regions that were centered on each source and of sufficient radius to encompass the PSFs (typically about 45). Background regions were defined as annuli with inner and outer radii of 75 and 15″ respectively. The CIAO tool psextract was used to extract source and background spectra for those objects with sufficient flux ( total counts). Additionally, we used dmextract to determine the raw number of counts for each source in the 0.5–0.9 (S), 0.9–2.0 (M), and 2.0–8.0 keV (H) bands. Finally, the apply_acisabs script was applied to each ancillary response file (ARF) in order to account for the time–dependent ACIS quantum efficiency degradation.333See http://cxc.harvard.edu/cal/Acis/Cal_prods/qeDeg/ for details.
All 17 NLS1s in this sample were detected by Chandra, 16 with high () significance. Table 1 lists the net, background subtracted, number of counts per energy bin for each object. As expected, the background was found to be low, with 0–2 counts per band detected in the background extraction regions (i.e. less than 0.25 counts expected in the source region on average), for most of the observations. In only three cases were one or more background counts expected in the source region. Due to the low background levels, we assume the errors are simply Poisson errors on the raw number of source counts.
3.2 Determination of Power-Law Slope
We used the CIAO spectral fitting tool Sherpa to analyze the resulting data. Background levels are negligible ( count expected in the source extraction region) in all but two observations; for these two, we fit the background simultaneously with a power law model. For the twelve objects with sufficient counts to obtain binned spectra (with at least 5 counts per bin), we fit a simple power law with foreground Galactic absorption taken into account444 For fitting we used the statistic with the Gehrels (1986) variance function, which is the Sherpa default and applicable to data with few counts.. This model can be represented by the equation
| (1) |
where is the photoelectric absorption cross section of Galactic gas with effective column density , and is the observation–specific effective detector area encoded within each ancillary response function (ARF) file used within Sherpa. Knowing , and the overall normalization can be found through a simple two–parameter fit to the data.
For those objects too faint to be analyzed as binned spectra in Sherpa (and to check the consistency of our spectral fits) we employed a hardness ratio fitting method. This method reduces the problem to a one–parameter fit by disregarding the overall normalization of the spectrum (which can be determined afterwards from the total count rate, ). The hardness ratio is defined as , where and are now the net counts in some arbitrary hard and soft bands respectively. Assuming Poisson errors, (again using the raw number of counts per band to calculate errors, for those observations with non–zero background levels). We employed two different hardness ratios in this analysis, which we call HRa and HRb. HRa is analogous to the ROSAT “hardness ratio 2” parameter, where the soft and hard bands are 0.5–0.9 and 0.9–2 keV respectively. HRb takes advantage of the full Chandra energy range with soft and hard bands covering 0.5–2 and 2–8 keV, respectively. Again using the ARF and value specific to each observation, we used Sherpa to calculate HRa and HRb for a test value of . By iterating until the correct values of the hardness ratios were reached, we derived photon indices independently for each of HRa and HRb.
3.3 Consistency
For 15 of these NLS1s, was derived by using two or three of the methods discussed in the previous section. As a consistency check, we compared the results for individual objects. For the most part, especially for the brighter objects, the three measurements produced results well within of each other. However, there are systematic offsets. Values of derived from HRa are nearly always higher than those found using HRb, while Sherpa fits typically lie somewhere in between. This is as expected since the soft X-ray power-law slopes of NLS1s are known to be steeper than those in the hard band due to the commonly–observed soft excess (e.g. ROSAT: BBF96 vs. ASCA: Brandt, Mathur & Elvis 1997, although some of this offset may be due to calibration issues as described in Iwasawa, Fabian, & Nandra 1999). A slope over the entire energy range, as measured by Sherpa, would be in between the two. Since they contain the average spectral information, we list the from Sherpa fits in Table 2. If there are not enough counts for such a fit, we list the 0.5–8 keV (HRb) measurement since it covers the full energy range; for the lone observation with no 2–8 keV counts, the 0.5–2 keV measurement of is listed.
4 X-ray Spectral Properties
4.1 Detectability in the RASS
The NLS1s in this sample span a broad range of (best fit values of 0.25–3.15) and X-ray fluxes from near the detection limit of about 0.002 counts s-1 to almost 0.2 counts s-1. Taking the 0.5–2 keV flux derived from Sherpa for the twelve brightest objects, we used the PIMMS software555Portable, Interactive Multi-Mission Simulator Version 3.4, from NASA’s High Energy Astrophysics Science Archive Research Center, currently available at http://heasarc.gsfc.nasa.gov/docs/software/tools/pimms.html. to calculate the count rate expected in ROSAT. Exposure times for each position were taken from the RASS exposure maps666Available at http://www.xray.mpe.mpg.de/cgi-bin/rosat/rosat-survey. and the expected number of RASS counts was then computed for each object. Three of the sources, J10130102, J12140055, and J14490022 should have been easily detected with about 17, 17, and 22 counts, respectively. The second object may actually correspond to a nearby RASS source which was marginally detected and not cross-referenced in the SDSS database. Four other objects in this sample should be marginally detected by the RASS with counts; their nondetection may be due to Poisson error or uncertainty in the flux determination. The remaining ten objects were well below the RASS detection limit.
The X-ray luminosity of the three bright objects may have varied by a factor of two or more between their RASS and Chandra observations, which could account for their lack of detection in the RASS. Such long–timescale variability is not surprising, as it is commonly seen in NLS1s (e.g., Grupe, Thomas, & Beuermann, 2001). It is impossible to ascertain the degree of variability in the fainter objects; however, most of this sample could not have been detected in the RASS at the flux levels observed by Chandra. It is unlikely that all 14 of these 17 NLS1s were in an exceptionally low luminosity state during both the RASS and Chandra observations; thus, at least some of these objects must be intrinsically faint at ROSAT energies.
4.2 Photon Index–Luminosity Relation
It is likely that some combination of variability, X-ray hardness, and low X-ray luminosity resulted in these objects not being detected in the RASS. The latter two factors can fortunately be determined from these observations. The data in Table 2 show that many of the NLS1s with low are also the faintest X-ray sources. To determine whether this is a true effect, we calculated the monochromatic 1 keV (rest-frame) fluxes using the models derived through spectral fitting in Sherpa. For the fainter objects we calculated the expected flux from the best–fit hardness ratio models using Sherpa, with a fractional flux error equal to where is the total number of counts in the 0.5–8 keV band. Using the SDSS redshifts and an , , cosmology, the corresponding rest–frame luminosities were then calculated. These are given in Table 2, along with the optical Å monochromatic flux measured from the original SDSS spectra.
The relation between and is shown in Figure 2. Luminosities derived from Sherpa fitting are plotted as filled circles, and those estimated from the hardness ratio models are plotted as open circles. This figure shows a strong correlation between X-ray spectral slope and 1 keV luminosity. Grupe et al. (1999) found such a correlation among soft X-ray selected AGN, with a stronger correlation among NLS1s noted in Grupe (2004). No such correlation is seen in their broad–line AGN sample; additionally, Laor et al. (1997) do not find a significant correlation in their sample of bright, optically–selected quasars (although this may be due to the limited range of in these samples).
This relation has a slope of (where ); if the two hardest objects are excluded from the fit, then decreases to . Similar relations have been measured for NLS1s by Forster & Halpern (1996) with (where the luminosity is measured over the 0.1–2 keV range), while the Dai et al. (2004) quasar sample has (with ). When the luminosities of our sample are extrapolated to the 0.1–2 keV range using the best–fit models and the two lowest– points are excluded, the slope becomes , in agreement with Dai et al. (2004) but about 2 higher than the Forster & Halpern (1996) result (note that the choice of 0.1 keV or 0.2 keV as the lower bound of the energy range does not significantly affect the extrapolated luminosity). This latter discrepancy may be due to their sample being selected from the RASS, which is not as sensitive to flat–spectrum objects as Chandra.
For contrast, the relation caused by pure absorption (i.e. assuming a typical source with , determining what hardness ratio and would be observed with various intrinsic values, and recalculating using the simulated HRb assuming no prior knowledge of the intrinsic absorption) produces a slope closer to for cm-2. Most of the observed correlation thus cannot be explained simply by intrinsic absorption, although it could explain the hardest objects in this sample (). However, this would require large neutral column densities (), despite there being no sign of optical dust reddening. Moreover, it is unlikely that all four NLS1s with are strongly absorbed (see §4.4). A dust–poor absorber could, in principle, account for the extreme hardness and low X-ray luminosity of one or two of these objects.
The observed correlation may be a result of differing Eddington ratios. To test this, we estimated black hole masses and Eddington luminosities using the Kaspi et al. (2000) relation between , (5100Å), and FWHM(H) and applying the virial theorem. It should be noted that these estimates may be subject to systematic error since the Kaspi et al. (2000) sample contains very few NLS1s; however, this method should be sufficient to show general trends in the data. Values of FWHM(H) were taken directly from WPM02, and the 5100Å flux was measured from the SDSS spectra used in that study. Figure 3 demonstrates a strong correlation between and , which further indicates that the objects with the softest X-ray spectra have the highest relative accretion rates if . This is probably a reasonable assumption. Figure 4 shows that the 1 keV luminosity is correlated with the 5100Å luminosity for the bright and faint objects in this sample (with the notable exception of one point, which has and may be strongly absorbed). We can thus assume that both the optical and X-ray luminosities provide some indication of the bolometric luminosity. As expected, a correlation is also seen between and (5100Å), though it is somewhat weaker than that between and . This weakness is not surprising, since X-ray properties should physically be more closely linked with each other than with optical measurements.
Although is directly proportional to , it is thought to be inversely proportional to (e.g., Kuraszkiewicz et al., 2000), which could wash out the observed correlation for some samples. For this Chandra sample, the estimates span approximately two orders of magnitude, while spans three, so the correlation is observed. In samples with a larger range of black hole masses and luminosities (such as the Grupe 2004 BLS1s), this correlation would not be expected and, indeed, is not seen. The relation would also not be seen in samples with a smaller range of , unless the black hole mass range is correspondingly larger, as proposed for the Dai et al. (2004) sample. When the same analysis is performed for the WPM02 RASS objects, no correlation is observed. Instead, they cluster almost exclusively around the highest–, highest– members of the Chandra sample. This is not unexpected since the WPM02 RASS sample consists mostly of NLS1s near the RASS detection limit; they do not exhibit the range in luminosities (and hence ) or required to see the correlation. If the observed correlation is indeed due to differences in the Eddington ratio, then it is quite likely that this Chandra sample includes some NLS1s which are accreting far below the Eddington limit.
4.3 Spectral Features in J1449+0022
As noted in §4.1, J1449+0022 is the brightest object (in X-rays) in this sample and may have gone undetected in the RASS due to strong variability. Indeed, there appears to be a slight decrease in the Chandra count rate over the course of the 2 ksec observation. More interesting, however, is that the spectrum of this object is not well fit by a simple power law with Galactic foreground absorption, as seen in Figure 5; specifically, there appears to be an excess of soft photons over that expected from a power law. The X-ray continuum can be better fit using a slightly more complicated model; either a power law plus a blackbody (which yields and ), or a broken power law with , , and keV. There is also a significant dip in flux at keV with equivalent width keV. This absorption is similar to that seen in some other NLS1s (Leighly et al., 1997). Such a feature could be due OVII/OVIII absorption in a highly relativistic outflow (e.g., Pounds et al., 2003), but a more plausible model may be the Nicastro, Fiore, & Matt (1999) hypothesis of a strong Fe L complex at this energy.
4.4 Intrinsic Absorption
Four of the NLS1s in this sample exhibit spectra with . Since for low count rates and are highly degenerate, no individual object is bright enough to place a meaningful limit on its intrinsic absorption; thus, we cannot determine with confidence whether this X-ray hardness is intrinsic to the accretion process or merely caused by a high degree of absorption. The spectra of these four NLS1s were added together to determine whether they exhibit strong absorption as a group. We assumed all have typical and similar values at each redshift, and fit a corresponding model to the coadded spectrum. This resulted in a best-fit value of , but the fit is not particularly good and shows strong residuals. If we leave both and as free parameters, becomes zero (with a upper limit of ) and . The fit with no absorption is also much better ( compared to the absorption model). Based on this, it appears as though these flat–spectrum sources are not strongly absorbed as a group.
Of course, it is possible that one or two of these NLS1s could be strongly absorbed, particularly the faintest object (J12590102) since with only five total counts its influence on the coadded spectrum is small. If this object has an intrinsic X-ray luminosity and (similar to the brightest objects in our sample), an intrinsic neutral column density of would be required to reproduce the observed flux and . The input and luminosity of such a model can be adjusted to reproduce the other faint, hard sources as well, but somewhat high column densities () are typically required. Moreover, there is no indication of absorption in the optical spectra of these objects. Thus, we conclude that these objects most likely have intrinsically hard X-ray spectra, although the two hardest may be heavily obscured in the X-rays but not at optical wavelengths (cf. Risaliti et al., 2001; Nandra et al., 2004).
5 Comparison to Other NLS1 Samples
5.1 X-ray Spectral Slope
At first glance, this sample appears to exhibit a range of X-ray spectral slopes extending to much lower values than previously seen for NLS1s. However, the values listed are, for the most part, derived over a larger energy range than used by previous studies. For example, is measured by ROSAT over the 0.1–2.4 keV energy range for the 52 narrow- and broad-line Seyfert 1 objects in BBF96, while the 0.1–2.0 keV hardness ratio is used with the WPM02 sample. In order to ensure the energy bands overlap, we employ the HRa measurement of for comparison to these two samples.
It should be noted that the energy ranges used by these samples are slightly different nonetheless. Since HRa covers the 0.5–2.0 keV band, it does not extend to the 0.1 keV minimum energy of ROSAT, or to the 2.4 keV maximum energy used by BBF96. However, 28 of the WPM02 NLS1s detected in ROSAT have measurements for both HR1 (0.1–2.0 keV) and HR2 (0.5–2.0 keV). We rederived using the HR2 measurements and compared it to the values from HR1. Although the errors are larger, the HR2 s are consistent with those from HR1 in all but four objects. No systematic offset is seen between these two measurements. Thus, we assume that the s derived from ROSAT HR1 are good estimators of the spectral slopes over the 0.5–2 keV range. As for the BBF96 measurements extending to 2.4 keV while ours extend only to 2.0 keV, we expect this to be negligible for two reasons: first, few photons are emitted in the high–energy tail ( for ); and second, the ROSAT sensitivity decreases quite rapidly in this regime, so even fewer photons should be detected. Thus, the differing energy bands should have little effect on comparing these various samples.
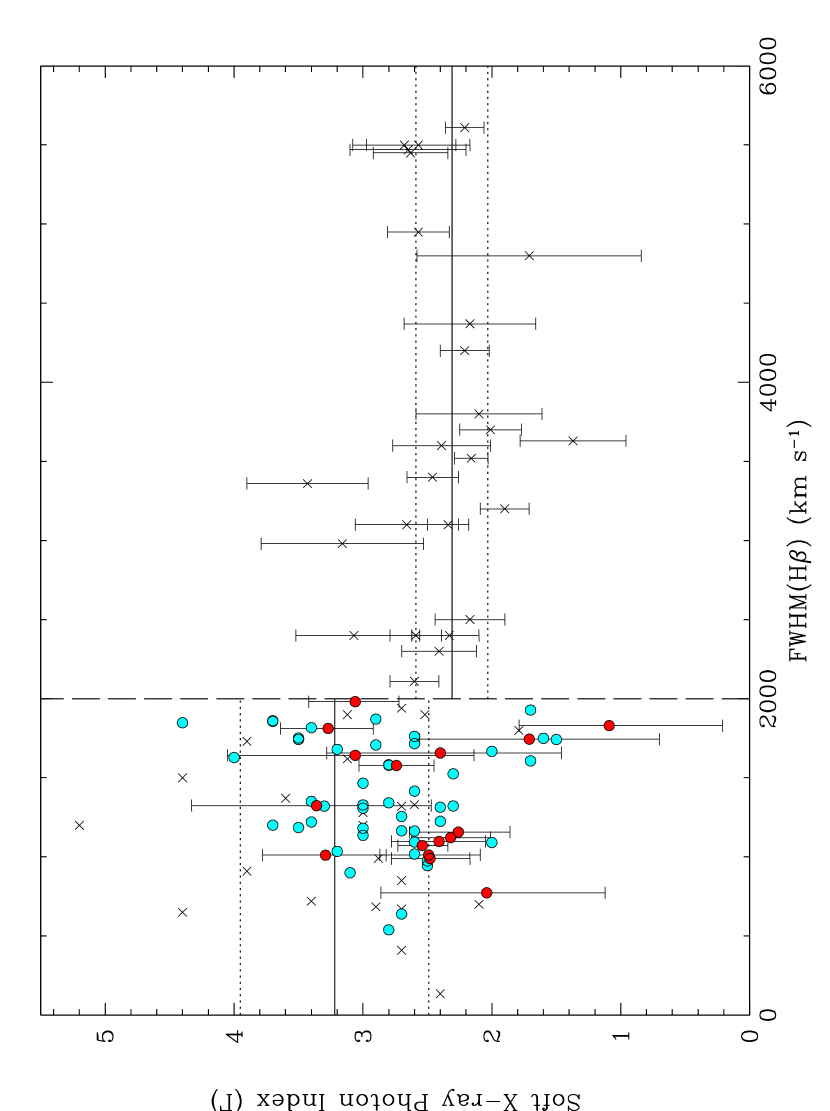
Figure 6 shows the relation between and the H velocity width for all three samples. Crosses denote BBF96 data, blue circles are the WPM02 RASS data, and the 16 Chandra objects with HRa measurements are shown as red circles with errorbars. The horizontal lines show the mean and sample standard deviation of for only the BBF96 data; NLS1 and Sy1 averages are computed separately. It is immediately apparent that the WPM02 and Chandra NLS1s do not fall within the same range as those in BBF96; in fact, a significant number appear to exhibit Seyfert 1–type X-ray spectra. Table 3 lists the mean and sample standard deviation of for the three samples. An interesting progression emerges: as we move from NLS1s which were found through a mixture of optical and X-ray selection (BBF96), to those which were selected solely based on their optical properties (WPM02), to the Chandra sample presented herein which was selected on the basis of weak X-ray emission, and the extremes of the distribution become harder. In fact, the distribution of this sample extends to lower values than that of the BBF96 Seyfert 1 galaxies. This illustrates the effect of selection methods on building NLS1 samples, as well as demonstrating the existence of a significant population of NLS1s which are not ultrasoft X-ray sources.
5.2 X-ray vs. Optical Luminosity
This Chandra sample was originally selected as a set of X-ray weak NLS1 candidates, i.e. NLS1s which were not detected in the RASS but had magnitudes similar to detected objects. To determine whether these objects are truly X-ray weak, we used the WPM02 RASS–detected NLS1s as a comparison sample. Rest–frame luminosities at 1 keV were calculated using PIMMS along with ROSAT count rates and the best–fit values given in WPM02, and 5100 Å luminosities were measured from the original SDSS spectra. The best–fit relation between the monochromatic optical and X-ray luminosities has a slope consistent with unity, and is plotted on Figure 4 along with the data points from the Chandra sample.
Interestingly, the RASS relation corresponds very well with the upper bound on the X-ray–optical relation for the Chandra NLS1s. Eight of these objects are consistent with the RASS fit and another three are consistent within , while the rest are significantly below the line. The faintest objects in X-rays appear to exhibit a slope similar to that of the brighter objects (if the point at the lower right of the plot, which is probably absorbed in X-rays, is excluded), but their X-ray luminosities are roughly a factor of 5 lower than those seen in the WPM02 RASS sample. Thus, although most of the objects in this sample are not particularly X-ray faint compared to NLS1s in the WPM02 RASS sample with similar optical luminosities, six of them do fall well below the relation due to intrinsic X-ray faintness or obscuration.
6 Discussion and Conclusions
Through short–duration Chandra observations of RASS–undetected NLS1s, we have determined that six of the 17 objects have X-ray luminosities substantially lower than NLS1s with similar optical properties. Of the brighter objects, at least two exhibit flux levels which should have been detectable by the RASS, indicating that their luminosities may have increased by a factor of two or more between the RASS and Chandra observations. Many of the remaining bright objects were near or just below the RASS detection limit, and were most likely not seen due to smaller luminosity variations or Poisson noise. Across the entire sample, a strong correlation is seen between the X-ray spectral slope and . This is probably not entirely due to intrinsic absorption, since individual spectra of bright objects as well as a coadded spectrum of the faintest objects do not indicate high degrees of absorption (although one or two of the faintest hard–spectrum objects may be absorbed in X-rays but not at optical wavelengths). If is indeed correlated with , then the relation suggests that variations in are primarly due to differences in among objects with comparatively similar black hole masses. This interpretation is complementary to that of Dai et al. (2004), who find a similar relation but whose sample more likely includes objects with a large range of but .
These observations may hold important implications for the “Eigenvector 1” (Principal Component 1; PC1) paradigm posited by Boroson & Green (1992) and reinforced by Boroson (2002). In this picture, PC1 (which is primarily driven by an anticorrelation between [O III] and Fe II) is an indicator of . NLS1s typically lie at one extreme end of PC1—the end thought to correspond to the highest relative accretion rates. Since is thought to be related to , and PC1 should be correlated; indeed, Brandt & Boller (1998) find such a correlation. However, the sample presented herein contains objects which from their optical spectra are at the supposed high– end of PC1, yet also exhibit very low values of , as well as low inferred .
These extreme objects may indicate that while PC1 is usually correlated with , it may also be affected by orientation, black hole mass, or other physical drivers (as noted by Boroson, 2004). This is not a completely new phenomenon; for example, BBF96 note that Mrk 507, with , has an unusually flat X-ray spectrum for a NLS1. This sample simply demonstrates that Mrk 507 is not an isolated case, and in fact a small but interesting subset of NLS1s do not appear to fit within the PC1 framework. The apparent lack of strong absorption in some of these flat sources indicates that their X-ray spectra actually are intrinsically flat. Further studies of X-ray weak NLS1s, as well as much larger samples from surveys such as the SDSS, should offer greater insight into the mechanism(s) behind PC1.
Due to the short exposure times of these observations ( ksec), we cannot infer much outside of and luminosity estimates for individual objects; indeed, this program was intended to study the group properties of an X-ray weak NLS1 sample. However, there are several objects in this sample with exceptionally low which may be worthy of further study. These hard X-ray NLS1s may represent a new, rare subclass which are optically normal but highly absorbed in the X-rays, or which exhibit abnormally low , or both.
References
- Boller, Brandt, & Fink (1996) Boller, Th., Brandt, W. N., & Fink, H. 1996, A&A, 305, 53
- Boroson (2002) Boroson, T. A. 2002, ApJ, 565, 78
- Boroson (2004) Boroson, T. A. 2004, AGN Physics with the Sloan Digital Sky Survey, ed. G. T. Richards and P. B. Hall (San Francisco: ASP), in press
- Boroson & Green (1992) Boroson, T. A. & Green, R. F. 1992, ApJS, 80, 109
- Brandt & Boller (1998) Brandt, N. & Boller, T. 1998, Astron. Nachr., 319, 163
- Brandt, Mathur, & Elvis (1997) Brandt, W. N., Mathur, S., & Elvis, M. 1997, MNRAS, 285, L25
- Dai et al. (2004) Dai, X., Chartas, G., Eracleous, M., & Garmire, G. P. 2004, ApJ, in press (astro-ph/0401013)
- Forster (1999) Forster, K. 1999, Ph.D. Thesis, Columbia University (New York)
- Forster & Halpern (1996) Forster, K., & Halpern, J. P. 1996, ApJ, 468, 565
- Garmire (2003) Garmire, G. P. 2003, Proc. SPIE, 4851, 28
- Gehrels (1986) Gehrels, N. 1986, ApJ, 303, 336
- Goodrich (1989) Goodrich, R. W. 1989, ApJ, 342, 234
- Grupe et al. (1999) Grupe, D., Beuermann, K., Mannheim, K., & Thomas, H.-C. 1999, A&A, 350, 805
- Grupe (2000) Grupe, D. 2000, NewAR, 44, 455
- Grupe, Thomas, & Beuermann (2001) Grupe, D., Thomas, H.-C., & Beuermann, K. 2001, A&A, 367, 470
- Grupe, Thomas, & Leighly (2001) Grupe, D., Thomas, H.-C., & Leighly, K. M. 2001, A&A, 369, 450
- Grupe et al. (2004) Grupe, D., Wills, B. J., Leighly, K. M., Meusinger, H. 2004, AJ, in press (astro-ph/0310027)
- Grupe (2004) Grupe, D. 2004, AJ, in press (astro-ph/0401167)
- Iwasawa, Fabian, & Nandra (1999) Iwasawa, K., Fabian, A. C., & Nandra, K. 1999, MNRAS, 307, 611
- Kaspi et al. (2000) Kaspi, S., Smith, P.S., Netzer, H., Maoz, D., Jannuzi, B.T., & Giveon, U., 2000, ApJ, 533, 631
- Kuraszkiewicz et al. (2000) Kuraszkiewicz, J., Wilkes, B. J., Czerny, B., & Mathur, S. 2000, ApJ, 542, 692
- Laor et al. (1997) Laor, A., Fiore, F., Elvis, M., Wilkes, B. J., & McDowell, J. C. 1997, ApJ, 477, 93
- Leighly (1999) Leighly, K. M. 1999, ApJS, 125, 317
- Leighly et al. (1997) Leighly, K. M., Mushotzky, R. F., Nandra, K., & Forster, K. 1997, ApJ, 489, L25
- Leighly et al. (2001) Leighly, K. M., Halpern, J. P., Helfand, D. J., Becker, R. H., & Impey, C. D. 2001, AJ, 121, 2889
- Nandra et al. (2004) Nandra, K., Georgantopoulos, I., Brotherton, M., & Papadakis, I. E. 2004, MNRAS, in press (astro-ph/0311029)
- Nicastro, Fiore, & Matt (1999) Nicastro, F., Fiore, F., & Matt, G. 1999, ApJ, 517, 108
- Osterbrock & Pogge (1985) Osterbrock, D. E. & Pogge, R. W. 1985, ApJ, 297, 166
- Pounds, Done, & Osborne (1995) Pounds, K. A., Done, C., & Osborne, J. P. 1995, MNRAS, 277, L5
- Pounds et al. (2003) Pounds, K. A., King, A. R., Page, K. L., & O’Brien, P. T. 2003, MNRAS, 346, 1025
- Risaliti et al. (2001) Risaliti, G., Marconi, A., Maiolino, R., Salvati, M., & Severgnini, P. 2001, A&A, 371, 37
- Stoughton et al. (2002) Stoughton, C., et al. 2002, AJ, 123, 485
- Voges et al. (1999) Voges, W., et al. 1999, A&A, 349, 389
- Wang, Brinkmann & Bergeron (1996) Wang, T., Brinkmann, W., & Bergeron, J. 1996, A&A, 309, 81
- Williams, Pogge & Mathur (2002) Williams, R. J., Pogge, R. W., & Mathur, S. 2002, AJ, 124, 3042
- York et al. (2000) York, D. G., Adelman, J., Anderson, J.E., et al. 2000, AJ, 120, 1579


| SDSS NameaaFormat: SDSS JHHMMSS.ssDDMMSS.s | Date | SbbNet counts in soft (0.5–0.9 keV), medium (0.9–2.0 keV), hard (2.0–8.0 keV) bands. | MbbNet counts in soft (0.5–0.9 keV), medium (0.9–2.0 keV), hard (2.0–8.0 keV) bands. | HbbNet counts in soft (0.5–0.9 keV), medium (0.9–2.0 keV), hard (2.0–8.0 keV) bands. | ccGalactic foreground H I column density, found with the nh utility. | CRddNet Chandra 0.5–8 keV count rate. | |
|---|---|---|---|---|---|---|---|
| (s) | ( cm-2) | () | |||||
| J002305.03010743.5 | 25–08–2003 | 1940 | 30 | 44 | 13 | 2.81 | |
| J002752.39002615.8 | 03–09–2003 | 1560 | 7 | 21 | 14 | 2.72 | |
| J015652.43001222.0 | 12–09–2003 | 1710 | 8 | 6 | 3 | 2.62 | |
| J022756.28005733.1 | 23–06–2003 | 1730 | 6 | 10 | 7 | 2.84 | |
| J022841.48005208.6 | 24–06–2003 | 2000 | 51 | 65 | 22 | 2.76 | |
| J031427.47011152.4 | 03–09–2003 | 1910 | 48 | 43 | 9 | 5.70 | |
| J101314.86005233.5 | 08–01–2003 | 1990 | 63 | 70 | 14 | 3.64 | |
| J104230.14010223.7 | 20–02–2003 | 1730 | 33 | 42 | 12 | 3.72 | |
| J121415.17005511.4 | 07–02–2003 | 1960 | 49 | 42 | 12 | 1.94 | |
| J125943.59010255.1 | 04–03–2003 | 1940 | 0 | 2 | 3 | 1.62 | |
| J131108.48003151.8 | 10–03–2003 | 1730 | 7 | 6 | 0 | 1.90 | |
| J141234.68003500.0 | 07–01–2003 | 2090 | 36 | 48 | 16 | 3.29 | |
| J143030.22001115.1 | 23–04–2003 | 1950 | 5 | 10 | 9 | 3.15 | |
| J144932.70002236.3 | 09–07–2003 | 2150 | 129 | 165 | 68 | 3.75 | |
| J145123.02000625.9 | 22–04–2003 | 2120 | 52 | 74 | 14 | 3.84 | |
| J170546.91631059.1 | 17–09–2003 | 1940 | 6 | 8 | 2 | 2.57 | |
| J233853.83004812.4 | 28–08–2003 | 1910 | 28 | 23 | 11 | 3.88 |
| NameaaTruncated to JHHMMDDMM | zbbRedshift from the SDSS catalog, as listed in WPM02 | FWHM(H)ccFrom WPM02 | ddDerived from spectral fitting in Sherpa, unless noted otherwise. | e,ge,gfootnotemark: | f,gf,gfootnotemark: | hhEstimated from the Kaspi et al. (2000) relation. | Note |
|---|---|---|---|---|---|---|---|
| (km s-1) | (erg s-1) | (erg s-1) | |||||
| J00230107 | 0.166 | 1160 | 6.73 | ||||
| J00270026 | 0.205 | 1830 | 7.14 | ||||
| J01560012 | 0.163 | 1320 | 6.82 | 1 | |||
| J02270057 | 0.128 | 770 | 6.04 | 1 | |||
| J02280052 | 0.186 | 990 | 6.57 | ||||
| J03140111 | 0.387 | 1810 | 7.69 | ||||
| J10130052 | 0.276 | 1580 | 7.38 | ||||
| J10420102 | 0.116 | 1010 | 6.46 | ||||
| J12140055 | 0.396 | 1980 | 7.62 | ||||
| J12590102 | 0.394 | 1460 | 7.39 | 1 | |||
| J13110031 | 0.429 | 1640 | 7.60 | 2 | |||
| J14120035 | 0.127 | 1100 | 6.31 | ||||
| J14300011 | 0.103 | 1740 | 6.60 | ||||
| J14490022 | 0.081 | 1070 | 6.31 | 3 | |||
| J14510006 | 0.139 | 1120 | 6.48 | ||||
| J17056310 | 0.119 | 1660 | 6.81 | 1 | |||
| J23380048 | 0.170 | 1010 | 6.43 |
Note. — (1) derived from HRb; (2) derived from HRa; (3) Spectrum not well fit with power law Galactic absorption model; see §4.3.
| Sample | Range | ||
|---|---|---|---|
| BBF96 NLS1s | 3.22 | 0.73 | 1.8–5.2 |
| WPM02 (RASS) | 2.75 | 0.31 | 1.5–4.4 |
| This Paper | 2.60 | 0.39 | 1.1–3.4 |
| BBF96 Sy1s | 2.31 | 0.28 | 1.4–3.4 |