A Chandra Study of the Core of the Nearby Cluster Abell 576
Abstract
We present data from a Chandra observation of the nearby cluster of galaxies Abell 576. The core of the cluster shows a significant departure from dynamical equilibrium. We show that this core gas is most likely the remnant of a merging subcluster, which has been stripped of much of its gas, depositing a stream of gas behind it in the main cluster. The unstripped remnant of the subcluster is characterized by a different temperature, density and metalicity than that of the surrounding main cluster, suggesting its distinct origin. Continual dissipation of the kinetic energy of this minor merger may be sufficient to counteract most cooling in the main cluster over the lifetime of the merger event.
Subject headings:
cooling flows — galaxies: clusters: individual (Abell 576) — intergalactic medium — X-rays: galaxies: clusters1. Introduction
The study of the cores of clusters of galaxies has undergone a renaissance in the past few years with the launch of the Chandra and XMM-Newton observatories. While previous observatories lacked the spatial resolution necessary to resolve structure within the cores of clusters, this new generation of telescopes has revealed an astonishing level of complexity in the structure of the intracluster medium (ICM). Many clusters previously thought to be relaxed, regular systems have proven to be far from dynamical equilibrium, particularly in their cores (e.g. Markevitch, Vikhlinin, & Mazzotta, 2001; Mazzotta, Edge, & Markevitch, 2003). Abell 576 is no exception. Earlier data, especially optical spectra of the cluster’s galaxy population, hinted at dynamical complexity in the cluster core (Mohr et al., 1996), but earlier X-ray observations showed the cluster to be quite regular and even cooler in the center, suggesting either a cooling flow or multi-phase gas with a very cool component (Rothenflug et al., 1984; Mohr et al., 1996).
With its low redshift, Abell 576 makes excellent use of the capabilities of Chandra, allowing us to examine in detail the very core of the cluster. In this paper, we focus on the dynamical activity in the core of cluster. The cluster shows strong evidence, first suggested by Mohr et al. (1996) from an analysis of the galaxy population, of the remnant core of a small merged subcluster. We demonstrate that the X-ray data are consistent with this picture, and even suggest it as the most likely origin for the non-equilibrium gas at the center of Abell 576. In fact, the subcluster may still be in the process of settling into the center of the main cluster’s potential.
Throughout this paper, we use the cosmological parameters derived from the first release WMAP results (Bennett et al., 2003), so kpc at . All errors are quoted at 90% confidence unless otherwise stated.
2. Observation and Data Reduction
The data were obtained during Chandra Cycle 3 in a single exposure of 38.6 kiloseconds. The focus was set on the back-illuminated S3 chip, although significant flux from the cluster is detected on the adjacent front-illuminated S2 chip. The standard background reduction for Very Faint (VF) mode data was applied using the CIAO tool acis_process_events. In addition, the data were corrected for charge transfer inefficiency (CTI) using the CXC/MIT CTI-corrector in CIAO version 2.3111http://asc.harvard.edu/ciao/, although this only corrects the front-illuminated chips such as the S2. They were then filtered on the standard ASCA grades 0, 2, 3, 4, and 6. The data were processed using version 2.18 of the Chandra CALDB. CTI-corrected blank sky background files222http://hea-www.harvard.edu/maxim/axaf/acisbg/ provided by Maxim Markevitch were used for the background correction. The VF mode background reduction was also applied to the background files.
The final 10.7 ksec of the observation was contaminated by a background flare. The flare was of the hard spectrum variety, which affects both the front- and back-illuminated chips. Unlike the soft flares that Chandra sometimes experiences, which affect only the back-illuminated chips, the spectra of these hard flares are not consistent from flare to flare, and therefore cannot be modeled (Markevtich, 2002). We therefore excised the contaminated data, and only consider here the first 27.9 ksec of the observation.
Because of the small field of view of the S3 chip and the low redshift of Abell 576, our analysis is mostly restricted to the central 200 kpc of the cluster.
For the spectroscopic analysis we considered only data in the range 0.5–8 keV. Below this range the calibration of the ACIS CCDs is less certain, and above this range the data contain few photons and are dominated by particle background. Spectral response matrices were corrected for the reduction in quantum efficiency at low energies using the time-dependent but spatially invariant acisabs model provided by the Chandra X-ray Center. Because of spatial variations in the contaminant, the correction is not exact, especially below 1.2 keV where the effect increases. For this reason, we kept the absorption column fixed to the Galactic value of cm-2 (Dickey & Lockman, 1990) in the spectral fits presented here. As a test, we allowed the absorption column to vary, and measured a column density nearly identical to the Galactic value, but with substantial errors, typically on the order of 10%. The only effect of allowing the absorption to be a variable parameter was to increase the errors in our determinations of the other free parameters. Thus, we concluded that it was preferable to leave the absorption fixed at the Galactic value.
3. Brightness Edges
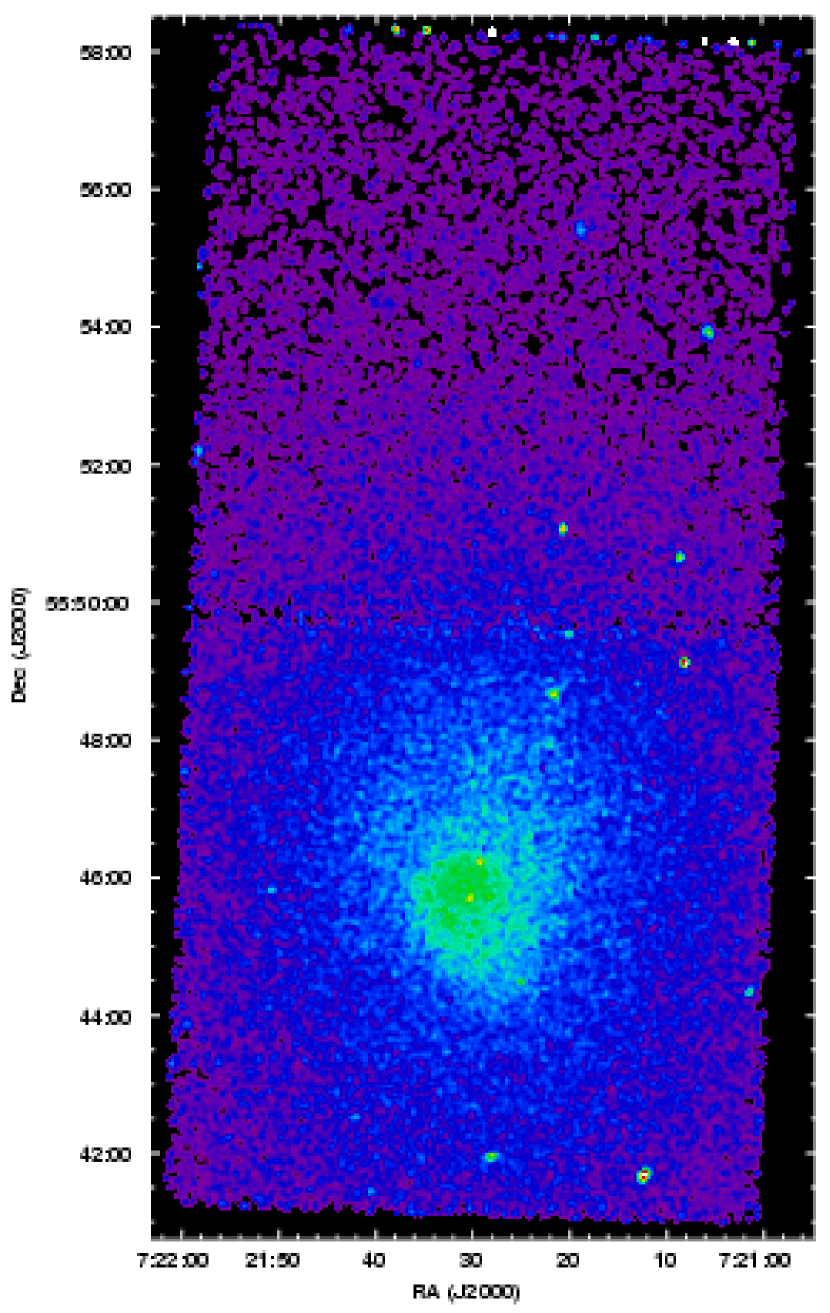
Figure 1 shows a Gaussian smoothed, exposure-corrected image of the cluster. At least two, and perhaps more, surface brightness edges are visible within the central 50 kpc. As shown below, they encompass a region of cool, high-metalicity gas. This cool gas also extends in a finger to the north of the cluster core, slightly west of center. As we will discuss in the remainder of this section, we believe this finger of gas to have originated in a small subcluster which is currently accreting into the center of the main cluster. The orientation of the edges are not consistent with gas simply sloshing back and forth in a more or less fixed potential, which would create parallel edges (Quilis, Bower, & Balogh, 2001) as opposed to the roughly triangular configuration observed. The observed edges are more consistent with being the outer edges of a wake of stripped gas left behind by a merging subcluster. In this picture, the subcluster initially fell in from the north, slightly to the west of the main cluster’s center, passed the main cluster center once, and is now making it’s second pass of the cluster’s center. The west and southeast edges describe the outer edges of the wake of stripped gas from it’s previous and current pass of the main cluster’s center. This hypothesis also neatly explains the finger of gas to the north, which cannot be easily explained by simple sloshing.

| () | |||||||
|---|---|---|---|---|---|---|---|
| model | (keV) | () | ( yr-1) | (keV) | (keV) | d.o.f. | |
| mekal | 357 | 297 | |||||
| mekal + mkcflow | 322 | 295 | |||||
| mekal + mekal | 289 | 295 |
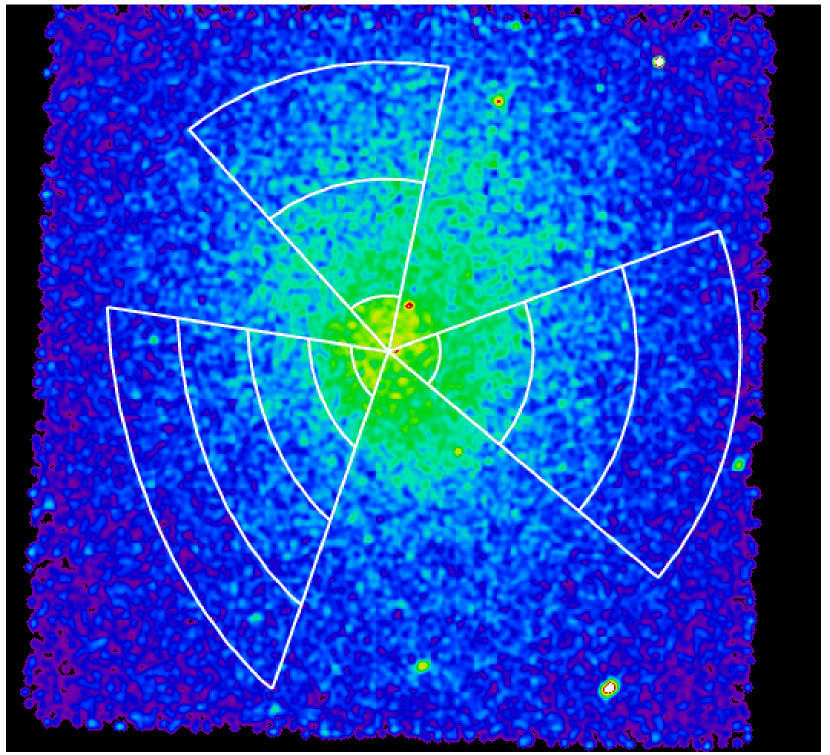
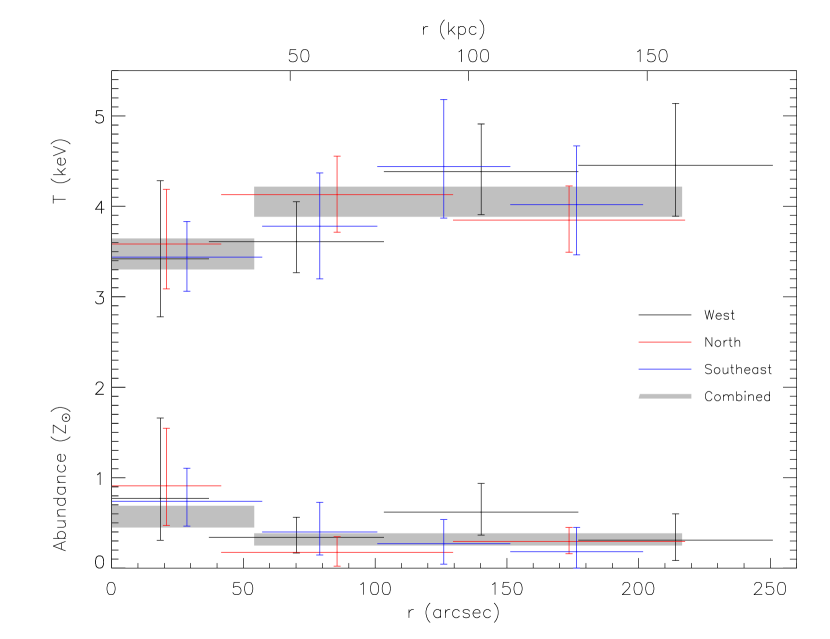
We extracted surface brightness and spectral profiles across all three edges using the regions shown in Figure 2. The brightness edge 40″ north of the peak of the X-ray emission shows by far the largest jump in surface brightness: a factor of (1) increase across the discontinuity (see Figure 3). A large jump in the abundance is also visible across the discontinuity, while the temperature does not change significantly (see the points with red error bars in Figure 4). This jump in abundance is significant at more than 90% confidence across the north edge. At the low temperature of Abell 576, the increased abundance across the edge has a non-negligible effect on the emissivity of the gas. This is illustrated in Figure 3, which shows the surface brightness profile across the north edge. Outside the brightness edge, the solid line is a -model fit to the data using the core radius and slope determined from observations with Einstein (Mohr et al., 1996). Inside the edge, we use the same -model, but we increase the emissivity by an amount expected from each of three different models: the dotted line indicates the increased surface brightness due to the increase in density alone; the dashed line indicates the increased emissivity due to the higher abundance; and the solid line is the increased brightness due to both effects. For all three models we assume spherical symmetry for consistency with the deprojection analysis. As the figure demonstrates, neither the added emissivity from the higher abundance nor that from the increased density can account entirely for the observed increase in surface brightness, but the two effects combined reproduce the overall normalization of the central brightness quite well. We note that had we kept the abundance in our spectral models fixed, we would have underestimated the emissivity of the gas inside the brightness edge, and would therefore have overestimated its density. This would then overestimate the density contrast across the edge, which would negatively affect the analysis that follows.
We deprojected the surface brightness, which, when combined with the temperature and abundance profiles, allowed us to determine deprojected density and pressure profiles across the edge, under the assumption of spherical symmetry. We find a small jump in both the density and the pressure across the north edge. The density increases by a factor of while the pressure increases by a factor of (both 1). In order for the higher density gas to remain confined, the pressure difference across the edge must be balanced by ram pressure from motion of the high density gas through the lower density gas. The observed pressure difference implies that the higher density gas is moving through the lower density gas with a velocity of km s-1, or Mach at the sound speed of the lower density gas (both errors are 1). We note that if we had failed to account for the increase in abundance across the edge, that is, if we had assumed a constant abundance on both sides of the edge, we would have overestimated the density jump across the edge and consequently would have overestimated the velocity of the dense gas cloud. The velocity we measure is consistent with velocities of both merging/accreting subclusters measured in other clusters (e.g. Markevitch et al., 2000) and with velocities measured for some “sloshing” edges in the cores of relaxed cluster (Markevtich, 2003). On its own, then, the measured velocity of the north edge is incapable of distinguishing between these two scenarios for the creation of the non-hydrostatic features in the cluster core.
To the southeast of the cluster center, a fainter edge is visible in the image (see Figure 1). Another yet fainter edge appears to the west. Both of these edges display the same abundance gradient as the north edge, though in both cases the abundance jump appears to be more of a gradient than a sharp edge, and is measured with much less significance (see Figure 4).
A combined spectral analysis of all 3 of sectors yields improved statistics at the cost of spatial resolution. This is plotted as the solid grey boxes in Figure 4. The best-fit models for the combined spectra outside the edges are given in Table 1. The columns are as follows: (1) spectral model; (2) & (3) temperature and abundance, respectively, of primary MEKAL model; (4) Cooling rate of MKCFLOW model; (5) minimum temperature of cool gas in MKCFLOW model; (6) temperature of second MEKAL model, where the abundance of the second model is tied to that of the primary MEKAL model; (7) & (8) and number of degrees of freedom for the fit. From this combined analysis, we find that the central abundance is different from the abundance outside the edges at greater than 90% confidence. As expected, the temperature measured outside the edges is approximately equal to the mean temperature measured with higher spatial resolution in the individual sectors. However, when fit with a two temperature model, the best-fit high temperature is only slightly higher than for the single temperature model, while the cool temperature is keV and contributes only 5% to normalization of the model spectrum. (Because of the errors on this measurement and given that our spectral fit only includes data at energies keV, this cool component should be considered an upper limit of keV.) Similarly, a single temperature plus cooling flow model yields a relatively small mass accretion rate of but to a very low temperature of less than keV. An F-test shows that the two temperature model is a better fit than the single temperature model at about the 3 level, while the cooling flow model is better than the single temperature by only 1. In both multi-phase models, the cooler component contributes a very small fraction of the total emission.


| () | |||||||
|---|---|---|---|---|---|---|---|
| model | (keV) | () | ( yr-1) | (keV) | (keV) | d.o.f. | |
| mekal | 186 | 188 | |||||
| mekal + mkcflow | 183 | 186 | |||||
| mekal + mekal | 181 | 186 | |||||
| mekal + foreground | aaTemperature and abundance of foreground component taken from single-temperature fit in Table 1. | 186 | 188 |
While a radial temperature gradient across the region used for our analysis (30–150 kpc) would show qualitatively similar effects, we would expect such a gradient to cover a relatively small range of temperatures, say, a factor of 2 as is seen in the most relaxed cooling flow systems e.g. Peterson et al., 2001; Blanton, Sarazin, & McNamara, 2003. To find gas at a temperature less than of the ambient temperature is quite unusual. The merging subcluster hypothesis mentioned above provides an attractive explanation for this extremely cool gas, if the cool gas has been stripped from the subcluster during its infall. The small radius of curvature of the north edge suggests that this remnant core is physically quite small and that the original subcluster was also relatively small and therefore cool. This provides a consistent qualitative explanation for the presence of the cool component. Unfortunately, given the large amount of gas likely to have been stripped from the subcluster during infall, it is not possible for us to determine the subcluster’s original mass and virial temperature and is therefore not possible to conclude whether or not the cooler gas is consistent with having originated in the undisturbed subcluster. We note, however, that the “sloshing” picture for the brightness edges cannot explain the existence of the cool component. Sloshing would create the same general appearance of a cold front (e.g. Markevitch et al., 2001), but would not cause the higher density gas to cool any more than it would in the absense of the sloshing.
An alternative explanation for the presence of gas at less than of the ambient temperature is that the usual method of preventing a classical cooling flow from developing, whether that be AGN heating, conduction, or some other mechanism, is absent or suppressed in A576. Indeed the absence of the characteristic “bubbles” seen in other clusters (e.g. Fabian et al., 2000; McNamara et al., 2000; Blanton et al., 2001) suggests there has been no recent strong AGN activity, for one. However, we find this explanation to be unsatisfactory, since it would require the existence of a strong cooling flow, which is explicitly ruled out by the small cooling rate determined above.
4. Cooling Flow
As Figure 4 shows, the temperature drops in the very core of the cluster, that is, inside the brightness edge. It is natural to ask, then, if this gas shows any evidence of being multi-phase. To test this, we fit a spectrum of the gas in the core with a single-temperature absorbed MEKAL model (Kaastra, 1992), with a MEKAL model plus a multi-phase MEKAL model (MKCFLOW model), and with the sum of two MEKAL models. The salient parameters of the fits are shown in Table 2. The columns are as follows: (1) spectral model; (2) & (3) temperature and abundance, respectively, of primary MEKAL model; (4) Cooling rate of MKCFLOW model; (5) minimum temperature of cool gas in MKCFLOW model; (6) temperature of second MEKAL model, where the abundance of the second model is tied to that of the primary MEKAL model; (7) & (8) and number of degrees of freedom for the fit. As shown by the similar fit statistics, the goodness of fit of all three models are essentially identical.
The spectroscopic cooling rate we measure is quite low: an order of magnitude smaller than the “classical cooling flow” accretion rate of M☉ yr-1 derived from the gas mass and cooling time in the inner 30 kpc (see Figure 5 and §5 below). We note that the cool component in the two-temperature model only contributes 0.1% to the overall normalization of the model. This is consistent with the extremely small cooling rate measured for the cooling flow model.
When the second temperature component of the two-MEKAL model was set to the parameters of the fit to the outer gas (the equivalent of deprojection), the fit was no better than for the single-temperature model. This is perhaps not too surprising, however, since the contribution of the projected foreground component to the overall normalization of the model is only about 2%.
Surprisingly, the best-fit low temperature in the cooling flow model, that is, the temperature to which the gas cools, is equal to the minimum temperature allowed by the model, keV. However, the error on the fit allows for to be as high as 0.9 keV. This is about 1/4 of the ambient temperature, which is consistent with minimum temperatures found in stronger cooling flows (e.g. Peterson et al., 2001). The low temperature of this gas is consistent with that of the cool gas found at larger radii.
In short, we find essentially no evidence of multi-phase gas in the central cool core. Of the models described above, the cooling flow model contributes the largest contribution from multi-phase gas to the overall emission, with only 5% of the emission coming from the multi-phase gas.
5. Suppression of Cooling
Given that we observe essentially no cooling in either the core or outside the core in what is otherwise a quite relaxed cluster, we now explore whether the dissipation of the kinetic energy of the remnant core is capable of suppressing cooling at the observed level. In the rest of this section we take the merging subcluster hypothesis to be the correct explanation of the brightness edges.
We determined the kinetic energy of the gas inside the north edge using the velocity of the edge we measured above plus a gas mass determined from the deprojected density profile inside the edge (). We then calculated the rate of energy input from the dissipation of this kinetic energy over a variety of timescales. Figure 5a shows this energy dissipation rate compared to the luminosity due to radiative cooling as a function of radius. The timescale used for calculating the heating rate is three crossing times of the cluster to the given radius at the current velocity of the north edge. In three crossing times, the moving cool core will have swept up its mass in gas, reducing its kinetic energy by . We therefore assume perfectly efficient thermalization of of the kinetic energy over a timescale equal to three crossing times by the core at its current velocity in calculating the heating rate.
If we take the point at which the west and southeast edges converge as indicative of the current orbital radius of the subcluster (100 kpc from the cluster center), the dissipation timescale derived using the above method is years. As can be seen from Figure 5b, the heating simply from the dissipation of the kinetic energy of the subcluster is capable of suppressing cooling by a factor of more than 4 in the inner 100 kpc over this timescale. If the dissipation of the core’s kinetic energy is spread out over years, cooling can still be suppressed at the level observed in the inner 30 kpc. Numerical simulations have shown that mergers of unequal mass clusters thermalize their kinetic energy on timescales of one to a few times years (Ricker & Sarazin, 2001), although the mass ratio involved in A576 is probably much larger than has generally been tested in these simulations.
So far, we have omitted any discussion of the role of turbulence in suppression of cooling. Turbulence generated by the motion of such a small subcluster would eventually dissipate and be thermalized on a timescale yr (Fujita, Takizawa, & Sarazin, 2003), which is short compared to the timescale we are considering for dissipation of the kinetic energy. We therefore consider it reasonable to assume close to 100% thermalization efficiency. We have also neglected the influence of the dark matter on the total energy budget. This is not so easily dismissed, as the dark matter halo of the subcluster will take longer to dissipate its kinetic energy than will the gas. The dark matter oscillations about the center of mass of the system will induce additional motion in the gas, transferring kinetic energy from the dark matter to the gas and thereby increasing the total energy available for heating the gas. This will only serve to amplify the effect we have discussed. Our naïvely calculated heating rate should therefore be taken as a lower limit to the heating resulting from the subcluster merger.
Other alternatives for balancing cooling in clusters have been discussed. These include heating from central AGN (Churazov et al., 2002; Brüggen & Kaiser, 2002; Fabian et al., 2003), from conduction (e.g. Narayan & Medvedev, 2001), and from turbulent mixing (Kim & Narayan, 2003) induced by AGN activity. Our data show no evidence for the X-ray cavities typical of clusters with strong central AGN, and indeed the cluster has one extremely weak AGN at its center with no non-nuclear radio emission. Since these cavities tend to persist for several AGN duty cycles (e.g. Perseus, Fabian et al., 2000) and none are observed in A576, AGN heating can be ruled out, at least over the last few times years.
6. Conclusions
While earlier X-ray observations of Abell 576 have shown it to be quite regular on large scales, we have demonstrated that the core of the cluster is far from dynamical equilibrium. We found multiple surface brightness edges in the cluster center which we have demonstrated to be indicative of jumps in both density and abundance. Of the two most likely explanations for the existence of these edges, our analysis favors the hypothesis that they are formed by gas stripped from a merging subcluster. Most of the gas appears to have been stripped from the subcluster, leaving a core only 30 kpc in radius. The stripped gas has been found to have both a lower temperature and a higher abundance than the gas in the rest of Abell 576.
We find no evidence of gas cooling from the ambient temperature of the main cluster, but do find some suggestion of very cool gas at a temperature expected of gas that had condensed out of the ICM of the subcluster. The simple cooling rate derived from the gas mass and cooling time is an order of magnitude larger than the spectroscopically measured . We have demonstrated that dissipation of the kinetic energy of the observed remnant core of an infalling subgroup may be sufficient to reduce cooling to the observed rate, if that energy is dissipated over a timescale of years.
References
- Bennett et al. (2003) Bennett, C. L., Halpern, M., Hinshaw, G., Jarosik, N., Kogut, A. Limon, M., Meyer, S. S., Page, L., Spergel, D. N., Tucker, G. S., Wollack, E., Wright, E. L., Barnes, C., Greason, M. R., Hill, R. S. Komatsu, E., Nolta, M. R., Odegard, N., Peirs, H. V., Verde, L., & Weiland, J. L. 2003, ApJS, 148, 1
- Blanton et al. (2001) Blanton, E. L., Sarazin, C. L., McNamara, B. R., & Wise, M. W. 2001, ApJ, 558, L15
- Blanton et al. (2003) Blanton, E. L., Sarazin, C. L., & McNamara, B. R. 2003, ApJ, 585, 227
- Brüggen & Kaiser (2002) Brüggen, M. & Kaiser, C. R. 2002, Nature, 418, 301
- Churazov et al. (2002) Churazov, E., Sunyaev, R., Forman, W., & Böhringer, H. 2002, MNRAS, 332, 729
- Dickey & Lockman (1990) Dickey, J. M. & Lockman, F. J. 1990, ARA&A, 28, 215
- Fabian et al. (2003) Fabian, A. C., Sanders, J. S., Allen, S. W., Crawford, C. S., Iwasawa, K., Johnstone, R. M., Schmidt, R. W., & Taylor, G. B. 2003, MNRAS, in press (astro-ph/0306036)
- Fabian et al. (2000) Fabian, A. C., Sanders, J. S., Ettori, S., Taylor, G. B., Allen, S. W., Crawford, C. S., Iwasawa, K., Johnstone, R. M., & Ogle, P. M. 2000, MNRAS, 318, L65
- Fujita et al. (2003) Fujita, Y., Takizawa, M., & Sarazin, C. L. 2003, ApJ, 584, 190
- Kaastra (1992) Kaastra, J. S. 1992, An X-Ray Spectral Code for Optically Thin Plasmas, Tech. rep., Internal SRON-Leiden Report, updated version 2.0
- Kim & Narayan (2003) Kim, W.-T. & Narayan, R. 2003, ApJ, submitted (astro-ph/0308376)
- Markevitch et al. (2000) Markevitch, M., Ponman, T. J., Nulsen, P. E. J., Bautz, M. W., Burke, D. J., David, L. P., Davis, D., Donnelly, R. H., Forman, W. R., Jones, C., Kaastra, J., Kellogg, E., Kim, D.-W., Kolodziejczak, J., Mazzotta, P., Pagliaro, A., Patel, S., Van Speybroeck, L., Vikhlinin, A., Vrtilek, J., Wise, M., & Zhao, P. 2000, ApJ, 541, 542
- Markevitch et al. (2001) Markevitch, M., Vikhlinin, A., & Mazzotta, P. 2001, ApJ, 562, L153
- Markevtich (2002) Markevtich, M. 2002, in Proceedings of the Chandra Calibration Workshop (Cambridge: Chardra X-ray Center), http://asc.harvard.edu/ccw/proceedings/
- Markevtich (2003) Markevtich, M. 2003, in The Riddle of Cooling Flows in Galaxies and Clusters of Galaxies (Charlottesville: University of Virginia), in press (http://www.astro.virginia.edu/coolflow/)
- Mazzotta et al. (2003) Mazzotta, P., Edge, A., & Markevitch, M. 2003, ApJ, in press (astro-ph/0303314)
- McNamara et al. (2000) McNamara, B. R., Wise, M., Nulsen, P. E. J., David, L. P., Sarazin, C. L., Bautz, M., Markevitch, M., Vikhlinin, A., Forman, W. R., Jones, C., & Harris, D. E. 2000, ApJ, 534, L135
- Mohr et al. (1995) Mohr, J. J., Evrard, A. E., Fabricant, D. G., & Geller, M. J. 1995, ApJ, 447, 8
- Mohr et al. (1996) Mohr, J. J., Geller, M. J., Fabricant, D. G., Wegner, G., Thorstensen, J., & Richstone, D. O. 1996, ApJ, 470, 724
- Narayan & Medvedev (2001) Narayan, R. & Medvedev, M. V. 2001, ApJ, 562, L129
- Peterson et al. (2001) Peterson, J. R., Paerels, F. B. S., Kaastra, J. S., Arnaud, M., Reiprich, T. H., Fabian, A. C., Mushotzky, R. F., Jernigan, J. G., & Sakelliou, I. 2001, A&A, 365, L104
- Ricker & Sarazin (2001) Ricker, P. M. & Sarazin, C. L. 2001, ApJ, 561, 621
- Rothenflug et al. (1984) Rothenflug, R., Vigroux, L., Mushotzky, R. F., & Holt, S. S. 1984, ApJ, 279, 53
- Quilis et al. (2001) Quilis, V., Bower, R. G., & Balogh, M. L. 2001, MNRAS, 328, 1091