XMM-Newton Surveys of the Canada-France Redshift Survey Fields - II: The X-ray Catalogues, the Properties of the Host Galaxies, and the Redshift Distribution
Abstract
We present the X-ray source catalogues for the XMM surveys of the 3-h and 14-h Canada-France Redshift Survey fields ( flux range ). We use a subset of the XMM sources, which have Chandra positions, to determine the best method of obtaining optical identifications of sources with only XMM positions. We find optical identifications for of the XMM sources for which there are deep optical images. The sources without optical identifications are likely to be optically fainter and have higher redshifts than the sources with identifications. We have estimated ‘photometric redshifts’ for the identified sources, calibrating our method using galaxies in the fields with spectroscopic redshifts. We find that the redshift distribution has a strong peak at .
The host galaxies of AGN identified in this work cover a wide range of optical properties with every galaxy type being represented, and no obvious preference for one type over another. Redder types tend to be more luminous than blue types, particularly at lower redshifts. The host galaxies also span a wide range of optical luminosity, in contrast to the narrow range found for the starburst galaxies detected in radio surveys. We find a strong correlation between optical and X-ray luminosity similar to the Magorrian relation, although selection effects cannot be ruled out.
keywords:
galaxies:active - X-rays: galaxies - catalogue1 Introduction
Deep exposures with the most recent and powerful X-ray observatories, XMM-Newton and Chandra (e.g. Barger et al. 2003; Giacconi et al. 2002; Mainieri et al. 2002; McHardy et al. 2003; Page et al. 2003), have built on the deepest ROSAT X-ray surveys (e.g. McHardy et al. 1998; Hasinger et al. 1998) by going deeper and to higher X-ray energies with better positional accuracy. This has opened up the study of faint X-ray sources such as high redshift AGN, and has also revealed X-ray emission from otherwise normal galaxies at more modest redshifts (Hornschemeier et al. 2003). These surveys have now resolved the majority of the cosmic X-ray background (XRB) in the soft () X-ray band with a small fraction left unaccounted for in the hard () band (Moretti et al. 2003).
The nature of the XRB at these X-ray energies is well on the way to being understood but the peak in the XRB lies at a much higher energy (). This indicates that a population of very faint sources, with very hard spectra, make up the remaining fraction of the XRB in the hard band, and would also be expected to contribute a much greater fraction to the XRB nearer its peak (Moretti et al. 2003). Such hard sources are most likely a result of extremely high obscuration, which progressively wipes out X-ray emission from low to high energy, turning an intrinsically soft spectrum into a much harder observed one.
The radiation absorbed during this process must be re-emitted at longer wavelengths and the possibility of the Far-IR/Sub-mm background being somehow connected with the XRB is discussed in many papers (e.g. Almaini, Lawrence & Boyle 1999). However, current X-ray/Sub-mm surveys suggest that the two backgrounds are only loosely related (e.g. Waskett et al. 2003; Alexander et al. 2003; Severgnini et al. 2000). Future instrumentation with higher energy limits are likely required to fully explain the XRB and the nature of the sources that dominate its peak.
At present though, the emphasis must be turned to those sources that we can observe easily with the current instrumentation. QSOs and type-I AGN dominate the softest X-ray energies with an increasing contribution from more obscured type-II AGN becoming important at higher energies (e.g. Gilli, Salvati & Hasinger 2001). Identifying the optical counterparts to these sources is crucial for a full understanding of their properties and a great deal of effort has been expended in obtaining this information (e.g. Barger et al. 2003; McHardy et al. 2003).
For example, one of the most useful quantities that can be derived from a source list is the luminosity function. This reveals much about the nature of a population and determining its evolution with redshift can shed light on how the population as a whole changes over time. The X-ray luminosity function (XLF) has begun to be investigated in depth by several groups (Cowie et al. 2003; Steffen et al. 2003; Ueda et al. 2003). Both Ueda et al. (2003) and Steffen et al. (2003) find that the evolution of the XLF is a function of luminosity. The population of X-ray sources with is dominated by type-I AGN, and the number-density of these sources increases with redshift out to . At lower X-ray luminosities however, the fraction of type-II AGN increases rapidly with decreasing X-ray luminosity. The number-density of these sources appears to peak at .
Although Chandra is better suited for identifying X-ray sources with optical counterparts (XMM has a resolution of full width half maximum (FWHM) cf. for Chandra), XMM has greater sensitivity and a larger field of view (FoV), making it better for large area surveys. In this paper we report the results of a medium-deep XMM survey composed of two separate exposures ( square degrees). We quantify the ability of such a survey to identify X-ray sources with optical counterparts by comparing the IDs for a subset of the XMM sources with the IDs obtained using Chandra positions for the same sources. We estimate redshifts for our identified sources using photometric redshift codes. These allow a quick, and reasonably reliable, way of obtaining redshifts for objects with multi-band photometry. Although not as accurate as spectroscopy these techniques are becoming widely used as a short-cut for large surveys, where statistical properties are fairly insensitive to the accuracy of individual redshift measurements (Csabai et al. 2003; Fontana et al. 2000; Kashikawa et al. 2003). These methods can also be used on objects fainter than the spectroscopic limit, where many X-ray source counterparts reside (Alexander et al. 2001). We test two photometric redshift estimation codes on our X-ray source IDs and obtain a robust redshift distribution for those sources that could be identified reliably, while placing limits on the properties of those that could not.
Ultimately we will use our identified AGN, and their redshifts, to construct the XLF for different populations, and calculate its evolution with redshift. The results of this study will be reported in paper-III, the next in this series.
We assume an of and a concordance Universe with and .
2 X-ray Data
Two XMM surveys are considered in this work, X-ray surveys of the CFRS 3 and 14-h (also known as the Groth Strip) fields (Lilly et al. 1995a). The data reduction for these surveys, together with the comparison between SCUBA and XMM data, are described in detail in Waskett et al. (2003) (paper-I). The 14-h XMM data was first presented in Miyaji & Griffiths (2001). Both surveys are of duration. In this section we summarise some of the key points of the data analysis.
The raw X-ray data were reduced using v5.3 of the SAS software for XMM. Because XMM has a large spectral range the data were divided into two energy bands; the soft band includes photons in the range while the hard band covers . XMM has three X-ray cameras that operate simultaneously, so in total six images were used for the source detection: soft and hard bands for each of the two MOS cameras and also the PN camera. The source detection was performed simultaneously on all six images using the sliding box and maximum likelihood detection procedure within the SAS software, with the source extent fitting turned on. A photon index was assumed for the counts to flux conversion in both bands. The thresholds for the source detection were set to 10 for the sliding box part and 15 for the maximum likelihood part, ensuring sources were only detected at greater than about above the local background. Final source parameters were derived using data from both bands and all three instruments, for maximum accuracy and to minimise spurious detections from any single camera, while probing fainter fluxes. Using both soft and hard bands simultaneously also allows the detection routine to calculate a more accurate full flux. The final source list contains, amongst other parameters: source positions, fluxes in the soft, hard and full combined bands and the vignetting corrected hardness ratios for each source.
For this work the hardness ratio is defined as:
where and are the counts observed for a source in the hard and soft bands respectively, after correction for vignetting. Higher values indicate a harder spectrum.
In total there are 146 sources detected in the 3-h field and 154 in the 14-h field. Most are point sources. Tables 1 & 2 list the basic properties of a sample of the X-ray sources, in the two fields; the full tables for all the sources appear in the electronic version of the paper. Throughout this paper sources labelled with 3.* refer to 3-h field sources and those labelled with 14.* refer to sources in the 14-h field.
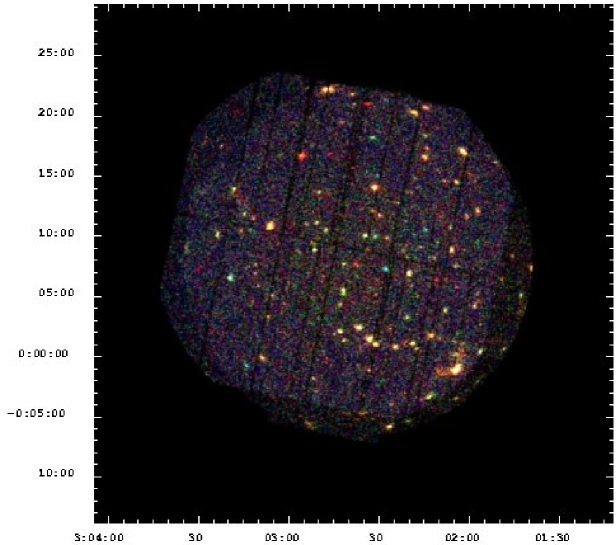
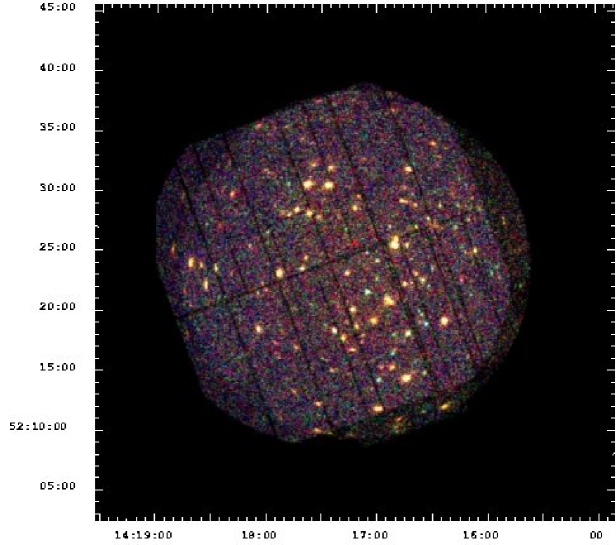
Figure 1 shows false colour images of the two fields considered in this work. Lowest energy X-rays are coloured red with progressively higher energy X-rays being coloured green and then blue. Sources with hard spectra therefore show up blue in these images and soft sources appear red. All the extended sources detected are in the 3-h field and the majority are concentrated in the diffuse red patch visible in the lower right hand corner of 3-h image, surrounding a bright QSO (source 3.1 in table 1 & 3). This could be indicative of a galaxy cluster and if the QSO is part of the cluster then the cluster has a redshift of 0.641. Unfortunately because the QSO is so bright it is hard to tell if it actually lies within a cluster, or whether the diffuse emission is simply an effect due to the broadening of the XMM point spread function towards the edge of the map. It is also unfortunate that this particular source lies off the edge of the deep optical map we use to identify the X-ray sources (see below), and so an optical cluster search of this region is not possible at this time. Digitized Sky Survey images of this region do not show any evidence for a galaxy cluster but do show the optical counterpart for the QSO.
Figure 2 shows the differential source counts versus both soft and hard band flux, for all the sources detected in the two fields. These plots clearly demonstrate the effect of incompleteness at lower fluxes where the source counts drop off dramatically. This effect begins to become important at fluxes of 1.5 and for the soft and hard band sources respectively. Above these fluxes we are effectively complete. This is comparable in depth to, for example, the HELLAS2XMM survey (Baldi et al. 2002), the early XMM Lockman Hole observations (Hasinger et al. 2001) and serendipitous Chandra observations (e.g. Gandhi et al. 2003), while reaching slightly deeper than the Serendipitous XMM Survey in the AXIS field (e.g. Barcons et al. 2002).


3 Optical Identifications
3.1 XMM
After correcting the XMM astrometry against known bright QSOs the process of identifying the X-ray sources with optical counterparts can be carried out. This process is important for the procedures in the following sections, especially in obtaining the redshift distribution of the AGN.
Both survey fields are coincident with the Canada-France Redshift Survey (CFRS) (Hammer et al. 1995; Lilly et al. 1995b) and the Canada-France Deep Fields survey (CFDF) (McCracken et al. 2001). The former covers a section in each field with spectroscopic redshifts for many of the galaxies, while the latter covers almost the entirety of both and reaches 3 magnitudes deeper () albeit with no spectroscopic follow-up. We therefore use the CFDF catalogue as the basis for our identification process and extract CFRS redshifts as appropriate to monitor the accuracy of the photometric redshift determination (see section 5). The CFDF data were taken with the Canada-France-Hawaii Telescope using the UH8K mosaic camera in , and , with data supplied by either the CTIO (3-h field) or the KPNO (14-h field). Total exposure time were typically hours for , and , and hours for . The lengthy data reduction process is described in detail in McCracken et al. (2001). Of the 146(154) X-ray sources in the 3-h(14-h) fields 115(149) lie within the CFDF regions.
To determine the optical identifications of the X-ray sources we have used the frequentist approach of Downes et al. (1986). Since XMM has a positional accuracy of (this is a worst case situation for large off axis angles; on axis positional accuracy is more like ), only of XMM sources will have positions which are away from the object that caused the emission. The first step in our ID procedure was thus to find all CFDF objects within of the XMM position. We then calculated the following statistic for each object:
where is the offset between the XMM position and that of the optical object, and is the surface density of optical objects brighter than the magnitude () of the possible association. It may appear that this statistic gives the probability that the candidate object is a foreground or background object and is not physically related to the XMM. However, is not a probability because it doesn’t take into account galaxies that are fainter than the magnitude of the candidate galaxy, and that might have had a lower value of . Therefore this possibility needs to be taken into account when deriving the sampling distribution of . Downes et al. (1986) describe an analytic way to do this. The end result is a true probability value, . Typically a value of is several times higher than the equivalent value. In all but two cases, we chose the CFDF object with the lowest value of as the most likely association. In these two exceptions, the galaxy with the lowest value of was close to away from the XMM position, and we preferred the candidate with a slightly higher value of but which was much closer to the XMM position (these two IDs are confirmed by the Chandra X-ray positions, sources 14.15 & 14.50). Table 4 gives the statistics for our candidate identifications.
A consequence of this method is that because fainter objects are more numerous, they will have higher values than brighter objects at the same offset. Therefore, relatively optically faint objects are seldom identified with X-ray sources, unless they are very close to the X-ray position. For example, at the optical completeness limit of an object at an offset of will have , which is the same as a 20.6 magnitude object at offset.
3.2 The Chandra Training Set
We initially chose a value of 0.1 as being our dividing line between identifications and objects that are likely to be physically unrelated to the X-ray source. The number of spurious identifications can be estimated by simply adding up the values of for objects with . This is in the 3-h field and in the 14-h field. In the two fields, 181 sources have , which is of the XMM sources for which there are deep CFDF images. The error rate of false associations is .
We were able to refine our identification criteria using the fact that part of the 14-h field has also been surveyed with Chandra (the NE quadrant). The Chandra data are not the focus of this paper but they are summarised here: The data were taken in August 2002 using the ACIS-I instrument and were reduced using the standard CIAO v2.3 data reduction software. The total good exposure time after screening was . Source detection was performed using the CIAO wavdetect algorithm (Freeman et al. 2002), run on images in the , , and bands, using a false source probability of . Full details of the Chandra observations are given in Nandra et al. (2004, in preparation).
Within the Chandra FoV there are 63 XMM sources, 55 of which were also detected by Chandra within of the XMM position. We performed a similar ID process to that employed above using these new positions, and succeeded in identifying 51 of the 55 Chandra sources. Two unidentified sources were also unidentified in the XMM analysis, and are essentially blank fields with no CFDF objects lying within of either the XMM or Chandra position (sources 14.54 & 73). Of these 51 sources, 42 had previously been identified by XMM. 40 were identified as the same object by both XMM and Chandra; the remaining 2 had different IDs (sources 14.10 & 149). However, in one of these 2 cases the Chandra ID was the second best XMM ID (14.149) (the XMM IDs are listed in tables 5 & 7). The other 9 sources were securely identified by Chandra but not by XMM, so these are considered ‘new’ IDs (sources 14.65, 80, 85, 90, 102, 114, 115, 122, 129)
Given the expected number of spurious XMM IDs for the whole 14-h field (106 identified sources) is we would expect 1-2 spurious IDs in the subsample covered by the Chandra FoV. We found 2 IDs that were wrong in this sample and so feel confident that our estimate of spurious XMM IDs in this field is accurate.
We relaxed the selection criteria for the XMM ID candidates to see if we could find more identifications for the XMM sources without significantly increasing the number of false associations. By increasing the cut-off to a further 5 XMM sources within the Chandra FoV are identified. Four of these are judged to be correct (14.85, 90, 102 & 114) given the Chandra ID and one is incorrect (14.115). Extrapolating to our entire survey, we estimate that by relaxing our criterion we gain 22 additional identifications, of which probably are inaccurate. For the rest of this work IDs with are considered secure.
To summarise: with this new threshold we identify 84 out of 115 sources in the 3-h field and 119 out of 149 sources in the 14-h field. One extra QSO lies outside the 3-h CFDF map but is coincident almost exactly with an XMM source and so is identified as such. An additional QSO lies on a chip boundary in the 3-h field and is assumed to be responsible for the X-ray emission detected to either side of the boundary (sources 3.7 and 19, see table 1 and the very top of figure 1(a), hereafter referred to as source 7), so in total 86 3-h sources are identified. In the 14-h field the Chandra positions succeeded in identifying an extra 4 sources (14.65, 80, 122 & 129), bringing the total number of identified sources in this field to 123. Out of the XMM sources within the area of the CFDF, we have identified of the sources in the 3-h field and of the sources in the 14-h field. Only a small part of the difference between the two fields are the Chandra positions that exist for some of the 14-h XMM sources. We expect of our 209 identifications, 10 are incorrect.
There are 4 new Chandra IDs and 3 IDs that were changed when Chandra positions were used rather than XMM positions (after increasing the limit to 0.15). These 7 sources, that were not possible to identify using XMM positional data but which were possible to identify using Chandra positions (sources 14.10, 65, 80, 115, 122, 129 & 149), give us an insight into the properties of the remaining 58 unidentified XMM sources. The X-ray fluxes of the unidentified XMM sources cover a large range of fluxes (see figure 3), but the median magnitude of the new IDs is 23.6, cf. the median magnitude for the other XMM IDs is 21.2 (range: 11.5 to 25.5), nearly 10 times brighter. This is a consequence of the effect described at the end of section 3.1. Section 5 describes the redshift information obtained for the IDs and it appears that these Chandra IDs lie, in general, at higher redshifts than most of the XMM IDs, which would partially explain their relative optical faintness.
4 X-ray to Optical Flux Ratios


A convenient way of discriminating between different classes of X-ray source is the ratio between their X-ray and optical flux. Figure 3 shows the total band magnitude (measured using a variable aperture to encompass the total flux of each object) versus the X-ray flux for all the identified sources in the 3 & 14-h fields. The X-ray flux is calculated assuming a photon index . The band magnitude is related to the flux in this band, , by , where has the units . Lines of constant X-ray to optical flux are plotted for comparison. AGN tend to occupy the space between the lines while quiescent galaxies mostly lie below the line, with a mixture in between.
Barger et al. (2002,2003) have plotted similar diagrams for the Chandra-Deep Field North survey, an X-ray sample approximately ten times fainter than our own. In the Chandra survey the median optical apparent magnitude of X-ray sources flattens off at low X-ray fluxes, bringing the majority of sources below the AGN region on the plot. However, at the flux limit of our survey we are still predominantly detecting AGN with only a minor contribution from quiescent galaxies. Additionally, the redshift distribution of our identified sources (see section 5) places the majority of the AGN in our survey at which is the period of peak formation of super-massive blackholes with low accretion rates (Cowie et al. 2003). These two facts mean that medium-deep surveys such as ours are well placed to study this important period of growth for intermediate luminosity AGN, without the need for very deep surveys, which are able to probe much earlier times in the evolution of AGN and study the X-ray properties of more ‘normal’ galaxies.
In figure 3, the extra sources identified by Chandra, but not by XMM, in the 14-hr field all reside in the higher regions. This suggests that they are AGN rather than starbursts or quiescent galaxies. Given that the XMM unidentified sources are in general optically fainter than the identified ones (, see section 3.2 and end of section 3.1), and that their X-ray fluxes are similar, this implies that the unidentified X-ray sources are most likely AGN too, with high ratios. One interesting point to note is that source 14.10 has a different Chandra ID to the one given by the XMM position; it is the Chandra ID that is plotted in these figures. However, the Chandra ID is significantly fainter than the XMM ID ( cf. 19.0) and so this source now has an extreme value of (cf. for the XMM ID). We assume in this paper that the Chandra ID is the correct one but given this extreme flux ratio it is possible that XMM has correctly identified this source, rather than Chandra.
In addition to the known QSOs in these fields, 27 of the identifications have stellar optical profiles. Figure 3 shows that most of these lie in the AGN part of the diagram, suggesting that they are QSOs rather than stars.
5 Photometric Redshifts
Only a handful of the CFDF IDs have spectroscopic redshifts. Including known QSOs outside the CFRS regions there are 13(6) X-ray sources with spectroscopic redshifts in the 3-h(14-h) fields. The vast majority of the non-broad-line AGN do not have spectroscopic redshifts and so we turn to photometric techniques to estimate redshifts for these.
The optical spectra of broad line AGN (QSOs) are contaminated by light from the central engine, and so obtaining photometric redshifts for them is problematic. However, Gonzalez & Maccarone (2002) have shown that for the majority of X-ray sources, which are non-broad line AGN, the optical spectrum is not significantly contaminated and so photometric techniques work just as well as they do with ‘normal’ galaxies. As long as the QSOs can be identified they shouldn’t affect the rest of the sample. We therefore only use the estimated redshifts for the identifications which do not have a stellar profile. We use two photometric redshift estimation codes in this work, a Bayesian template fitting code called BPZ (Benítez 2000) and a code developed specifically for the CFDF (Brodwin et al. 2003), calibrated against CFRS spectroscopic data. See the appendix for the details and a comparison of the two codes.
The photometry for all the IDs is listed in tables 6 & 7 and the results for both codes are shown in tables 3 & 5. Figure 4 shows the redshift distribution, as measured by each code, of all the reliable IDs that also have reliable redshift estimates, with a bin size of . Reliable photometric redshifts are defined here as unsaturated objects that have () redshift confidence limits (CFDF code) or (BPZ code), otherwise spectroscopic redshifts are used where they exist; in total 129(120) estimates are reliable for the BPZ(CFDF) code. Despite the differences between the distributions measured by the two different codes the overall shape of the distribution is clear, with a peak at around . In both distributions nearly of the objects lie in the range . The median redshifts are significantly different however: 0.62 for BPZ and 0.79 for the CFDF code. For the rest of this work the CFDF code is assumed to be more accurate (see appendix) and so all further quoted photometric redshifts are those given by this code.
An interesting point to note here is that the extra sources identified by Chandra and not by XMM (see end of table 5, sources 14.10, 65, 80, 115, 122, 129 & 149) lie, in general, at higher redshifts than the majority of the XMM identified sources. If all the unidentified sources lie at higher redshifts than all of the other sources, then the median redshift of the total increases to .

6 Absolute Magnitudes - Galaxy Types
Figure 5 shows the absolute magnitude plotted against redshift. The different symbols represent the best fitting template determined for each galaxy by the CFDF code, using six band photometry. Although the code uses 15 templates for greater accuracy each symbol here represents a small range of templates for clarity. In general the two photo-z codes agree reasonably well as to the best fitting galaxy type.
The X-ray sources all lie in a band defined at the faint limit by the limiting magnitude of the optical data, and at the bright limit by the saturation magnitude. Objects brighter than this magnitude do not have reliable photometric redshifts and so do not appear in this plot. Aside from these selection effects there are several other trends apparent here. Apart from QSOs, in general, at lower redshifts, the bluer galaxy types occupy the region near the faint limit while progressively redder galaxies occur at brighter magnitudes (see figure 6). However, this trend breaks down at higher redshift where there are fewer sources, and errors in the photometry are likely to be more important. There is no clear domination of one galaxy type over any other, indicating that AGN have no preference when it comes to the morphology of their host galaxies. Nor is there any apparent preference for optical luminosity of the host galaxy, unlike the narrow absolute magnitude range preferred by the starburst galaxies detected in radio surveys (Chapman et al. 2003). X-ray sources occupy the whole optical luminosity range available to them in this plot. There are four apparently very luminous ellipticals at (sources 3.32, 3.90, 3.92 & 14.31) which may be erroneous identifications. The CFDF code becomes less reliable above a redshift of 1.3 (Brodwin et al. 2003) and so it is possible that these sources actually lie at lower redshifts (in fact the BPZ code places three of these sources at , see tables 3 & 5, and classifies them as spirals; likely a consequence of this code using a magnitude based prior) and so are consequently of less extreme luminosity. With this in mind, high redshift sources should be viewed with some caution.
The extra sources identified by Chandra but not by XMM in the 14-hr field also cover a wide range in galaxy types. The two higher redshift sources are the bluest galaxy types while the two lowest redshift sources are the reddest types. Three of the four hug the lower luminosity limit, a consequence of their relative optical faintness.
Converting the X-ray flux of the identified sources into X-ray luminosity gives us figure 7. Although the striking correlation here is possibly dominated by the same selection effects seen in figure 5, it is rather reminiscent of the Magorrian relation (Magorrian et al. 1998), with black-hole mass represented by X-ray luminosity and bulge mass represented by optical luminosity. Whether this correlation is real or not depends on exactly where the optically faint and saturated sources lie in this plot. We would expect optically faint sources to fall in the lower right part of this plot and the saturated sources to fall in the upper left part, effectively smearing out the correlation. However, if the optically faint sources are not at much higher redshifts than the identified sources (contrary to our arguments above) then both their X-ray and optical luminosities will be low, placing them amongst the sources plotted here. The very luminous ellipticals, mentioned above, also appear in this plot, slightly above the general trend, again suggesting that they have been misclassified (as have, potentially, a group of lower luminosity ellipticals, also lying away from the trend).
Plotting these sources in a different way illustrates what type of objects contribute to the XRB. For this discussion we assume the XRB to have a spectrum of (McCammon & Sanders 1990; Fabian & Barcons 1992), although the overall normalisation is still somewhat uncertain. Figure 8 shows absolute magnitude vs. X-ray flux with the same symbols as in figure 5. The 300 sources in this survey (assuming the majority of the ‘stars’ are misidentified QSOs) contribute to the XRB in the range, while the 148 sources included in these figures (ie. the securely identified sources with redshift estimates) provide . Of this , sources brighter than contribute while fainter sources contribute . This calculation shows that the XRB is not dominated by the most optically luminous galaxies, but that a significant contribution comes from galaxies with fairly low optical luminosity.


7 Concluding Remarks
We have presented source catalogues for a survey, using the XMM-Newton X-ray telescope, of square degrees of sky. We show that reliable identifications can be obtained for of the XMM sources using XMM positions alone. Those sources that cannot be identified using XMM positions alone are optically fainter () than most of the identified ones, and are likely to be AGN at generally higher redshifts. We have obtained the following results:
-
•
The flux ratio of the sources in our survey show that they are predominantly AGN.
-
•
The optical properties of the AGN span a large range of absolute magnitudes, in contrast to the result found for the starburst galaxies detected in radio surveys, which tend to have a very narrow range of absolute magnitudes (Chapman et al. 2003).
-
•
AGN are found in host galaxies spanning the full range of Hubble types, with no clear preference.
-
•
For the identified X-ray sources with good redshifts there is a strong correlation between optical and X-ray luminosity, reminiscent of the Magorrian relation between black-hole mass and bulge mass. However, this may be due to selection effects.
-
•
The redshift distribution of the AGN shows a clear peak at .
The last result supports other recent studies (Barger et al. 2003) that show the peak formation of super-massive black holes occurred at relatively recent times (). Medium-deep X-ray surveys such as ours, which resolve a large fraction of the XRB but are still dominated by AGN, are able to probe this epoch effectively.
We will use the results from this paper to calculate the X-ray luminosity function, and determine its evolution with redshift, in the next paper in this series.
8 Catalogue
The following tables are a sample of the full catalogue, which can be found in the electronic version of this paper. It is split into 3 sections for each of the two fields in this survey. The first tables for each field (1 & 2) contain the positions and fluxes of the X-ray sources as measured by the source detection software. The second tables (3 & 5) have the identification information for all of the good ID candidates () including the CFDF catalogue number, the ID position, the distance between the ID and its corresponding X-ray source, value and redshift information. The final tables (6 & 7) show the photometry for each good ID. The X-ray sources are ordered by total number of counts detected in the full X-ray band, greatest first. Due to vignetting this order is approximately but not exactly the same as the flux order. Source 23 in the 14-h field is detected by SCUBA at m and is discussed in Paper-I in more detail.
All six tables can also be found in their entirety, in electronic text format, at the following address: http://www.astro.cardiff.ac.uk/pub/Timothy.Waskett/
| XMM | R.A.[fk5] | Dec.[fk5] | 111Flux in units of , based on a photon index of 1.7. | PN HRb | M1 HRb | M2 HR222Hardness ratio given by source detection procedure, one for each X-ray camera. Marked with ‘?’ if not detected or a bad measurement. | Notes333- = lies outside CFDF map; e = extended source (X-ray property); q = known QSO; s = object with a stellar profile, from list (q and s are optical properties). | ||
| 1 | 45.52820 | -0.02260 | 119.0 2.6 | 262.9 9.7 | 382.9 10.1 | -0.4 0.0 | -0.4 0.0 | -0.4 0.0 | - q |
| 2 | 45.78054 | 0.17228 | 33.0 1.2 | 48.6 3.8 | 81.7 4 | -0.6 0.0 | -0.5 0.1 | -0.5 0.1 | s |
| 3 | 45.64490 | 0.01902 | 23.3 1.0 | 44.3 3.2 | 67.7 3.4 | -0.5 0.0 | -0.5 0.1 | -0.4 0.1 | |
| 4 | 45.51813 | 0.27387 | 33.4 1.5 | 76.3 6.1 | 109.7 6.3 | -0.5 0.1 | -0.3 0.1 | -0.3 0.1 | - |
| 5 | 45.63815 | 0.22543 | 16.5 0.8 | 30.7 2.7 | 47.2 2.9 | -0.6 0.1 | -0.2 0.1 | -0.4 0.1 | q |
| 6 | 45.73817 | 0.26816 | 22.8 1.2 | 4.3 2.2 | 28.2 2.6 | -1.0 0.0 | -0.8 0.1 | -1.0 0.4 | |
| 7 | 45.70564 | 0.35812 | 37.1 2.3 | 85.8 10.1 | 126.3 10.3 | -0.4 0.1 | 1.0 109.0 | ? ? | q* |
| 8 | 45.58501 | 0.32717 | 20.6 1.2 | 31.4 4.2 | 53.6 4.4 | -0.5 0.1 | -0.6 0.1 | -0.6 0.1 | s |
| 9 | 45.65876 | 0.03438 | 7.0 0.5 | 23.0 2.3 | 30.5 2.4 | -0.1 0.1 | -0.3 0.1 | -0.3 0.1 | q |
| 10 | 45.59179 | 0.10849 | 6.4 0.5 | 19.1 2.0 | 26.1 2 | -0.2 0.1 | -0.5 0.1 | -0.1 0.1 | q |
| XMM | R.A.[fk5] | Dec.[fk5] | 444Flux in units of , based on a photon index of 1.7. | PN HRb | M1 HRb | M2 HR555Hardness ratio given by source detection procedure, one for each X-ray camera. Marked with ‘?’ if not detected or a bad measurement. | Notes666- = lies outside CFDF map; c = lies within Chandra map; d = detected by Chandra (c and d are X-ray properties); q = known QSO; s = object with a stellar profile, from list (q and s are optical properties). | ||
| 1 | 214.2072 | 52.42472 | 34.6 0.9 | 71.4 3.1 | 106.0 3.2 | -0.5 0.0 | -0.4 0.0 | -0.4 0.0 | c d |
| 2 | 214.4009 | 52.50781 | 42.2 1.2 | 73.4 4.0 | 115.9 4.1 | -0.5 0.0 | -0.5 0.0 | -0.5 0.0 | c d q |
| 3 | 214.1816 | 52.24290 | 49.9 1.5 | 94.2 5.3 | 144.3 5.5 | -0.5 0.0 | -0.4 0.1 | -0.4 0.1 | |
| 4 | 214.3536 | 52.50655 | 29.3 1.0 | 53.2 3.5 | 82.6 3.7 | -0.5 0.0 | -0.4 0.1 | -0.5 0.1 | c d q |
| 5 | 214.0966 | 52.32077 | 25.5 1.0 | 54.6 3.6 | 80.1 3.8 | -0.4 0.0 | -0.3 0.1 | -0.4 0.1 | |
| 6 | 214.4645 | 52.38579 | 19.3 0.8 | 33.7 2.7 | 53.1 2.8 | -0.5 0.0 | -0.4 0.1 | -0.5 0.1 | c d |
| 7 | 214.2442 | 52.20099 | 31.7 1.3 | 51.6 4.8 | 83.8 5.0 | -0.6 0.0 | -0.4 0.1 | -0.5 0.1 | |
| 8 | 214.2543 | 52.32128 | 16.7 0.7 | 13.8 1.7 | 30.6 1.8 | -0.8 0.0 | -0.6 0.1 | -0.7 0.1 | c d |
| 9 | 214.2152 | 52.34575 | 12.6 0.6 | 21.1 2.0 | 33.9 2.1 | -0.6 0.1 | -0.5 0.1 | -0.4 0.1 | c d |
| 10 | 214.6612 | 52.39937 | 33.3 1.5 | 36.8 5.0 | 70.4 5.2 | -0.7 0.1 | -0.6 0.1 | -0.6 0.1 | c d |
| XMM | CFDF | R.A.[fk5] | Dec.[fk5] | Offset(″) | Notes | |||||
|---|---|---|---|---|---|---|---|---|---|---|
| 1 | 45.52829 | -0.02246 | 0.641 | q | ||||||
| 2 | 48603 | 45.78065 | 0.17224 | 0.4 | 8.63E-04 | 0.01 | 2.01 | s | ||
| 3 | 80878 | 45.64505 | 0.01880 | 1.0 | 8.64E-03 | 0.40 | 0.45 | |||
| 5 | 36830 | 45.63823 | 0.22535 | 0.4 | 1.65E-03 | 1.048 | 0.30 | 0.20 | 2.22 | q |
| 6 | 27229 | 45.73788 | 0.26803 | 1.1 | 9.46E-05 | 0.36 | 3.09 * | |||
| 7 | 9684 | 45.70320 | 0.35877 | 0.107 | 0.08 | 0.38 | q | |||
| 8 | 15331 | 45.58520 | 0.32705 | 0.8 | 1.95E-03 | 0.04 | 0.51 | s | ||
| 9 | 78735 | 45.65896 | 0.03432 | 0.7 | 7.20E-04 | 1.350 | 0.19 | q | ||
| 10 | 63707 | 45.59203 | 0.10864 | 1.0 | 5.86E-03 | 3.300 | 0.27 | 0.02 | 3.27 | q |
| 3-h | 14-h | |
|---|---|---|
| 59 | 82 | |
| 16 | 24 | |
| 16 | 18 | |
| 13 | 16 | |
| 12 | 8 | |
| Blank Field | 2 | 1 |
| Outside CFDF | 28 | 5 |
| XMM | CFDF | R.A.[fk5] | Dec.[fk5] | Offset(″) | Notes | |||||
|---|---|---|---|---|---|---|---|---|---|---|
| 1 | 34649 | 214.2061 | 52.42517 | 0.7 | 5.05E-03 | 0.33 | 0.35 * | c d | ||
| 2 | 56149 | 214.3996 | 52.50816 | 0.1 | 8.83E-05 | 0.985 | 0.12 | 0.01 | 0.35 | c d q |
| 3 | 32209 | 214.1803 | 52.24317 | 0.4 | 9.65E-04 | 1.11 | ||||
| 4 | 50800 | 214.3523 | 52.50681 | 0.4 | 8.15E-04 | 0.479 | 0.01 | 0.01 | 1.16 | c d q |
| 5 | 22314 | 214.0946 | 52.32109 | 1.4 | 1.85E-02 | 0.79 | 0.91 | |||
| 6 | 62713 | 214.4630 | 52.38622 | 0.4 | 7.77E-04 | 0.35 | 0.35 | c d | ||
| 7 | 38711 | 214.2426 | 52.20126 | 0.6 | 1.81E-03 | 0.25 | ||||
| 8 | 39972 | 214.2527 | 52.32180 | 0.8 | 3.59E-03 | 0.60 | 0.74 | c d | ||
| 9 | 35492 | 214.2133 | 52.34607 | 1.1 | 8.10E-03 | 0.05 | 1.95 | c d | ||
| 10 | 83085 | 214.6597 | 52.39960 | 0.5 | 6.75E-04 | 0.01 | 1.87 | c d |
| XMM | CFDF | ITot | U | U | B | B | V | V | I | I | K | K |
|---|---|---|---|---|---|---|---|---|---|---|---|---|
| 2 | 48603 | 19.460 | 19.983 | 0.010 | 20.049 | 0.007 | 19.534 | 0.003 | 19.631 | 0.002 | ||
| 3 | 80878 | 20.675 | 21.677 | 0.017 | 21.995 | 0.009 | 21.185 | 0.008 | 20.895 | 0.005 | ||
| 5 | 36830 | 20.470 | 21.978 | 0.021 | 22.340 | 0.022 | 21.442 | 0.007 | 20.755 | 0.004 | 19.05 | 0.05 |
| 6 | 27229 | 14.156 | 19.903 | 0.008 | 18.154 | 0.002 | 16.867 | 0.001 | 15.310 | 0.000 | ||
| 7 | 9684 | 17.771 | 20.683 | 0.012 | 19.184 | 0.004 | 19.143 | 0.002 | 18.295 | 0.001 | ||
| 8 | 15331 | 19.071 | 20.343 | 0.010 | 19.986 | 0.007 | 19.575 | 0.003 | 19.217 | 0.002 | ||
| 9 | 78735 | 17.924 | 18.909 | 0.005 | 18.654 | 0.003 | 18.481 | 0.002 | 18.082 | 0.001 | ||
| 10 | 63707 | 19.996 | 24.437 | 0.071 | 21.355 | 0.006 | 20.537 | 0.005 | 20.243 | 0.003 | 19.93 | 0.11 |
| XMM | CFDF | ITot | U | U | B | B | V | V | I | I | K | K |
|---|---|---|---|---|---|---|---|---|---|---|---|---|
| 1 | 34649 | 20.604 | 22.083 | 0.027 | 21.833 | 0.008 | 20.906 | 0.005 | 20.887 | 0.004 | ||
| 2 | 56149 | 19.996 | 21.011 | 0.011 | 20.814 | 0.004 | 20.206 | 0.003 | 20.146 | 0.002 | 19.25 | 0.04 |
| 3 | 32209 | 19.955 | 21.499 | 0.016 | 21.650 | 0.012 | 21.687 | 0.009 | 20.375 | 0.003 | ||
| 4 | 50800 | 19.762 | 20.918 | 0.011 | 20.549 | 0.003 | 20.338 | 0.003 | 19.932 | 0.002 | 18.62 | 0.02 |
| 5 | 22314 | 20.940 | 23.925 | 0.052 | 23.580 | 0.023 | 22.796 | 0.014 | 21.181 | 0.005 | ||
| 6 | 62713 | 19.365 | 22.842 | 0.031 | 21.814 | 0.007 | 20.807 | 0.004 | 19.632 | 0.002 | ||
| 7 | 38711 | 19.756 | 20.889 | 0.012 | 20.609 | 0.007 | 20.529 | 0.005 | 19.986 | 0.003 | ||
| 8 | 39972 | 19.882 | 21.883 | 0.019 | 21.622 | 0.009 | 21.131 | 0.006 | 20.266 | 0.003 | ||
| 9 | 35492 | 20.252 | 21.836 | 0.019 | 21.512 | 0.008 | 21.141 | 0.006 | 20.690 | 0.004 | ||
| 10 | 83085 | 19.029 | 19.341 | 0.006 | 19.402 | 0.003 | 19.050 | 0.002 | 19.163 | 0.002 |
acknowledgements
TJW acknowledges the support of a departmental postgraduate grant. SAE thanks the Leverhume Trust for a research fellowship. We thank the referee for being so thorough, which greatly clarify the paper and also helped us to better organise our thoughts for further work. This paper was based on observations obtained with XMM-Newton, an ESA science mission with instruments and contributions directly funded by ESA Member States and NASA.
References
- [1] Alexander D. M., Brandt W. N., Hornschemeier A. E., Garmire G. P., Schneider D. P., Bauer F. E., Griffiths R. E., 2001, AJ, 124, 1839
- [2] Alexander D. M. et al., 2003, AJ, 125, 383
- [3] Almaini O., Lawrence A., Boyle B. J., 1999, MNRAS, 305, L59
- [4] Baldi A., Molendi S., Comastri A., Fiore F., Matt G., Vignali C., 2002, ApJ, 564, 190
- [5] Barcons X. et al., 2002, A&A, 382, 522
- [6] Barger A. J., Cowie L. L., Brandt W. N., Capak P., Garmire G. P., Hornschemeier A. E., Steffen A. T., Wehner E. H., 2002, AJ, 124, 1839
- [7] Barger et al., 2003, AJ, 126, 632
- [8] Benítez N., 2000, ApJ, 536, 571
- [9] Brodwin et al. 2003, ApJ, submitted (astro-ph/0310038)
- [10] Chapman S. C. et al., 2003, ApJ, 585, 57
- [11] Coleman G. D., Wu C-C., Weedman D. W., 1980, ApJS, 43, 393
- [12] Cowie L. L., Barger A. J., Bautz M. W., Brandt W. N., Garmire G. P., 2003, ApJ, 584, L57
- [13] Csabai I., et al., 2003, AJ, 125, 580
- [14] Downes A. J. B., Peacock J. A., Savage A., Carrie D. R., 1986, MNRAS, 218, 31
- [15] Fabian A. C., Barcons X., 1992, ARA&A, 30, 429
- [16] Fontana A., D’Odorico S., Poli F., Giallongo E., Arnouts S., Cristiani S., Moorwood A., Saracco P., 2000, AJ, 120, 2206
- [17] Freeman P. E., Kashyap V., Rosner R., Lamb D. Q., 2002, ApJS, 138, 185
- [18] Gandhi P., Crawford C. S., Fabian A. C., Johnstone R. M., 2003, MNRAS in press (astro-ph/0310772)
- [19] Giacconi R. et al., 2002, ApJS, 139, 369
- [20] Gilli R., Salvati M., Hasinger G., 2001, A&A, 366, 407
- [21] Gonzalez A. H., Maccarone T. J., 2002, ApJ, 581, 155
- [22] Hammer F., Crampton D., Le Fèvre O., Lilly S. J., 1995, ApJ, 455, 88
- [23] Hasinger G., Burg R., Giacconi R., Schmidt M., Trümper J., Zamorani G., 1998, A&A, 329, 482
- [24] Hasinger G. et al., 2001, A&A, 365, L45
- [25] Hornschemeier A. E., Bauer F. E., Alexander D. M., Brandt W. N., Sargent W. L., Vignali C., Garmire G. P., Schneider D. P., 2003, AN, 324, 12
- [26] Kashikawa N. et al., 2003, AJ, 125, 53
- [27] Kinney A. L., Calzetti D., Bohlin R. C., McQuade K., Storchi-Bergmann T., Schmitt H. R., 1996, ApJ, 467, 38
- [28] Lilly S. J., Le Fèvre O., Crampton D., Hammer F., Tresse L., 1995a, ApJ, 455, 50
- [29] Lilly S. J., Hammer F., Le Fèvre O., Crampton D., 1995b, ApJ, 455, 75
- [30] Magorrian et al., 1998, AJ, 155, 2285
- [31] Mainieri V., Bergeron J., Hasinger G., Lehmann I., Rosati P., Schmidt M., Szokoly G., Della Ceca R., 2002, A&A, 393, 425
- [32] McCammon D., Sanders W. T., 1990, ARA&A, 28, 657
- [33] McCracken H. J., Le Fèvre O., Brodwin M., Foucaud S., Lilly S. J., Crampton D., Mellier Y., 2001, A&A, 376, 756
- [34] McHardy I. M. et al., 1998, MNRAS, 295, 641
- [35] McHardy I. M. et al., 2003, MNRAS, 342, 802
- [36] Miyaji T., Griffiths R. E., 2001, Recent results of XMM-Newton and Chandra, XXXVIth Rencontres de Moriond, XXIst Moriond Astrophysics Meeting, eds D.M. Neumann & J.T.T. Van, 65M
- [37] Moretti A., Campana S., Lazzati D., Tagliaferri G., 2003, ApJ, 588, 696
- [38] Nandra et al., 2004, in preparation
- [39] Page M. J. et al., 2003, AN, 324, 101
- [40] Severgnini P. et al., 2000, A&A, 360, 457
- [41] Steffen A. T., Barger A. J., Cowie L. L., Mushotzky R. F., Yang Y., 2003, ApJ, 596, L23
- [42] Ueda Y., Akiyama M., Ohta K., Miyaji T., 2003, ApJ, 598, 886
- [43] Waskett et al., 2003, MNRAS, 341, 1217
Appendix
The work in this paper depends heavily on the reliability of the photometric redshift estimation codes we use. There are two codes whose results are presented in this work, one by Benítez (2000) which uses a Bayesian approach and template fitting technique, called BPZ; and another that is developed by one of us specifically for the CFDF (Brodwin et al. 2003) utilising the CFRS (Hammer et al. 1995; Lilly et al. 1995b) to calibrate the template fitting. These two codes are slightly different and each have their strengths. This appendix is concerned with the reliability testing of these two codes. For a more detailed discussion of the CFDF code, and its reliability when compared against the CFRS spectroscopic sample, refer to Brodwin et al. (2003).
For reasons of timing the input to BPZ is from an older version of the CFDF catalogues than that employed for the specific CFDF code. Therefore this should be taken into account when comparing the two codes.
BPZ Photometric Redshift Estimation Code


This code has been tested by Gonzalez & Maccarone (2002) and Benítez (2000) and has proven to be highly successful, but we use a different filter set and photometry from these studies and so it was prudent to re-test the code for our specific needs.
Figure 9 shows comparison of the BPZ photometric redshift estimates with spectroscopic measurements from the CFRS catalogue, for those sources covered by both surveys. Photometric estimates with low reliability (quantified by an in-code statistic, ) are removed from these plots leaving the most reliable estimates. We achieve reasonably good results both with and without the inclusion of band photometry from the CFRS (only about half the objects here have data), although the 14-h field suffers from a slight systematic underestimation, which can be seen in the figures. All BPZ redshifts have been corrected for this effect in the main body of this paper. In general the scatter of the photometric redshifts is of the order of (see figure 9 for details).
Equivalent plots for the CFDF code can be found in Brodwin et al. (2003) (their figure 2). In comparison to BPZ the CFDF code redshifts fair rather better when compared to the CFRS spectroscopic sample, with fewer outliers and a smaller scatter ( to , to ). There are also no systematic effects, as seen in the BPZ 14-h sample.
CFDF Photometric Redshift Estimation Code


The CFDF is currently extending beyond the original survey to include additional and photometry. These extra filters remove some potential redshift degeneracies in certain galaxy templates and so should provide more reliable photometric redshift estimates. The CFDF photometric redshift program is now underway with the full photometry using a code developed by Mark Brodwin (Brodwin et al. 2003, which includes a thorough analysis of its reliability). As an additional check on the original estimates we made with BPZ we obtained photometric redshifts for our identified X-ray sources from the CFDF photometric redshift program utilising these new catalogues.
Figure 10 shows the comparison between the redshift estimates made by the two codes for only those objects which had reliable estimates as judged by both of the in-code measures. Star like objects, known QSOs and saturated objects () (see catalogue tables) are excluded because photometric redshifts are unreliable for these objects. In general the agreement is good, with of objects agreeing to within a factor of 1.7. The agreement is also better for , where the majority of objects lie (72/94 CFDF; 77/94 BPZ) and where the peak in the number density of intermediate luminosity AGN is (Cowie et al. 2003). Assuming the CFDF redshifts are correct 7/72 objects are given poor redshifts by BPZ; whereas assuming the BPZ redshifts are correct 13/77 objects are given poor redshifts by the CFDF code.
For the actual X-ray sources considered in this work only a handful have spectroscopically measured redshifts, with half of these being previously known QSOs. Figure 11 shows the results of the photometric redshift codes for all these objects. There is a clear problem in obtaining photometric redshifts for QSOs, both codes struggling to pin them down with any accuracy. However, for more optically normal AGN both BPZ and the CFDF code cope quite well for the most part. The confidence limits are slightly better for the CFDF code however, and it also wins out over BPZ with fewer unreliable redshifts in our X-ray sample. Interestingly enough the inclusion of band data to the BPZ code does not improve the estimates, as we see in our tests of BPZ on the CFRS sources (above). Although the sample here is small it actually appears to have an adverse effect on the redshift estimations (figure 11(b)) rather than improving them as expected.
The CFDF code, being specifically designed for the objects used as IDs in this survey, seems the logical choice for obtaining redshifts for the X-ray sources. This is especially true given that it also takes full advantage of the more recent extension in the number of filters for the CFDF. This code does allow for the use of a Bayesian prior, like BPZ, although none was used in obtaining these particular results (instead the data itself is used to derive a prior for statistical analysis of the full sample). This may be seen as a slight disadvantage, since priors have been shown to be effective in reducing the number of catastrophic errors for individual galaxies (Benítez 2000). However, the extra photometry used in the CFDF code should compensate for this to some degree, and our tests and those in Brodwin et al. (2003) show the CFDF code to be superior to BPZ in this situation.