Internal shocks and the blazar sequence
We consider internal shocks as the main dissipation mechanism responsible for the emission in blazars and show that it can satisfactorily account for the properties of all blazars. In particular, we extend previous work (Spada et al. 2001) on powerful objects, to intermediate (BL Lac) and low power sources (Mkn 421), in order to reproduce the whole of the blazar sequence. The model self-consistently treats the dynamics, spectral emission and its variability. The key parameters driving the phenomenological sequence are the jet power and the properties of the broad line region, which regulate the cooling efficiency of the emitting particles and thus the shape of the spectral energy distribution. By assuming that the remaining parameters are similar for all objects it has been possible to reproduce the full range of the observed spectral “states”. A more detailed comparison of the variability properties shows (for Mkn 421) a good agreement in the X–ray band, while in the optical the simulated flux appears to be too variable. For BL Lac lags ( 10 days) are predicted between the –rays and the infrared emission.
Key Words.:
Galaxies: jets — Galaxies: nuclei — Radio continuum: galaxies – Objects: Mkn 421, BL Lac.1 Introduction
The discovery that blazars are strong –ray emitters together with the results of multiwavelength campaigns have allowed to deepen our knowledge on these objects. Their Spectral Energy Distribution (SED) is characterized by two broad peaks (Fossati et al. 1998) strongly variable on different timescales (Wagner & Witzel 1995; Ulrich, Maraschi & Urry 1997).
Two main radiation processes dominate the emission, namely synchrotron at low frequencies and – plausibly – inverse Compton at high energies (see e.g. Sikora 1994 for a review). The relative luminosity in the two peaks and their peak frequency appear to be functions of the total power (Fossati et al 1998, Ghisellini et al. 1998), resulting into a sequence for the whole of the blazar population properties, ranging from powerful, low frequency peak, through intermediate, to low power, high frequency peak (blue) blazars (see however Padovani et al. 2003). The blazar emission is variable on energy dependent timescales, typically of weeks–months in the radio and of the order of a day in the –ray band.
Several studies, mainly based on the modeling of the SED, consistently derived the physical parameters of the emitting region. However key issues in the understanding of relativistic jets remain open, most notably the jet energetics and the particle acceleration process(es). In order to explore these issues and their relationship we have (quantitatively) considered a scenario in which the plasma conditions and their variability are not treated as free parameters, but follow from the jet dynamics, thus relating the observed emission properties with the energy transport along the jet. Such a scenario assumes that internal shocks are responsible for the dissipation within jets (Rees 1978 and then mostly explored for Gamma–Ray Bursts, Rees & Mészáros 1994).
The key assumption of the model is that the energy is channeled into jets in an intermittent way by the central engine, though such a time dependent process cannot be inferred from first principles. Different parts of the jet (‘shells’) moving at different speeds can collide giving rise to shocks and dissipation as non–thermal radiation. The mechanism has a limited efficiency (unless the contrast in Lorentz factors between different shells is extremely large, see Beloborodov 2000; Guetta, Spada & Waxman 2001, but also Ghisellini 2002), which has to be indeed the case for blazars since most of the energy propagates up to the extended radio lobes.
Beside the low efficiency, the internal shock scenario can naturally account for other blazar properties. It predicts that jets become radiative at cm from the central engine, implying a minimum distance from the accretion disk and a minimum dimension for the –ray source, as required by observations (in order to avoid copious pair production; see Ghisellini & Madau 1996). Furthermore, successive collisions taking place at larger distances have reduced efficiency – since the Lorentz factor contrast of the colliding shells decreases – explaining why the jet luminosity decreases with distance. Finally, the internal shock scenario appears a promising non steady state model to account for the observed large amplitude variability.
A detail study of the predictions of this model via numerical simulations has been carried out by Spada et al. (2001; hereafter S01) for powerful blazars (specifically 3C 279). As the SED of this object does not represent the whole of the blazar family mentioned above, we focus here on two well studied sources representative of extremely blue and intermediate blazars, namely Mkn 421 and BL Lac itself. Rather than reproducing in detail particular spectra of specific objects, the aim of this work is to determine whether the proposed scenario, including the dynamics and emission properties, i) can account for the different SED along the blazar sequence, ii) under which hypothesis this can occur and iii) whether the internal shock model can reproduce the observed variability behavior.
The outline of the paper is the following. In §2 we describe the hypothesis on the wind dynamics and on the radiative properties of the shocked plasma. The results – specifically referring to the sources Mkn421 and BL Lac – are presented in §3. In §4 we draw our conclusions.
2 Internal shocks and radiated spectra
2.1 Physical scenario and dynamics
In this work we use the approximate model of an unsteady wind described in detail in S01 and in the following we report only its most relevant assumptions.
We consider a compact source, of typical dimension cm, which produces an unstable relativistic wind characterized by an average luminosity . The emission from the wind is obtained by adding pulses radiated in a series of internal shocks that occur in the outflow (Daigne & Mochkovitch 1998; Spada, Panaitescu & Mészáros 2000; Guetta, Spada & Waxman 2001).
The wind flow is described as a sequence of shells, where is the overall duration of the wind emission and is the average interval between two consecutive shells. Each shell is characterized by four parameters:
-
1.
the ejection time , where the subscript j denotes the shell,
-
2.
the Lorentz factor ,
-
3.
the mass ,
-
4.
the width as measured in the lab frame.
The Lorentz factors of the shells are randomly extracted from a uniform distribution between and . The masses are also randomly extracted from a uniform distribution with an average value , where the total mass in the wind is normalized to the jet energy budget. The time intervals are drawn randomly from a uniform distribution with an average value . The initial shell width is of the same order of and the initial internal energy is negligible (all of the energy is in the form of bulk kinetic energy).
The dynamics of the wind expansion is characterized by a series of two–shell collisions in which the faster shells catch up with the slower ones. The model computes the collision time of two shells and replaces them with a new shell having mass, Lorentz factor, and internal energy given by the conservation laws for inelastic collisions (for details see S01). Before colliding, the shells are assumed cold with constant thickness but after collision they get heated and thus assumed to expand at the (comoving) sound velocity. Adiabatic losses during the expansion are taken into account but the bulk Lorentz factor is kept constant since the internal energy is always much smaller than the bulk kinetic one. The magnetic field is generated at each collision without keeping memory of any field generated in previous collisions.
In each collision a forward (FS) and a reverse (RS) shock are formed and propagate into the front and the back shell, respectively. The plasma parameters behind each shock are determined by the jump conditions in mildly relativistic shocks, namely continuity in the energy density and velocity across the contact discontinuity separating the two shells (Panaitescu & Mészáros 1999). We also take into account the compression of the merged shell width due to the propagation of the FS and RS.
The energy released in each shock is assumed to be distributed among protons, electrons and magnetic field with fractions , and , respectively. The resulting magnetic field strength allows us to evaluate the synchrotron and the inverse Compton emission.
Electrons are assumed to be accelerated at relativistic energies with a power law spectrum, , above a (random) Lorentz factor . is determined by requiring that equals the fraction of the total available internal energy and accounting for the fact that only a fraction, , of electrons is effectively accelerated. We assume that below electrons are accelerated with smaller efficiency, corresponding to a flatter energy distribution (with respect to the slope above ), assumed to be .
In conclusion, by considering the wind dynamics and shock hydrodynamics, the energy density in non–thermal electrons and in magnetic field and the typical random Lorentz factor can be determined for each collision.
2.2 Local spectra
We followed the same basic assumptions of S01, which we briefly recall:
-
•
The emitting zone is homogeneous with comoving volume , where is the half–opening angle of a conical jet and is the comoving thickness of the shell at the collision time, whose expansion while emitting is neglected for simplicity.
-
•
The relativistic particles, embedded in a tangled magnetic field, have the same energy distribution throughout the region corresponding to the shell–shell interaction. This simplification is justified as we are interested in the “average” spectrum, but does not account for spectral details occurring on a timescale shorter than the light crossing time.
-
•
Even in the case of low power BL Lacs, we consider the presence of soft photons external to the jet (identified with the emission from the broad line region, BLR). The external photon luminosity is produced within and abruptly vanishes beyond, and corresponds to a comoving radiation energy density (e.g. Ghisellini & Madau 1996).
High and low power blazars have different line/photoionizing disk luminosities. Following Kaspi et al. (2000), and are related by with . Thus blazars with weaker broad emission lines should have smaller BLR, implying that the first collisions occur preferentially outside .
-
•
Relativistic electrons are injected with a broken power–law energy distribution, below and between and , with a power . The equilibrium particle distribution , resulting from the continuous injection and cooling processes, is determined through the following procedure.
Above the (comoving) random Lorentz factor , corresponding to a cooling time comparable with the shock crossing time , the distribution is assumed to have a power law index . Below there are two different behaviors:
i) if , we assume between and , and for ;
ii) if , between and , and for .
-
•
The normalization of is determined according to whether particles with can or cannot cool in the timescale (fast and slow cooling regime, respectively):
Fast cooling regime — If most of is radiated in a timescale (i.e. ) we apply a luminosity balance condition:
(1) where is the radiative cooling rate, including synchrotron, synchrotron self–Compton (SSC) and external Compton (EC) losses. In order to allow for multiple Compton scatterings we a priori calculate how many scattering orders can take place before the Klein–Nishina regime is reached. By considering as the relevant energy
(2) where and is the (non–relativistic) Larmor frequency. We define and introduce the Comptonization parameter :
(3) The equality between the injected and the radiated power in the fast cooling regime translates into an equality between the electron and the radiation energy densities, where the latter comprises the synchrotron and the inverse Compton orders energy density, i.e.
(4) This provides the normalization of , assuming the above slopes.
Slow cooling regime — If most of the power is not radiated in , the electrons retain their energy and
(5) Assuming the same distribution for , its normalization can be determined.
-
•
The slopes of the distribution are fixed, but the cooling energy is found by iteration as depends on the amount of SSC radiation, which in turn depends on the exact shape of (because of Klein–Nishina effects). Since determines the normalization of , we re–iterate the procedure described above until it converges (usually 3–4 iterations are enough).
-
•
The synchrotron–self–absorption process, the inverse Compton emission and the beaming of the radiation are treated as in S01.
2.3 Observed spectrum
Both the particle and radiation local spectra thus determined are not steady, but roughly correspond to those attained after a time after the shell–shell interaction, at the maximum bolometric radiative output. This spectrum – adopted for the entire duration of the emission – has a normalization modulated as a function of time.
Each photon pulse – with its corresponding spectrum – starts at the time of a collision and lasts for a duration set by the combination of the radiative, shock crossing and angular spread timescales. The shape of the pulses (raise and decay in the light curves) is assumed symmetric and linear with time if its duration is determined by geometrical effects and/or by the shock crossing time, as generally occurs for collisions inside the BLR (as typical of powerful blazar like 3C279). If the pulse duration is instead set by cooling, the pulse still rises linearly, but decays exponentially [], implying that the rise and decay times can be different. This usually occurs in weaker blazars, like Mkn 421. The pulses of intermediate BL Lac objects can be characterized by either of these pulse shapes, depending on the broad lines intensity and thus on whether collisions take place within .
The observed spectrum is determined by all of the photons reaching the observer simultaneously: since these are produced at different distances, their different light propagations times should be taken into account. In other words, the resulting spectrum is obtained as the convolution of the emission produced by shocks simultaneously active in the observer frame, taking into account the radius at which collisions occur and the photon travel path.
3 Results
The main aim of this work is to explore whether the internal shock scenario can account for the difference of the SED along the blazar sequence. We thus a) concentrate on the global properties, rather than to explain details of the spectrum of a specific object; b) apply the model to Mkn 421 and BL Lac itself which, besides being among the best studied BL Lac objects, are representative of extremely blue and intermediate blazars, respectively, complementing the study already performed for the powerful blazar 3C 279 (S01).
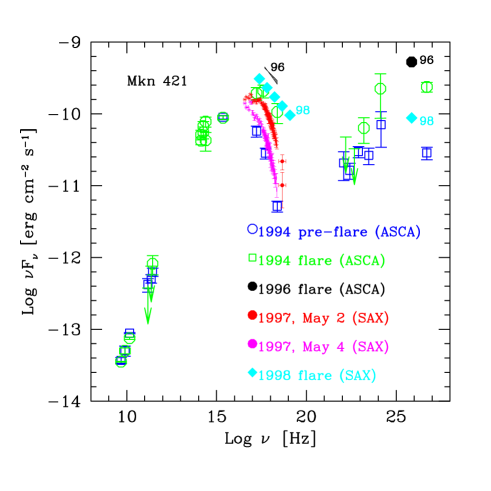
Mkn 421 — This is one example of bright, extremely blue and strong TeV emitting blazar. The peaks of its synchrotron and inverse Compton spectra are at keV and a few hundreds GeV energies, respectively. The bolometric (observed) power is of order erg s-1. The SED of coordinated simultaneous observational campaigns of Mkn 421 are reported in Fig. 1 (Costamante & Ghisellini 2002).
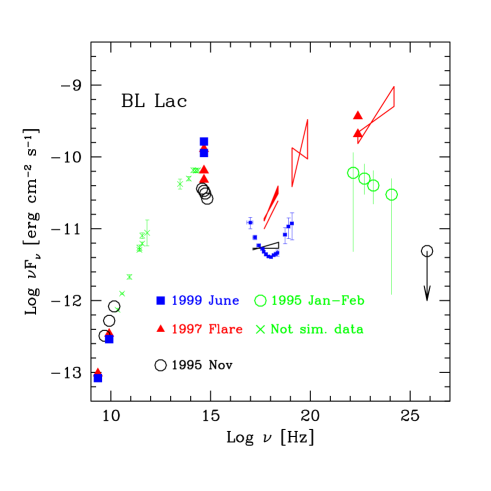
BL Lac — The prototype of the BL Lacertae class is an intermediate blazars (e.g. Fossati et al. 1998). It is a 1 Jy source, with broad band peaks in the near IR and MeV–GeV band and its total bolometric power is of order erg s-1. Despite of BL Lac being the prototype of the BL Lac class, it sporadically showed optical emission lines (with maximum observed EW Å; Vermeulen et al. 1995; Corbett et al. 2000). In July 1997 it underwent a major outburst, followed in the optical and by the CGRO (EGRET), RossiXTE and ASCA satellites. During this flare the entire SED dramatically changed, as illustrated in Fig. 2, with EGRET detecting a flux (100 MeV) a factor 3.5 times higher than that observed in 1995 (Bloom et al. 1997).
In order to reproduce the SED and variability of these two sources, we took as an initial set of physical parameters that determined for 3C 279 (see S01), and changed as few as possible of them to account for the different broad band SED and ’spectral states’ of these sources.
It turned out that the global properties of the blazar “sequence” can be reproduced by only changing two key quantities, namely the jet luminosity and the luminosity and extension of the external photon field. The other parameters [, , the slope of the (high energy) electron distribution, the observing angle ] are only constrained to fit the specific SED. The remaining quantities are at most slightly varied just to optimize the fit. In particular has been fixed for all sources to 0.5. In Table 1 we list all of the input parameters adopted to reproduce the time dependent behavior of the simulated sources (for convenience of the reader we also report the same parameters for 3C 279 from S01).
Let us now examine the physical quantities inferred from the modelling and their dependence on .
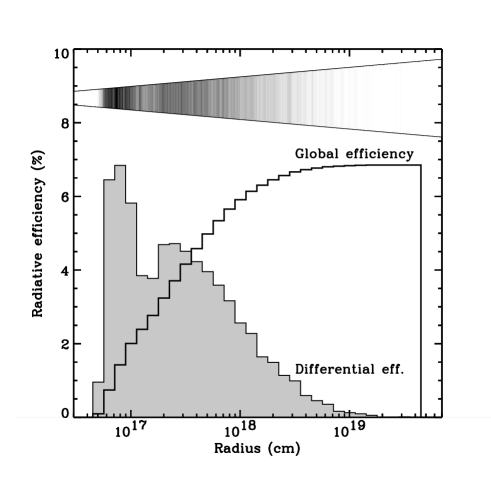
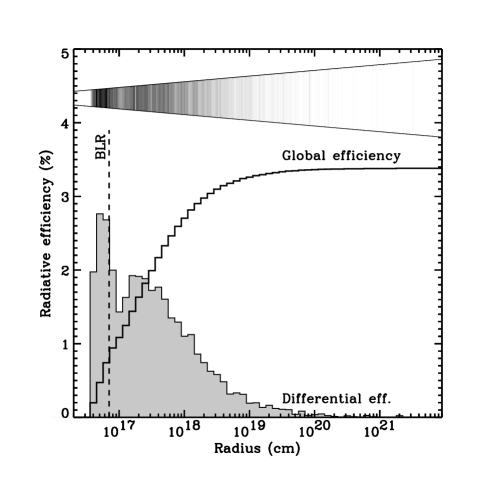
Efficiency — The radiative efficiency represents the fraction of the dissipated energy at each location channeled into relativistic electrons. In absence of non–radiative losses this energy should be all radiated. As shown in Fig. 3 and 4 for Mkn 421 and BL Lac, respectively, the efficiency decreases simply due to the decrease in the contrast of bulk Lorentz factors of colliding shells. The apparent different efficiencies of BL Lac and Mkn 421 reflect only the different viewing angle (chosen to reproduce the detailed properties of the two sources).
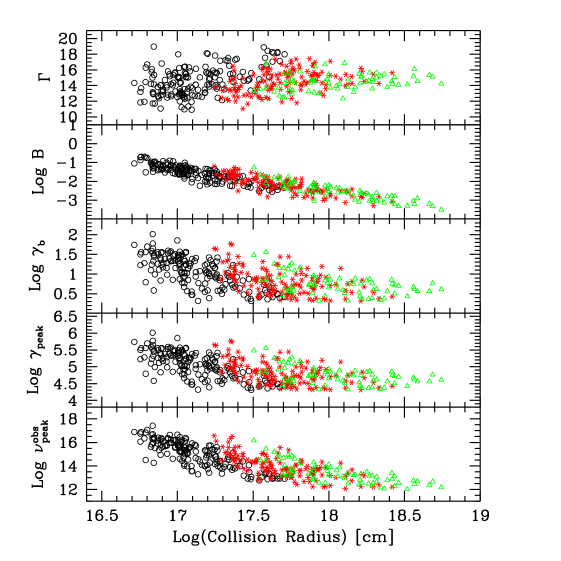
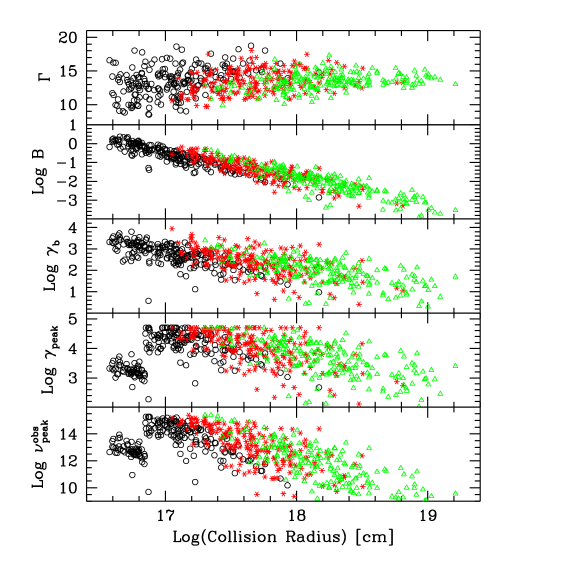
Parameters profiles: , , — Fig. 5 and Fig. 6 (top three panels) show how the bulk Lorentz factor, the magnetic field, the Lorentz factor of the injected electrons evolve with distance from the nucleus, for Mkn 421 and BL Lac, respectively. Different symbols correspond to shells having experienced a different number of collisions. The bulk Lorentz factors tend toward average values as result of successive collisions and merging of the shells. The range and the asymptotic bulk Lorentz factor are fully consistent with the typical values inferred from observations. The magnetic field decreases roughly as for both sources: it is worth remarking that we assume that a constant fraction () of the available energy is converted into magnetic field and no field component survives between successive collisions. The minimum energy of the injected electrons, , is also a decreasing function of , due to the decrease in the bulk Lorentz factors contrast, implying decreasing efficiency and mean energy per particle.
In general the only difference between Mkn 421 and BL Lac is the smaller spread of the parameters for the former, due to the fact that in Mkn421 all the collisions occur in the same region.
Parameters profiles: , — The two bottom panels of Figs. 5, 6 show the spatial profile of the energy of the electrons emitting at the peak of the SED, , and the corresponding observed synchrotron peak frequency, .
A significantly different behavior characterizes the two sources. In Mkn 421 is a continuous decreasing function of and attains large values. This follows from the fact that in low power blazars only high energy electrons can radiatively cool in a finite injection time, thus determining high values of . Specifically, its value is determined by at each collision radius, as set by the spectral fit. The behavior of simply follows that of and . On the contrary for BL Lac (and consequently ) shows a discontinuity. This occurs at : inside the BLR electrons are in the fast cooling regime and thus while outside the BLR the behavior is similar to that of Mkn 421, namely the radiative cooling time exceeds the shock crossing time, implying . Note that for 3C 279 the BLR is even larger and for almost all of the collisions.
Spectra at various — In order to understand how and where the overall spectrum is generated, the spectra produced at different radii are shown in Fig. 7 and Fig. 8: in the top panel the average “instantaneous” spectrum of a single shell at is shown while in the bottom panel the spectra are integrated for all of the shells emitting at a certain time (the flux is thus weighted for the duration of the emission in each shell at a given frequency). While the single shell emission is qualitatively similar for the two sources, the integrated spectra of BL Lac do not simply reproduce the single shell behavior. This is due to the different (shorter) duration of each single shell emission, due to the fast cooling of the electrons (caused by the external Compton). The end result is that in Mkn 421 most of the emission is produced in the inner jet, while in BL Lac the inner part only dominates at the highest frequencies of the two spectral peaks, with interesting consequences on the correlations between variability in different bands.
It is also worth commenting on the extreme differences in the SED of BL Lac at different epochs (as shown in Fig. 2). This has been already interpreted as due to variable broad emission lines in the spectrum (mainly and ), which would cause a variable contribution of seed photons for the external Compton process. The maximum observed total luminosity from the BLR is 5–8 erg s-1 (see e.g. Vermulen et al., for km s-1 Mpc-1). If one adopts the correlation (Kaspi et al. 2000) between and the ionizing continuum luminosity (here assumed to be 10 times ), 5–7 cm. This inferred distance is indeed similar to the typical distance of the first shell–shell collisions, suggesting that the collisions sometimes occurs within , sometimes outside it (see also Ravasio et al. 2002, 2003). Dramatic spectral changes, such as those between the 1995 and the 1997 SED (see Fig. 2) can be therefore accounted for in this scenario.


Light curves — The simulations performed aimed at reproducing (and successfully did) all of the flux range of the SED observed in the various multiwavelength campaigns. However the model also predicts the detailed variability behavior at all frequencies (see also Tanihata et al. 2003) which has not been considered a priori to constrain the model. Let us then examine the light curves in different bands, reported in Fig. 9 and Fig. 10 for the two sources, and simply compare their variability properties with observations. A movie showing the spectral variability during the whole simulation for Mkn 421 (and 3C 279) can be found at the URL http://ares.merate.mi.astro.it/gabriele/421/index.html. The long term ’periodicity’ that appears in the light curves is due to the sinusoidal modulation chosen for the mass distributions of the shells.
In order to assess the potential of the model to reproduce the data, we focused on comparing the simulated light curves with the observed ones, by calculating basic indicators, namely the r.m.s., the cumulative distribution of the variance [(Flux – Flux ], and the minimum variability doubling timescales, defined as Flux Flux). In particular we focused on the X–ray and optical bands for Mkn 421. For the optical variability we sampled the simulated curves with a frequency of about once a day for all the 300 days covered by the simulation and compared the results with the photometric light curves in the band presented by Tosti et al. (1998). For the X–rays, we considered the results presented by Tanihata et al. (2001) on 6 day continuous observations of the source with ASCA and binned the observed 0.2–2 keV light curve over the same time bins (0.125 days) of the simulations.
In the optical band the simulated light curves show significantly larger variability than the observed one (as from Tosti et al. 1998): the r.m.s. from the observations is about 4 times smaller than that derived from the model, and the Kolmogorov–Smirnoff test (KS) on the variance distributions rejects the null hypothesis. On the contrary, the comparison reveals promising results for the variability in the X–ray band. Here, the observed and simulated r.m.s. are comparable (0.2 vs 0.3) and the KS test shows that the variance distributions are marginally compatible (5 per cent level). The X–ray variability properties of the simulated and observed light curves appear to be similar also in terms of the variability timescale, which is of the order of 0.3–0.4 day.
While a proper comparison of the variability properties would require a more sophisticated analysis and better sampled data, these tentative results show that the variability in the X–rays is reasonably reproduced by the model. A significant discrepancy appears instead in the optical, where the model predicts larger variability: this could be in principle improved by modifying the model parameters (e.g. reducing the Lorentz factor contrast and modifying its distribution), although beyond the aim of this paper. We however notice that in the case of Mkn 421 the possible role of the host galaxy emission in reducing the optical variability amplitude should be assessed.
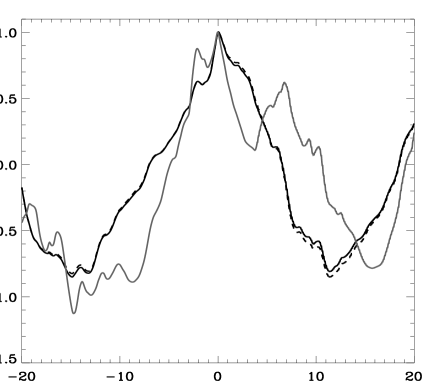
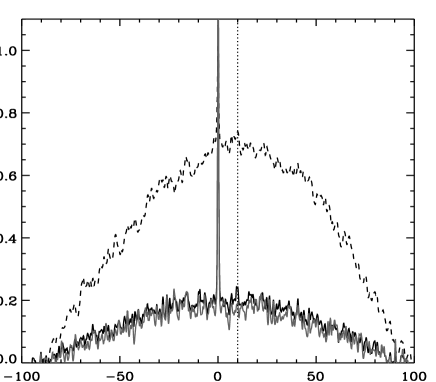
Finally, we computed the cross–correlations between the variability in different energy bands. The results are presented in Fig. 11 and 12 for Mkn 421 and BL Lac, respectively. As discussed above for Mkn 421 is determined, at all radii, by , accounting for the absence of lags between the different frequencies (Fig. 11). On the contrary, in BL Lac lags ( 10 days) are present between the infrared and the –ray band. In fact, in this source the –ray emission is dominated by the external Compton within , while the infrared one by synchrotron radiation from collisions occurring outside the broad line region. We remind that in the case of 3C 279 (S01) the infrared emission is also determined by collisions outside , resulting in lags between the IR and the –rays of 40 days.
| Source | – | |||||||||
|---|---|---|---|---|---|---|---|---|---|---|
| erg s-1 | s | erg s-1 | cm | degree | ||||||
| Mkn 421 | 8e45 | 10–20 | 1.3e4 | 0.5 | 6e-4 | 8e-2 | 3.1 | 1e42 | 1e16 | 2 |
| BL Lac | 4e46 | 8–20 | 1.6e4 | 0.5 | 1e-2 | 1e-2 | 4.3 | 8e42 | 7e16 | 4 |
| 3C 279 | 1e48 | 10–25 | 1.0e4 | 0.5 | 4e-3 | 4e-2 | 2.1 | 1e45 | 5e17 | 2 |
4 Discussion
In this work we have considered internal shocks as the dissipation mechanism responsible for the emission in blazars. As mentioned in the Introduction, this scenario is currently the most accredited to explain the prompt gamma-ray emission in Gamma-Ray Bursts, despite of an efficiency problem (Lazzati, Ghisellini & Celotti 1999). In blazars instead the relatively low efficiency is in fact required as, at least in powerful objects, most of the jet power is carried to the large scales.
In S01 it was found that the internal shock model was successful in reproducing the observed SED and variability properties of a powerful blazar, namely 3C 279. However, the SED of this object does not represent the whole of the blazar class, which covers a wide range of spectral characteristics (luminosity, frequency of the peaks of the emission and their relative intensity). Interestingly these parameters appear to be correlated and the whole class can be seen as a sequence: the frequency and the ratio of the low vs high energy peak intensity increase with decreasing luminosity (Fossati et al. 1998).
We show here that the internal shock model can satisfactorily account also for the properties of the lower power blazars. The key parameters driving the phenomenological sequence are the jet power (proportional to the radiated one) and the intensity of the broad lines. These parameters in turn regulate the SED shape, as they control the cooling efficiency of the emitting particles. The global radiative efficiency appears instead to be similar for all of the sources examined.
The internal shock scenario determines a characteristic time interval for the injection of relativistic electrons of the order of the dynamical timescale, when the intensity of the spectrum from each collision is maximized. Two regimes are relevant: fast and slow cooling, corresponding to whether electrons of energy can or cannot radiatively cool in the dynamical time. In highly powerful blazars the fast cooling regime dominates in the inner regions (within the BLR) where also most of the power is dissipated. Consequently the peak frequencies are produced by electrons of energy . In the weakest blazars instead the slow cooling regime prevails over the whole jet. Consequently only the highest energy electrons can cool over such timescale: the peak frequencies thus shift to high values.
Between these two extremes there are intermediate sources, like BL Lac, with broad lines of intermediate intensity, produced at a distance within which a few shell-shell collisions can occasionally take place. Observationally this corresponds to SED with moderate Compton to synchrotron luminosity ratio, as the scattered seed photons are only the synchrotron ones (in collisions outside the BLR). The rare collisions within the BLR give rise to dramatic changes in the SED characterized by a large increase of the Compton component (e.g. BL Lac itself, see Fig. 2).
The model considered here, which considers self-consistently the dynamics and spectral emission, predicts also the time dependent spectral properties. In general, the selected parameters allow to reproduce the full range of spectral ’states’ observed in both BL Lac and Mkn 421. A more detailed comparison performed for Mkn 421, and based on the r.m.s. and variability timescales, shows good agreement for the X–ray variability properties, while the simulated optical variations appear to be too large with respect to the considered observed light curve.
An analysis of the predicted cross-correlated variability between the –ray and other bands reveals that only for BL Lac lags ( 10 days) are expected between the –rays and the infrared emission.
We conclude that the internal shock scenario can account for the the main properties of blazars and the ‘blazar sequence’.
While it has been previously pointed out that the key quantity in reproducing the different characteristics of blazars is the ratio between the jet and the disc (i.e. broad lines) luminosities, the internal shock scenario discussed here provides more physical insights, namely i) directly connects the radiated jet luminosity with the jet effective power and ii) accounts for the ‘preferred’ distance where most of the luminosity is dissipated. While the latter is similar for high and low power blazars, the BLR is instead located at different distances in the different sub–classes of objects (as determined by the ionizing luminosity).
From a more theoretical point of view, the model does not (yet) address the role of a seed magnetic field amplified by the shell-shell collisions. This would probably lead to a faster synchrotron cooling on the large scales and a flatter dependence of the field from (Fig. 3). We intend to further explore this issue. Furthermore, only internal shocks have been considered in this scenario. It is conceivable that at large jet scales some entrainment may occur causing an interaction of the jet with the external medium, possibly leading to external shocks. As a result the radiative efficiency and large scales synchrotron and inverse Compton emission could be enhanced. Clearly, the inverse Compton emission could be also enhanced if a significant photons field is present externally to the jet even on large scales (such as microwave background and/or beamed nuclear radiation and/or dust emission, e.g. Celotti, Ghisellini & Chiaberge 2001; Sikora et al. 2002).
Observationally the improved detection sensitivity of the planned TeV Cherenkov telescopes – such as VERITAS, HESS, MAGIC – will allow in the near future to measure emission from BL Lacs in low luminosity states, and thus to estimate their flare activity duty cycles. Since in the internal shock scenario the TeV emission is largely produced by the few powerful internal collisions, it will be then possible to further constrain model parameters such as the range of bulk Lorentz factors and the initial separation of the shells. Analogous results will be likely achieved for the more powerful blazars in the GeV band thanks to the AGILE and GLAST satellites.
Acknowledgements.
DG thanks the Observatory of Brera in Merate for kind hospitality and acknowledges the NSF grant AST-0307502 for financial support. AC thanks the JILA fellows, University of Colorado, for the warm hospitality and the Italian MIUR and INAF for financial support.References
- (1) Beloborodov A.M., 2000, ApJ, 539, L25
- (2) Bloom S. D., Bertsch D. L., Hartman R. C. et al., 1997, ApJ, 490, L145
- (3) Celotti A., Ghisellini G. & Chiaberge M., 2001, MNRAS 321, L1
- (4) Corbett E.A.,Robinson A., Axon D.J., Hough J.H., 2000, MNRAS, 311, 485
- (5) Costamante L. & Ghisellini G., 2002, A&A, 384, 56
- (6) Daigne F. & Mochkovitch R., 1998, MNRAS, 296, 275
- (7) Fossati G., Maraschi L., Celotti A., Comastri A. & Ghisellini G., 1998, MNRAS, 299, 433
- (8) Ghisellini G. & Madau P., 1996, MNRAS, 280, 67
- (9) Ghisellini G., Celotti A., Fossati G., Maraschi L. & Comastri A., 1998, MNRAS, 301, 451
- (10) Ghisellini G., 2002, in 25th John Hopkins Workshop, astro-ph/0111584
- (11) Guetta D., Spada M., & Waxman E., 2001, ApJ 557, 399
- (12) Kaspi S., Smith P.S., Netzer H., Maotz D., Iannuzi B.T. & Giveon U., 2000, ApJ, 533, 631
- (13) Lazzati, D., Ghisellini G. & Celotti A., 1999, MNRAS 309 , L13
- (14) Padovani P., Perlman E.S., Landt H., Giommi P., & Perri M., 2003, ApJ, 588, 128
- (15) Panaitescu A. & Mészáros P., 1999, ApJ, 526, 707.
- (16) Ravasio M., Tagliaferri G., Ghisellini G. et al. 2002, A&A, 383, 763
- (17) Ravasio M., Tagliaferri G., Ghisellini G., Tavecchio F., Bottcher M. & Sikora M., 2003, A&A, 408, 479
- (18) Rees M.J., 1978, MNRAS, 184, P61
- (19) Rees M.J. & Mészáros P., 1994, ApJ, 430, L93
- (20) Sikora M., Blazejowski M., Moderski R. & Madejski G.M., 2002, ApJ, 577, 78
- (21) Sikora, M., 1994, ApJS, 90, 923
- (22) Spada M., Ghisellini G., Lazzati D. & Celotti A., 2001, MNRAS, 325, 1559 (S01)
- (23) Spada M, Panaitescu A. & Mészáros P., 2000, ApJ 537, 824
- (24) Tanihata C., Takahashi T., Kataoka J. & Madejski G.M., 2003, ApJ, 584, 153
- (25) Tanihata C., Urry M., Takahashi T., Kataoka J., Wagner S.J., Madejski G.M., Tashiro M. & Kouda M., 2001, ApJ, 563, 569
- (26) Tosti G., Fiorucci M., Luciani M. et al., 1998, A&A, 339, 41
- (27) Ravasio M., Tagliaferri G., Ghi
- (28) Ulrich M.–H., Maraschi L. & Urry C.M., 1997, ARA&A, 35, 445
- (29) Wagner S.J. & Witzel A., 1995, ARA&A, 33,163
- (30) Vermeulen R.C., Ogle P.M., Tran H.D. Browne I.W.A., Cohen M.H., Readhead A.C.S. & Taylor G.B., 1995, ApJ, 452, L5