11email: gioia@ira.cnr.it 22institutetext: INAF - Osservatorio Astronomico di Brera, Via Brera 28, I-20121 Milano, Italy
22email: braito@brera.mi.astro.it, 22email: rdc@brera.mi.astro.it, 22email: tommaso@brera.mi.astro.it 33institutetext: Dipartimento Astronomia Universitá di Bologna, Via Ranzani 1, I-40127 Bologna, Italy
33email: mbranch@ira.cnr.it 44institutetext: Institute for Astronomy, ETH Hoenggerberg, HPF G4.2 CH-8093 Zurich, Switzerland
44email: vy@phys.ethz.ch
An X-ray review of MS 1054-0321: hot or not? ††thanks: Data presented here used the XMM-Newton facility
XMM-Newton observations are presented for the cluster of galaxies MS 10540321, the highest redshift cluster in the Einstein Extended Medium Sensitivity Survey (EMSS). The temperature inferred by the XMM-Newton data, T7.2 keV, is much lower than the temperature previously reported from ASCA data, T12.3 keV (Donahue et al. 1998), and a little lower than the Chandra temperature, T10.4 keV, determined by Jeltema et al. 2001. The discrepancy between the newly derived temperature and the previously derived temperatures is discussed in detail. If one allows the column density to be a free parameter, then the best fit temperature becomes T8.6 keV, and the best fit column density becomes N atoms cm-2. The iron line is well detected in the XMM-Newton spectrum with a value for the abundance of Z0.33 Z☉, in very good agreement with previous determinations. The derived XMM X-ray luminosity for the overall cluster in the 2–10 keV energy band is h-2 erg s-1 while the bolometric luminosity is h-2 erg s-1. The XMM-Newton data confirm the substructure in the cluster X-ray morphology already seen by ROSAT and in much more detail by Chandra. We find that only two of the three clumps detected in the weak lensing mass reconstruction image are visible in X-rays, as already noted by Jeltema et al. (2001). The central weak lensing clump is coincident with the main cluster component and has a temperature T8.1 keV. The western weak lensing clump coincides with the western X-ray component which is much cooler with a temperature T5.6 keV. The optically measured velocity dispersion, obtained from 145 cluster redshifts, is consistent with the velocity dispersion expected from the relationship once the XMM-Newton temperature is used. MS 10540321 fits well in the correlation available in the literature and derived from information collected for all clusters at redshfits of z1.27 known today and with a measured X-ray temperature. The cluster temperature seems to be commensurate with the predictions from its X-ray luminosity from the L relation of local clusters. Given the newly determined temperature, MS 10540321 is no longer amongst the hottest clusters known.
Key Words.:
galaxies: clusters: general, dark matter, intergalactic medium, cosmology, individual, MS 1054-0321 – X-rays: observations: general1 Introduction
MS 10540321 is the most luminous and distant cluster of galaxies in the EMSS (Gioia et al. 1990; Stocke et al. 1991). For some time it was the only very massive, high redshift cluster of galaxies (Gioia & Luppino 1994), hence it was extensively studied and observed at many different wavelengths. Donahue et al. (1998) performed an X-ray analysis using both ASCA and ROSAT and determined a high luminosity (L) and high gas temperature (T12.3 keV). Using this temperature Donahue et al. estimated a virial mass of within a radius r111within a region whose density is 500 times the critical density. Mpc. The X-ray emission of MS 10540321 is resolved by the ROSAT/HRI in two, possibly three clumps, plus an extended component indicating that the cluster is not relaxed and that some caution must be adopted when determining parameters from the X-ray data. Neumann & Arnaud (2000) used the same ASCA temperature and an isothermal model fit to the ROSAT/HRI data to obtain a total mass of within a virial radius r Mpc. The significant substructure observed in the HRI data by the above investigators was confirmed by Jeltema et al. 2001 (J01) who used the superb resolution of the Chandra instruments. J01 give a new determination of the temperature, T10.4 keV, lower than the ASCA temperature and measured, consequently, a lower virial mass of 6.2 within r222within a region whose density is 200 times the critical density. Mpc. A similar temperature for MS 10540321 was found by Joy et al. (2001) using Sunyaev Zeldovich Effect data. They derive a temperature T10.4 keV and a total mass within 94″ (corresponding to 389 kpc in the cosmology adopted in this paper) equal to M(. Vikhlinin et al. (2002) used the Chandra instruments, and derived an even lower value for the temperature, T7.80.6 keV, in agreement with the determination by Tozzi et al. (2003) who analyzed the same Chandra data and obtained T8.00.5 keV. In the optical band an extensive study by Tran et al. (1999) and van Dokkum et al. (2000), based on 24 and 81 spectroscopic cluster member redshifts, respectively, finds agreement between the observed velocity dispersion (150 km s-1; Tran et al. 1999) and the high X-ray measured ASCA temperature (T12.3 keV; Donahue et al. 1998), albeit within the large errors. From Hubble Space Telescope (HST) imaging, supplemented by ground telescope data, van Dokkum et al. (2000) detected a large overdensity of red cluster galaxies with irregular and elongated distribution. A very high fraction (17 per cent) of the cluster galaxies are classified as “mergers/peculiar” on the basis of double nuclei, tidal tails and distorted morphologies (see van Dokkum et al. 1999; van Dokkum et al. 2000).
Hoekstra, Franx & Kuijken (2000) performed a weak lensing study using a two-color mosaic of deep WFPC2 images and determined a mass of (1.20.2 within an aperture radius 1 Mpc, in good agreement with the previous estimators (Luppino & Kaiser 1997; Clowe et al. 2000). Assuming an isothermal mass distribution Hoekstra, Franx & Kuijken (2000) found a corresponding velocity dispersion of 1311 km s-1, again consistent with the X-ray and optical estimates. The weak lensing signal clearly shows three distinct clumps in the mass reconstruction distribution in agreement with the light distribution, that all appear to have similar masses.
An extremely deep 5-GHz survey of the cluster region down to 32 Jy (6; Best et al. 2000) detects a high number of radio sources (34 vs 25 expected from blank-field radio source counts). Surprisingly, no radio emission is detected towards the merger galaxies found in the HST images by van Dokkum et al. (2000) consistent with the hypothesis that low-luminosity radio sources may be triggered by initial weak interactions rather than direct mergers (Best et al. 2000). Johnson, Best & Almaini (2003) detected an excess of point sources in the archival deep Chandra image of the field of MS 10540321. Combined with identifications of cluster AGN from the radio work of Best et al. (2002), MS 10540321 seems to have a significantly enhanced AGN acitivity with respect to local galaxy clusters.
From all these data a consistent picture emerges of MS 10540321 as a young, massive, highly luminous cluster with significant substructure both in the X-ray and optical data, confirmed by the weak lensing mass reconstruction distribution. MS 10540321 was also observed by XMM-Newton. The new data analysis and interpretation are the subject of this paper. A new redshift determination from additional optical spectroscopic data is used in combination with the XMM-Newton data to provide a more accurate picture of the cluster. Comparisons are also made with previous analyses. Throughout the paper we use a Hubbble constant of km s-1 Mpc-1, q (for comparison with previous work on this cluster) and a cosmological constant of , except where noted. One arcmin corresponds to 248.6 h-1 kpc at the cluster redshift.
2 XMM-Newton Data
2.1 Observations and Data Analysis
XMM-Newton observed MS 10540321 as part of
the GTO program, on June 21, 2001 for about 40 Ks (Seq # 0094800101).
The European Photon Imaging Camera (EPIC), which incorporates one pn and
two MOS CCD arrays (Srüder 2001; Turner et al. 2001) was
operating in full-frame mode with the thin filter
applied. Unfortunately the observations suffer from time periods of
very high background.
Event files produced from the standard pipeline processing have been
examined and filtered (using the version 5.4 of the Science Analysis
Software, SAS, and the latest calibration files released by the EPIC
team) to remove the high background time intervals. Only events corresponding
to pattern 0-12 for MOS and pattern 0-4 for pn have been used333see the
XMM-Newton Users’ Handbook
http://xmm.vilspa.esa.es/external/xmm_user_support/documentation/uhb/XMM_UHB.htm.
The net exposure times, after data cleaning, are 28.4 Ks and
29 Ks for MOS 1 and MOS 2, respectively,
and 21.9 Ks for pn. Background counts have been accumulated using
nearby source-free circular regions. This observation suffers from high mean
background level thus the use of a local background estimate is more
appropriate than the blank-sky background which would lead to an
underestimate of the background counts.
Response matrices (that include the correction for the
effective area) have been generated using the SAS tasks arfgen and
rmfgen. The X-ray fluxes reported below are computed using the
MOS2 detector and calibration(s). The normalization of the MOS1 is
about 2% higher than for MOS2 whereas the normalization of the pn is 7.5%
higher.
2.2 Overall Cluster Properties
Fig. 1 shows the XMM-Newton MOS2 image of MS 10540321. The X-ray cluster is elongated in the east-west direction and follows the distribution of optical galaxies well visible in the I-band image of MS 10540321 shown in Fig. 7. The point source to the south is also marked. The X-ray image has two distinct components (Component 1 and Component 2) plus a fainter emission region (indicated as Component 3 in the figure) between the cluster main emission and the point source emission.
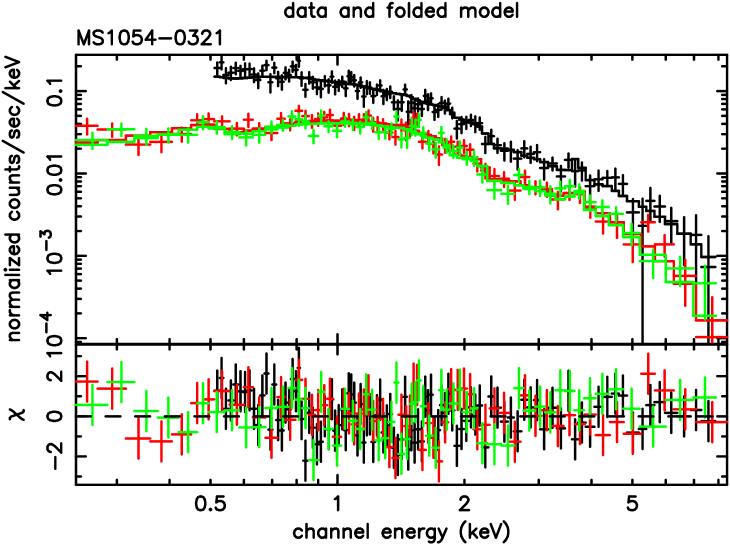
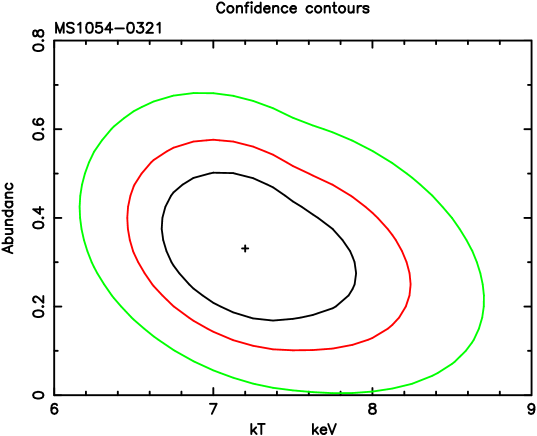
In order to measure the emission-weighted cluster temperature, net counts were extracted from a circle of radius 1.5′ centered at in the MOS1 and MOS2 detectors. The 1.5′ radius was chosen to have the same parameters previously used by J01 in order to compare our results with theirs. There are 239254 net counts, in the 0.2–8 keV energy range, in MOS2 (219852 in MOS1) and 448675 net counts in the pn detector (the pn counts are taken in the 0.5–8 keV band to avoid calibration uncertainties of the pn in the softer energy band). The data were fitted with a MEKAL model (Mewe, Gronenschild & van den Oord, 1985) modified by Galactic absorption. The absorption and redshift were kept constant while the abundance and temperature were left free to vary. The Galactic absorption was fixed at the Galactic value of atoms cm-2 (Dickey & Lockman 1990), and the redshift was fixed at z0.83 (Tran et al. 1999; van Dokkum et al. 2000). The point source to the south (indicated as Point Source in Fig. 1) at , , corresponds to the point source previously seen as an extension to the south in the ROSAT HRI data, and as a point source in the Chandra image published by J01. This source was excluded from the analysis of the cluster by masking a circular region with radius 15″, and will be discussed later. The best fit with a thermal MEKAL model gives a temperature T7.2 keV and an abundance Z0.33 Z☉, relative to the abundances of Grevesse & Sauval (1998)444As suggested by Gastaldello & Molendi (2002), we have adopted the Grevesse & Sauval values since the community has converged towards a “standard solar composition” given the discrepancies between meteoritic and photospheric solar abundances, particularly for iron, as quoted in a review by Anders & Grevesse (1989). We note that using the ratio between the elements fixed to the solar values of Grevesse & Sauval results in abundance values higher by a factor 1/0.676 than using the solar values of Anders & Grevesse (1989). This is due to the fact that Grevesse & Sauval use a 0.676 times lower iron abundance.. The best fit X-ray spectral parameters are listed in Table 1. Throughout this paper quoted uncertainties are 90% confidence levels for one interesting parameter.
The binned X-ray spectrum and best fit folded model are shown in Fig. 2 where bins include at least 40 counts each (50 counts each for the pn). The fit has an acceptable reduced of 0.986 for 219 degrees of freedom. The contours for iron abundance versus cluster temperature are shown in Fig. 3. The absorbed flux in the 2–10 keV energy band, excluding the point-like source to the south, is F(3.400.17) erg cm-2 s-1. The unabsorbed K-corrected luminosity in the same energy band is h-2 erg s-1 while the bolometric luminosity is h-2 erg s-1. Given the detection of the iron line, we can thaw the redshift parameter in XSPEC and fit for it. The best fit for the redshift is z0.847, in very good agreement with the optical spectroscopic determination.
We have then fitted the data allowing the NH to be a free parameter and using a one-temperature MEKAL model. The resulting value for the column density is N atoms cm-2, lower than the Galactic value, and the resulting temperature is T8.6 keV, higher than when freezing the NH. The abundance becomes Z0.22 Z☉, and the reduced is 0.923 for 218 degreees of freedom. This result goes in the same direction as the result by Tozzi et al. 2003 for MS 10540321 (see their Fig. 12) where they also obtain an higher temperature ( 10 keV) and a lower column density value when they allow the NH to vary.
We have also explored the effect of fitting a two-temperature MEKAL model to the data to check if there is a soft emission coming from a cooler temperature plasma, due to the presence of groups and poor clusters emission falling into the larger cluster. We obtain a value for the column density lower than the Galactic value: NH goes from 1.3 to 2.6 atoms cm-2, while the two temperatures assume values of 0.2 keV and 9 keV but with a great degeneracy which makes impossible to assign any error to the fit. From a purely statistical point of view, the addition of the softer thermal component is not supported by the F-test (Bevington & Robinson, 1992).
2.3 Cluster Substructure
Jeltema et al. (2001) show in Fig. 9 of their paper that the central and western clumps of the weak lensing study correspond to the eastern and western Chandra X-ray clumps, respectively. Several galaxies lie at the position of the eastern clump, including the cD, while the western clump appears to have galaxies which are lining the southern edge of the clump. We have enough statistics in the XMM-Newton data to examine the two X-ray peaks (Component 1 and Component 2) separately by putting an extraction circle of radius 0.47′ centered on each peak. The 0.47′ radius was chosen to avoid overlapping the extraction circles placed on the two separate clumps and thus any possible contamination between them (see Fig. 1). For the eastern component the center was fixed at , while the western peak is centered at . There are between 580 and 660 net counts in each clump according to which MOS is considered (see Table 1), and approximately over twice this number of counts in the pn. In total there are 238749 net counts in the eastern clump and 224550 net counts in the western clump. The spectrum of each clump was fitted with a MEKAL model with the NH fixed at the Galactic value of atoms cm-2, the redshift fixed at 0.83, and the iron abundance and temperature were left free to vary. Given the reduced statistics with respect to the cluster as a whole, the data were binned to include a minimum of 20 counts per bin. The eastern component has a best-fit temperature of T8.1 keV with a reduced of 1.4 for 115 degrees of freedom. This temperature is consistent with the cluster temperature, while the western component is somewhat cooler with a best-fit temperature of T5.6 keV and a reduced of 1.26 for 110 degrees of freedom. The spectra and best-fit models are shown in Fig. 4 and Fig. 5. The western clump was found to be cooler also in the Chandra analysis by J01 who quote a temperature T10.5 keV for the eastern clump, and T6.7 keV for the western clump. We find the iron abundances of the eastern and western components to be Z0.12 Z☉ and Z0.51 Z☉, respectively. Given the large uncertainties these abundances are found to be consistent between each other and with the cluster abundance. Similar results were found by J01 even if their abundances are relative to Anders & Grevesse (1989). The absorbed fluxes in 2–10 keV for the two clumps are F(9.690.67) erg cm-2 s-1 and F(6.940.59) erg cm-2 s-1, respectively, while the unabsorbed K-corrected luminosities in the same energy bands are L(1.050.07) erg s-1 and L(8.690.73) erg s-1. The respective bolometric luminosities are L(2.230.15) erg s-1 and L(1.820.15) erg s-1. We attempted to examine also the emission region marked as Component 3 in Fig. 1 by putting an extraction circle of radius 0.47′ centered as indicated in the figure. A higher temperature than the cluster as a whole is found of T8.2 keV, and an abundance of Z0.23 Z☉. The large errors are due to the reduced statistics. There are only 350 net counts per detector. Given the small number of photons, this emission region will not be considered any further.
As previously noted by Clowe et al. (2000) and by J01 the eastern weak lensing clump is X-ray dark. It is unclear why this mass density peak is not seen in X-rays. As J01 suggested, MS 10540321 could be in a pre-merger state given the clear separations of the two X-ray peaks. In this scenario the eastern weak lensing peak could still be forming and not be yet virialized, and it is thus underluminous in X-rays.
2.4 Point Source to the South
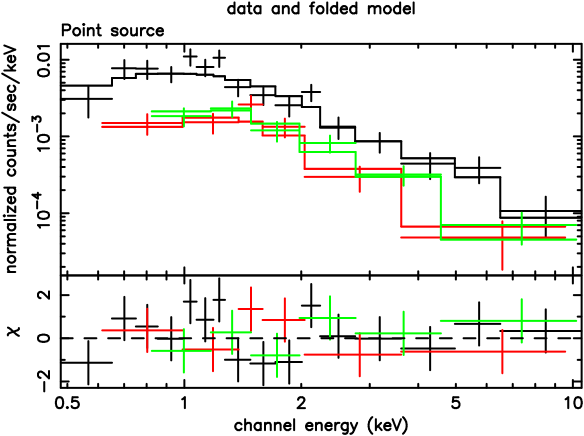
In order to examine the point source to the south, a circle of 0.33′ was centered at , . There are only a total of 45424 net counts in the source. Fitting to an absorbed power law gives a N atoms cm-2 with a photon index =1.90.2, and a reduced of 0.97 for 23 degrees of freedom. Both the column density (higher than the Galactic value) and the power law values are in very good agreement with the Chandra analysis by J01, who find a power law with a photon index =1.70.3, and a N atoms cm-2 . The observed flux in the 2–10 keV energy band for this source is F(3.01.0) erg cm-2 s-1. An X-ray spectrum is given in Fig. 6. The X-ray parameters are reported in Table 3. The optical image shows a quasi stellar object for which no optical spectroscopy was performed. We do not have an identification for this source. However its point-like appearance in the optical image plus the X-ray spectrum which has a photon index typical of Seyfert 1 active galactic nuclei suggest that the source could be an AGN.
3 Optical Data
Deep optical CCD images of MS 10540321 from the ground and from space have been acquired by several investigators in order to perform weak lensing studies and morphological analyses of the cluster galaxy population (Clowe et al. 2000; Hoekstra, Franx & Kuijken 2000; van Dokkum et al. 2000). van Dokkum et al. (1999) discover a high fraction of galaxy mergers in MS 10540321 which argues against formation of elliptical galaxies in a single “monolithic” collapse at high redshift but is in qualitative agreement with predictions of hierarchical models for structure formation. An impressive HST mosaic obtained with deep WFPC2 images in two colors is published in van Dokkum et al. (2000). The mosaic shows the filamentary appearence of MS 10540321: the cluster is easily identified as the horizontal and broad swath of red galaxies in the center of the frame. The cluster has also been observed several times at the Keck telescope to obtain spectroscopic redshifts for the member galaxies (Donahue et al. 1998; Tran et al. 1999; van Dokkum et al. 2000).
A larger number of spectroscopic redshifts mainly taken at the Keck telescope of both field galaxies and cluster members have been gathered by one of us (K-VT) and her collaborators. From a magnitude selected sample Tran et al. (in preparation) have spectroscopically confirmed cluster membership for 145 galaxies in a 7 region centered on the cluster. From this large sample, they determine the cluster mean redshift and velocity dispersion to be z0.83080.0006 and 80 km s-1, with smaller uncertainties with respect to previous determinations by these same authors. MS 10540321 may well be the only z0.8 cluster today with such a huge number of redshift determinations. The substructure evident in both X-ray and weak-lensing maps is also observed in the optical. The most significant optically identified subcluster lies 45″ east of the BCG (Bright Cluster Galaxy) and, in comparison to the bulk of cluster members, is at lower redshift (z0.82810.0016) and has a smaller velocity dispersion ( km s-1). This clump is the only significant clump identified using the Dressler-Shectman test (Dressler & Shectman 1988). A direct comparison among the clumps in X-ray, weak lensing and optical data is not straightforward since the peaks do not coincide in the three wavebands. We have placed optical circles corresponding to the eastern and western X-ray clumps for comparison purposes. Redshifts and velocity dispersions have been recomputed for the galaxies in the two X-ray clumps. These data are presented in Table 4. The discrepancy in their mean redshifts and their large dispersions illustrates how unrelaxed MS 10540321 is and how much the distribution of the X-ray gas deviates from the optical distribution of galaxies.
4 Results and Discussion
The main result from the new XMM-Newton data is the lower measured value for the temperature of MS 10540321 with respect to previous determinations. The XMM-Newton temperature, T7.2 keV, is definitely lower than the ASCA temperature T12.3 keV (Donahue et al. 1998), and also somewhat lower, even taking into account the uncertainties, than the Chandra temperature, T10.4 keV, reported by J01. It is however fully consistent with the Chandra temperature, T7.80.6 keV, published by Vikhlinin et al. (2002) (see their Table 2), and with the Chandra temperature, T8.00.5 keV, published by Tozzi et al. (2003) (see their Table 3). The iron abundance inferred from the XMM-Newton observations is found to be in very good agreement with previous determinations by both J01 (Z0.380.15 Z☉) and by Tozzi et al. (2003) (Z0.350.07 Z☉) after their abundances are rescaled to the Grevesse & Sauval (1998) values while Vikhlinin et al. (2002) fix the abundance to Z=0.3 Z☉. MS 10540321 is in many aspects very similar to other distant X-ray selected clusters like RXJ 1717+67 at (Gioia et al. 1999), or RXJ 0152.71357 at (Della Ceca et al. 2000; Ebeling et al. 2000) which show elongated or double morphologies in optical, weak lensing and X-rays and which have moderate temperature values.
While it is possible that ASCA included other sources in its larger field of view, the lower X-ray temperature found for this cluster by this analysis, seems to be more accurate given the agreement of three out of four measurements (this paper; Vikhlinin et al., 2002; Tozzi et al., 2003). In order to verify the correctness of our XMM-Newton results we have analyzed the Chandra archival data of MS 10540321 and used all the information in the J01 paper to duplicate exactly their data reduction. There is a number of corrections to be made to the data. One of them, the ACISABS correction555http://www.astro.psu.edu/users/chartas/xcontdir/xcont.html, was not available at the time of the J01 analysis and was implemented later in the suggested steps for Chandra data reduction. This correction takes into account the quantum efficiency degradation at low energies, below 1 keV. The application of the ACISABS correction shifts the temperature towards lower values. There are several flares in the Chandra data, mostly visible only in the ACIS S3 back-illuminated chip, which contribute to raise the temperature. In the following analysis we use: a 1.5′ extraction radius at the same cluster center as J01, the 0.8–7 keV energy range for the spectral fit, subtraction of point sources including the one to the south at the same position as J01, local background estimate, use of the Anders & Grevesse abundance values, counts binned in intervals so as to have at least 20 counts per bin, fit with a Raymond-Smith (Raymond & Smith 1977) thermal plasma model, NH fixed to the Galactic value, temperature and abundance left free to vary. The two different parameters used are a lower exposure time of 67,478s (to cut out the time intervals affected by the flares) and application of the ACISABS correction. We obtain a value for the Chandra temperature T7.4 keV, and an abundance Z0.200.14 Z☉, fully consistent with our XMM-Newton spectral result. If instead we release the two corrections (ACISABS, lower exposure time) then we obtain the same values as published by J01, namely T10.1 keV and Z0.220.16 Z☉. Adopting all the corrections and the same parameters as in Vikhlinin et al. (2002) we obtain exactly their same value for the temperature T7.81 keV. Thus we are confident that our XMM-Newton data analysis is correct since the two different datasets, XMM-Newton and Chandra, yield exactly the same result.
We check now how MS 10540321 fits in the L relation of galaxy clusters. Understanding the evolution of the L relation is important not only to understand the physics behind the formation of galaxy clusters, but also because it provides a link between observations of clusters and derivation of cosmological parameters. The L relation has been well studied at low redshift. There is no consensus yet on the evolution of the L relation with redshift (see among others: Borgani et al. 2001; Holden et al. 2002; Novicki et al. 2002; Vikhlinin et al. 2002) probably due to the lack of large samples of galaxy clusters at cosmologically significant redshift. By comparing the bolometric luminosity of MS 10540321 with the best fit relationship log(Llog(T/6keV)(45.060.03) by Arnaud & Evrard (1999), or using similar observationally determined relationships, one would expect for MS 10540321 a temperature T8.20.15 keV which is well in agreement within the errors with the measured XMM-Newton temperature.
We check next the relationship. We can estimate the velocity dispersion for MS 10540321 from the X-ray data and compare the result with the optical data. The velocity dispersion implied by the XMM-Newton temperature using the relation T with 1 (that is assuming energy equipartition between the galaxies and the gas) is km s-1, consistent with the observed optical velocity dispersion within the errors, implying that the velocity dispersion reflects the temperature of the gas. Girardi et al. (1996) have derived a best fit relation between the velocity dispersion and the X-ray temperature equal to Log()(2.530.04)+(0.610.05)log(T), with more than 30% reduced scatter with respect to previous work by taking into account distortions in the velocity fields, asphericity of the cluster or presence of substructures. Using the temperature T7.2 keV of MS 10540321 in the above relation, the resulting velocity dispersion value, km s-1, is in very good agreement with the measured optical value, 80 km s-1. The relation between temperature and velocity dispersion has been published by several authors. Last in order of time, this relation can be found in Lubin, Mulchaey & Postman (2003) where the authors have collected the information known today for all clusters at redshfits of z1.27 with a measured X-ray temperature. There is a big scatter in the TX relation (see their figure 4) but the average relation is consistent with up to these redshifts. We find that MS 10540321 follows closely this correlation.
We can also estimate the mass of MS 10540321 using the X-ray temperature value. With the assumptions that the mean density in the virialized region is 200 times the critical density at the redshift of the cluster and that the cluster is isothermal (Evrard, Metzler & Navarro 1996; Donahue et al. 1998), we can use the scaling law method as illustrated in Arnaud & Evrard (1999). From the simulations of Evrard, Metzler & Navarro (1996) for the mass-temperature relation one can estimate the virial mass within a radius r1.85(T/10keV) h-1 Mpc by using the equation M. From the XMM-Newton temperature the virial mass is approximately M M☉ within r Mpc, where the uncertainties on the mass reflect the uncertainties on the temperature. This mass is lower than the one derived by J01 Mpc = 6.2) because they use a higher Chandra temperature which, given the relation between r200 and T, converts in a larger r200 (their 0.76 Mpc vs our 0.63 Mpc). The virial mass derived from the XMM-Newton temperature is definitely lower than the mass derived from weak lensing by Hoekstra, Franx & Kuijken (2000) of 1.20.2 who used a different aperture radius of 1 Mpc. It is not possible with the present XMM-Newton data to assume an aperture radius of 1 Mpc (1.75′ using the Hoekstra et al. cosmology) since we are running into the gaps between the chips for the pn detector.
Given the XMM-Newton results, MS 10540321 appears to be a more “normal” cluster with high, but not extreme X-ray luminosity or temperature values. Its temperature seems to be commensurate with the predictions from its X-ray luminosity from the L relation of local clusters published in the literature. The optically measured velocity dispersion is consistent with the velocity dispersion expected from the relationship. Given the clear evidence for substructure in the cluster morphology, indicative of a still unrelaxed cluster, it is surprising that the global properties of MS 10540321 fit so well in any local cluster correlation.
5 Summary
We have presented new observations for the z0.83 galaxy cluster MS 10540321 performed with the instruments on board the XMM-Newton satellite. The main result of this paper is the lower value indicated by the XMM-Newton observations for the overall cluster X-ray temperature with respect to some of the previous analyses. Excluding the contribution of the southern point source the temperature of the cluster is T7.2 keV. If one allows the column density to be a free parameter then the best fit temperature is T8.6 keV, and the best fit column density becomes N atoms cm-2. The iron line is well detected with a value for the abundance of Z0.33 Z☉. The point source to the south is fitted by an absorbed power law with N atoms cm-2 and a photon index =1.90.2. The XMM-Newton data confirm the substructure in the cluster X-ray morphology already seen by previous experiments. The two main clumps have very different temperatures. The eastern clump is hotter (T8.1 keV) compared to the western clump (T5.6 keV), as also found by J01. MS 10540321 has an X-ray luminosity in the 2–10 keV energy band of h-2 erg s-1 and a bolometric luminosity of h-2 erg s-1. The velocity dispersion derived from the X-ray temperature for the whole cluster is in good agreement with the most recent determination of the observed velocity dispersion derived from a much enlarged database of 145 cluster member redshifts. MS 10540321 fits well in the correlation available in the literature and derived from information collected for all clusters at redshfits of z1.27 known today and with a measured X-ray temperature.
We have discussed in detail the discrepancy between the XMM-Newton and Chandra derived temperatures and found that the origin of this discrepancy is mainly due to corrections to be implemented in the Chandra data to obtain a much cleaner dataset. An analysis of the Chandra archival data taking into account all the possible corrections yields a temperature T7.4 keV, in excellent agreement with the XMM-Newton determined temperature value. Given these results MS 10540321 is no longer amongst the hottest clusters known but it is more similar to other X-ray selected clusters in the same redshift range with moderate temperatures and elongated or double morphologies seen in different waveband domains.
Acknowledgements.
We are grateful to G. Illingworth and M. Franx for access to the MS 10540321 Keck spectroscopic database, and to the referee, M. Donahue, who made many constructive criticisms which improved this paper.References
- Anders & Grevesse (1989) Anders, E. & Grevesse, N. 1989, Geochim. Cosmochim. Acta, 53, 197
- Arnaud & Evrard (1999) Arnaud, M. & Evrard A. E. 1999, MNRAS, 305, 631
- Best et al. (2002) Best, P.N., van Dokkum, P.G., Franx, M. & Röttgering, H.J.A. 2002, MNRAS, 330, 17
- Bevington & Robinson (1992) Bevington, P.R. & Robinson, D.K. Data Reduction and Error Analysis for the Physical Sciences 1992, New York: McGraw-Hill, publishers
- Borgani et al. (2001) Borgani, S. et al. 2001, ApJ, 561, 13
- Clowe et al. (2000) Clowe, D., Luppino, G.A., Kaiser, N. & Gioia, I.M. 2000, ApJ, 539, 540
- Della Ceca et al. (2000) Della Ceca, R., Scaramella, R., Gioia, I.M., Rosati, P., Fiore, F. & Squires, G. 2000, A&A, 353, 498
- Dickey & Lockman (1990) Dickey, J.N. & Lockman, F.J. 1990, ARA&A, 28, 215
- Donahue et al. (1998) Donahue, M., Voit, G.M., Gioia, I., Luppino, G., Hughes, J. & Stocke, J. 1998, ApJ, 502, 550
- Dressler & Shectman (1998) Dressler, A. & Shectman, S. A. 1988, AJ, 95, 284
- Ebeling et al. (2000) Ebeling, H., Jones, L.R., Perlman, E., Scharf, C., Horner, D., Wegner, G., Malkan, M., Fairley, B. W. & Mullis, C. R. 2000, ApJ, 534, 133
- Evrard, Metzler & Navarro (1996) Evrard, A.E., Metzler, C.A. & Navarro, J.F. 1996, ApJ, 469, 494
- Gastaldello & Molendi (2002) Gastaldello, F. & Molendi, S. 2002, ApJ, 572, 160
- Gioia et al. (1990) Gioia, I.M., Maccacaro, T., Schild, R.E., Wolter, A., Stocke, J.T., Morris, S.L. & Henry, J.P. 1990, ApJS, 72, 567
- Gioia & Luppino (1994) Gioia, I.M. & Luppino, G.A. 1994, ApJS, 94, 583
- Gioia et al. (1999) Gioia, I.M., Henry, J.P., Mullis, C.R., Ebeling, H. & Wolter, A. 1999, AJ, 117, 2608
- Girardi et al. (1996) Girardi, M., Fadda, D., Giuricin, G., Mardirossian, F. and Mezzetti, M. 1996, ApJ, 457, 61
- Grevesse & Sauval (1998) Grevesse, N. & Sauval, A.J. 1998, Space Sci. Rev., 85, 161
- Hoekstra, Franx & Kuijken (2000) Hoekstra, H., Franx, M. & Kuijken, K. 2000 ApJ, 532, 88
- Holden et al. (2002) Holden, B.P., Stanford, S.A., Squires, G.K., Rosati, P., Tozzi, P., Eisenhardt, P. & Spinrad, H. 2002, AJ, 124, 33
- Jeltema et al. (2001) Jeltema, T.E., Canizares, C.R., Bautz, M.W., Malm, M.R., Donahue, M., & Garmire, G.P. 2001, ApJ, 562, 124 (J01)
- Johnson, Best & Almaini (2003) Johnson, O., Best, P.N. & Almaini, O. 2003, MNRAS, 343, 924
- Joy et al. (2001) Joy, M., LaRoque, S., Grego, L., Carlstrom, J.E., Dawson, K., Ebeling, H., Holsapfel, W.L., Nagai, D. Reese, E.D. 2001, ApJ, 551 L1
- (24) Lubin, L.M., Mulchaey, J.S. & Postman, M. 2004, ApJ, 601, L9
- Luppino & Kaiser (1997) Luppino, G.A. & Kaiser, N. 1997, ApJ, 475, 20
- Mewe, Gronenschild & van den Oord (1985) Mewe, R., Gronenschild, E.H.B.M. & van den Oord, G.H.J. 1985, A&AS, 62, 197
- Neumann & Arnaud (2000) Neumann, D.M. & Arnaud, M. 2000, ApJ, 542, 35
- Novicki et al. (2002) Novicki, M. C., Sornig, M. & Henry, J.P. 2002, AJ, 124, 2413
- Raymond & Smith (1977) Raymond, J.C. & Smith, B.W. 1977, ApJS, 35, 419
- Srüder (2001) Srüder, L. et al. 2001, A&A, 365, L18
- Stocke et al. (1991) Stocke, J.T., Morris, S.L, Gioia, I.M., Maccacaro, T., Schild, R.E., Wolter, A., Fleming, T.A. & Henry, J.P 1991, ApJS, 76, 813
- Tozzi et al. (2003) Tozzi, P., Rosati, P., Ettori, S., Borgani, S., Mainieri, V. & Norman, C. 2003, ApJ, 593, 705
- Tran et al. (1999) Tran, K-V. H., Kelson, D.D., van Dokkum, P.G., Franx, M., Illingworth, G.D. & Magee, D. 1999, ApJ, 522, 39
- Turner et al. (2001) Turner, M.J.L. et al. 2001, A&A, 365, L27
- van Dokkum et al. (1999) van Dokkum, P.G., Franx, M., Fabricant, D., Kelson, D.D. & Illingworth, G.D. 1999, ApJ, 520, L95
- van Dokkum et al. (2000) van Dokkum, P.G., Franx, M., Fabricant, D., Illingworth, G.D. & Kelson, D.D. 2000, ApJ, 541, 95
- Vikhlinin et al. (2002) Vikhlinin, A., VanSpeybroeck, L., Markevitch, M., Forman, W. R. & Grego, L. 2002, ApJ, 578, L107
| RA (J2000) | DEC (J2000) | Instr | R | Net Cts | T | Z | NH | Region |
|---|---|---|---|---|---|---|---|---|
| h m s | ∘ ′ ″ | ′ | 210 keV | keV | Z☉ | at/cm2 | ||
| 10 56 58.7 | -03 37 45 | 7.2 | 0.33 | frozena | whole cluster | |||
| 8.6 | 0.22 | 1.33 | whole cluster | |||||
| MOS1 | 1.5 | 219852 | ||||||
| MOS2 | 1.5 | 239254 | ||||||
| pn | 1.5 | 448675 | ||||||
| 10 57 00.3 | -03 37 29 | 8.1 | 0.12 | frozena | Component 1 | |||
| MOS1 | 0.47 | 58325 | ||||||
| MOS2 | 0.47 | 60425 | ||||||
| pn | 0.47 | 120036 | ||||||
| 10 56 56.6 | -03 37 36 | 5.6 | 0.51 | frozena | Component 2 | |||
| MOS1 | 0.47 | 52424 | ||||||
| MOS2 | 0.47 | 57525 | ||||||
| pn | 0.47 | 114636 |
-
a
NH fixed at the Galactic value of atoms cm-2
| RA (J2000) | DEC (J2000) | FX (2–10 keV) | LX (2–10 keV) | LBOL | Region |
|---|---|---|---|---|---|
| h m s | ∘ ′ ″ | erg cm-2 s-1 | erg s-1 | erg s-1 | |
| 10 56 58.7 | -03 37 45 | 3.400.17 | 3.810.19 | 8.050.40 | whole cluster |
| 10 57 00.3 | -03 37 29 | 0.970.07 | 1.050.07 | 2.230.15 | eastern Component 1 |
| 10 56 56.6 | -03 37 36 | 0.690.06 | 0.870.07 | 1.820.15 | western Component 2 |
| RA (J2000) | DEC (J2000) | Instr | R | Net Cts | NH | Flux (2–10 keV) | |
|---|---|---|---|---|---|---|---|
| h m s | ∘ ′ ″ | ′ | at/cm2 | erg cm-2 s-1 | |||
| 10 56 58.8 | -03 38 52 | 1.70.7 | 1.90.2 | 3.01 | |||
| MOS1 | 0.33 | 10111 | |||||
| MOS2 | 0.33 | 8911 | |||||
| pn | 0.33 | 26418 |
| RA (J2000) | DEC (J2000) | R | Ngals | TX | LBOL | ||
|---|---|---|---|---|---|---|---|
| h m s | ∘ ′ ″ | ′ | km s-1 | keV | 1044 erg s-1 | ||
| 10 57 00.3 | -03 37 28.8 | 0.47 | 17 | 0.82970.0020 | 1225250 | 8.1 | 2.23 |
| 10 56 56.6 | -03 37 36.3 | 0.47 | 11 | 0.83420.0022 | 1353315 | 5.6 | 1.82 |