Anomalous Flux Ratios in Gravitational Lenses: For or Against CDM?
Abstract
We review the evidence for substructures from the anomalous flux ratios in gravitational lenses. Using high-resolution numerical simulations, we show that at typical image positions, the fraction of surface mass density in substructures is with mass above virial masses in the “concordance” cosmology. Substructures outside the virial radius (but projected at typical lens image positions) only increase the fraction moderately. Several effects, in particular baryonic settling and the requirement of compactness, may further decrease the predictions by a factor of few. The predicted fraction with appropriate properties thus appears to be lower than that required by lensing, although both are still uncertain. More speculative substructures such as massive black holes () in the halo may offer viable alternatives.
1 INTRODUCTION
Gravitational lenses on arcsecond scales provide a unique sample to probe the mass distribution in the lensing galaxies at intermediate redshift (). Image positions in most lenses can be fitted adequately using simple smooth galaxy mass models. But observed flux ratios are more difficult to match (e.g., Kochanek 1991). The discrepancy between the predicted and observed flux ratios is commonly referred to as the “anomalous flux ratio problem.” The most apparent cases are found in quadrupole lenses where we observe a close pair or a close triple of images. Here we know that the lensed source is close to either a fold or a cusp caustic. The asymptotic magnification behavior in such cases is well understood – a close pair must have equal brightness, while for a close triple, the flux of the middle image should be equal to the total fluxes of the two outer images. Virtually all the observed pairs and triples disagree with these relations (§2). This has been argued as evidence for substructures on the scale of the separations of the images (a few tenths of arcseconds, e.g., Mao & Schneider 1998; Metcalf & Zhao 2002). Another piece of evidence for substructures is the fact that saddle images are preferentially dimmed compared to model predictions (Kochanek & Dalal 2003). This is expected from milli-lensing by substructures (Keeton 2003) or microlensing by stars (Schechter & Wambsganss 2002)111We refer to lensing by substructures and lensing by stars as milli-lensing and microlensing respectively because the angular scales involved are mas and as in these two cases.; such a preferential de-magnification of saddle images is not expected from other propagational effects.
The Cold Dark Matter (CDM) structure formation model predicts the existence of just such substructures from both semi-analytical studies and numerical simulations (e.g., Kauffmann et al. 1993; Klypin et al. 1999; Moore et al. 1999; Ghigna et al. 2000). About 5-10% of the mass is predicted to be in substructures with a mass spectrum of . Intriguingly, the predicted number of subhaloes in CDM exceeds the observed number of luminous satellite galaxies in a Milky-Way type galaxy (e.g., Klypin et al. 1999; Moore et al. 1999; see also Stoehr et al. 2002). One solution for this disagreement may be that some substructures, especially those of lowest mass, are dark. If this is true, then gravitational lensing may be the best way to detect them. In this paper, we examine the required amount of substructures in gravitational lenses (§2) and compare it with the predictions from CDM (§3). Finally, in §4, we discuss several effects that affect the predictions of numerical simulations. Throughout this paper, we adopt the “concordance” cosmology (e.g., Ostriker & Steinhardt 1995; Spergel et al. 2003 and references therein), with a density parameter , a cosmologically constant , a baryon density parameter , and we take the power-spectrum normalization . We write the Hubble constant as with .
2 Required Amount of Substructures From Gravitational Lenses
A number of papers have discussed evidence for substructures from gravitational lenses; most concentrated on the anomalous flux ratios (e.g., Mao & Schneider 1998; Metcalf & Madau 2001; Chiba 2002; Bradac et al. 2002; Dalal & Kochanek 2003; Keeton 2003), while several papers discussed astrometric signatures, such as bent jets in B1152+199 (Metcalf 2002), and unusual VLBI structures for MG2016+112 (Kochanek & Dalal 2002; see also Koopmans et al. 2002) and B0128+437 (Phillips et al. 2000; Biggs et al. 2003). It is illustrative to see the issues using the largest homogeneous lens survey – the Cosmic Lens All-Sky Survey (CLASS, Myers et al. 2003 and Browne et al. 2003). This radio survey has well defined selection criteria and does not suffer from the effect of dust extinction. Radio lenses are also not substantially affected by stellar microlensing (see Koopmans et al. 2003 and references therein).
In total, there are 22 new lenses discovered in CLASS. Among these, 7 are simple quadrupole lenses, including 5 close pairs (B0128+437, Phillips et al. 2000; MG0414+0534, Hewitt et al. 1992; B0712+472, Jackson et al. 1998; B1608+656, Myers et al. 1995; B1555+375, Marlow et al. 1999), and two close triples (B2045+265, Fassnacht et al. 1999; B1422+231, Patnaik et al. 1992). For the five pairs listed above, the observed flux ratios are (5GHz), (15GHz), (15GHz), (8.4GHz), (15GHz); for each lens, the highest frequency where the pair has been observed is shown in the bracket. For the two close triples, the ratios of the flux of the middle image to the total flux of the two outer images are, (14.9GHz) and (15GHz, Patnaik & Narasimha 2001) respectively. The typical errors on the flux ratios are . Except the case of MG0414+0534, the observed values are all different from the asymptotic value (unity).
However, not all these flux ratios are “anomalous” because some of these systems may not yet reach the asymptotic regime. Also some radio lenses may have been affected by scattering by free electrons along the line of sight. In addition, most lens modelers adopt isothermal ellipsoidal models or variants as an approximation for the lensing potentials. Models with more complex radial and angular structures can usually better reproduce the observed flux ratios (e.g., Evans & Witt 2003; however, see Kochanek & Dalal 2003). Observationally, it is clear that some lens systems are complex. For example, B1608+656 has two lensing galaxies and a model which accounts for this fact can reproduce the observed flux ratio (Koopmans & Fassnacht 1999). For B0712+472, a singular isothermal ellipsoid (SIE) model cannot reproduce the flux ratio, but a foreground group of galaxies was subsequently found along the line of sight of the primary lensing galaxy (Fassnacht & Lubin 2002), so a more realistic model may match the flux ratio. The close pair flux ratio in B1555+575 cannot be reproduced by an SIE model (Meyers et al. 1995), but a more complex model (e.g., with an additional shear) may be able to explain it. For B0128+437, an SIE model cannot fit the flux ratio, but the observed flux ratio can be reproduced with an additional shear. However, in this case, the relative orientations of jets in this system appear difficult to match with a smooth model (Biggs et al. 2003), so substructures may yet be called for. For the two close triple lenses, the flux ratios appear difficult to match with smooth models (Mao & Schneider 1998; Fassnacht et al. 1999).
Mao & Schneider (1998) showed that substructures preferentially affect the flux ratios of highly magnified images. In order to reproduce the flux ratios in B1422+231, they found that the required perturbation in the dimensionless surface mass density, , is of a few percent and roughly corresponds to a physical surface density of a few tens . Dalal & Kochanek (2002) performed a statistical study of seven radio lenses using Monte Carlo simulations, six of which show anomalous flux ratios. They find that the fraction of mass required in substructures should be in the range of (90% confidence limit) with a best fit of . More recently, Metcalf et al. (2003) applied the method of Moustakas & Metcalf (2003) to the quadrupole system 2237+0305. They conclude that, in order to match the observed flux ratios in the radio, infrared and narrow and broad emission lines, 4%-7% of the surface mass density (95% confidence limit) must be in substructures with mass between .
3 Predicted Substructures in Numerical Simulations
We use the high resolution halo simulations of Jing & Suto (2002; 2000) to constrain the fraction of mass in substructures; similar results (but with larger error bars) are found using the simulation data obtained with the tree-particle-mesh code of Bode & Ostriker (2003). Twelve halos were selected from a cosmological simulation of box of , with four each at galactic, group, and cluster masses, respectively. These simulations are evolved with a nested-grid PPPM code which was designed to simulate high-resolution halos. The force resolution is typically , where is the virial radius. At the end of each simulation, about particles are within of each halo (see Jing & Suto 2000 for details).
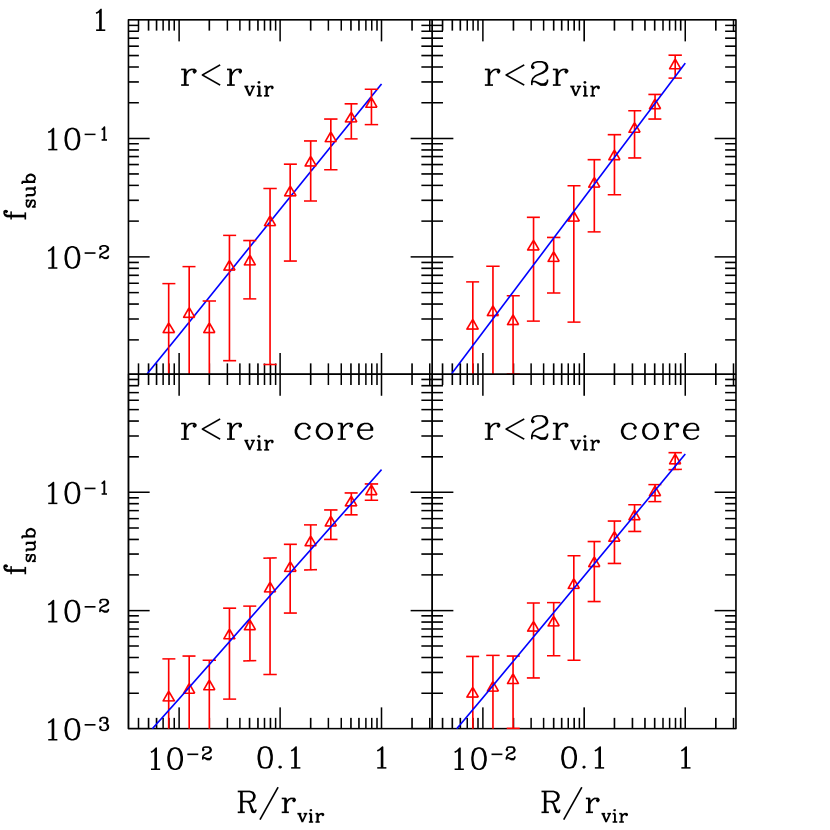
We adopt the SUBFIND routine of Springel et al. (2001) to find disjoint self-bound subhalos within a parent halo. All subhalos with more than 10 particles are included in our analysis. Our numerical resolution implies that we can only identify subhaloes with mass larger than about of the parent halo mass; the most massive subhalo has about of the parent halo mass. For each halo, we make 30 random projections and calculate the total mass within different annuli; the annuli are equally spaced in from to 0 with a step size of 0.2, where is the projected radius and the spherical radius is . The total mass in substructures within an annulus is calculated by summing up all the mass of subhalos whose centers fall in it. Dividing the total substructure mass by the total mass within the annulus yields the fraction of the projected surface density in substructures, . The mean value and variance of are found from the 12 haloes and the 30 random projections. In the upper left panel of Fig. 1, we show as a function of . The mean fraction can be approximated as . The scatter around the mean among haloes is quite large. At , the scatter is about 40%; at smaller the scatter is larger due to fewer subhaloes along the line of sight. As lensing concerns only the projected surface density, we also checked whether substructures outside the spherical virial radius can contribute to the surface density at a given (Fig. 1, top right). The increase is about a factor of two at (cf. Klypin et al. 2001), but more modest () at typical image positions (), consistent with the analytical estimate by Chen et al. (2003).
Almost all subhaloes in the simulation have a spherical radius . Most substructures at typical image positions () only appear along the line of sight due to projection. These subhaloes, especially those at , are extended, thus not all the bound mass within the subhaloes can efficiently cause the flux anomaly (see §4). To illustrate this effect, is recalculated by including only the mass within a spherical radius of for each subhalo. Due to this compactness requirement, at , the average value (for substructures with ) is lowered from 0.8% to 0.6% (see the lower panels in Fig. 1). We return to this compactness issue in the discussion.
To compare the predicted fraction with lensing requirement we need an estimate of the virial radius for the lensing galaxies. If the lens and source redshifts are known, then the separation between images () can be used to determine the velocity dispersion () and the approximate halo circular velocity (), which in turn allows us to determine the halo virial radius (e.g., eqs. 2-3 in Mo, Mao & White 1998). The lens and source redshifts are known for MG0414+0534, B0712+472, B1608+656, B2045+265 and B1555+375. For these systems, the image positions in units of the virial radius are, 0.027, 0.012, 0.018, 0.017 and 0.012, respectively. From Fig. 1 we can then infer the fraction of mass in substructures is only around 0.2-0.8%, with a large scatter among different haloes.
So far we have only considered the fraction of dark matter surface density in substructures. However, the inner parts of galaxies are likely dominated by baryons. To address this issue, we consider the cooling and settling of baryons in an NFW halo (Navarro, Frenk & White 1997), similar to the procedure used by Keeton (2001). Initially the baryons and dark matter follow the same profile. The baryons then cool and condense into the center to form a stellar component with a de Vaucouleurs profile while the dark matter responds to the baryonic settling adiabatically. The model is described by the concentration parameter in the NFW profile, the effective radius () in units of the halo virial radius, and the ratio of the stellar mass to the total mass, (or equivalently, a mass-to-light ratio).
For the five sources with known lens and source redshifts (MG0414+0534, B0712+472, B1608+656, B2045+265 and B1555+375), the effective radii have been determined using HST photometry (Kochanek et al. 2000). In units of the virial radius they are, respectively, 0.018, 0.006, 0.01, 0.006 and 0.005. We take (appropriate for a galactic-sized halo) and then carry out the procedure described above. For the five systems, we find that the stellar component contributes about 20%-50% of the projected surface density at the image positions () for ranging from 0.05 to 0.16 (). The fraction of surface mass density in dark matter is consistent with that required by stellar microlensing ( at 1.5, Schechter & Wambsganss 2003), but at odds with the recent claim of Romanowsky et al. (2003). The effect of baryons hence reduces the the mass fraction in substructures in typical lensing systems to .
4 Discussion
We have reviewed the evidence for substructures from close pairs and triples in quadruple lenses. As emphasized by Kochanek & Dalal (2003), the fact that saddle images are frequently dimmer than expected is difficult to accommodate by other means. Quantitatively, the anomalous flux ratios in lenses appear to require a few percent of the surface mass density in substructures at typical image positions (Dalal & Kochanek 2002; Metcalf et al. 2003). The required fraction is higher than that provided by globular clusters and luminous satellite galaxies (Mao & Schneider 1998; Chiba 2002) and it also appears to be higher than the predicted values () from the cosmology at typical image positions. However, at present it is unclear how serious the discrepancy is because of uncertainties in both observations and theoretical predictions.
There are a number of issues that need to be understood better in current numerical simulations. Even the basic question of the identification of substructures needs to be explored further. The SUBFIND algorithm we adopted only identifies bound subhaloes, however, tidal streams from disrupted systems (for examples in the Milky Way, see, e.g., Ibata et al. 2001; Yanny et al. 2003) may also contribute to the budget of substructures. Another important issue is whether our results have achieved convergence as a function of the spatial and mass resolutions. New simulations are underway to address this issue. Presumably when the numerical resolution becomes higher, the inner parts of subhaloes are resolved better into higher-density regions that can survive tidal disruptions longer. However, the survival of substructures may be linked to another small-scale problem of CDM: the central density profiles of low-surface brightness galaxies (usually with circular velocities of ) seem to be too concentrated compared with observed galaxies (e.g., Bolatto et al. 2002; Weldrake et al. 2003; see, however, Swaters et al. 2003). Therefore, if we put in observed mass profiles, substructures may actually be more easily destroyed by tidal forces due to their lower central concentrations. There is another effect that makes the survival of substructures in the central part more difficult. In collisionless numerical simulations, the density profile can be approximated by an NFW profile; the density scales as out to ( kpc) for typical galactic-sized haloes. However, the observed velocity dispersion is nearly constant in the inner part implying , i.e., the density in real galaxies rises more quickly as the radius decreases. Hence substructures will be disrupted more easily if they come close to the center and dynamical frictions dragging them into the center would also be larger in realistically simulated galaxies.
Our simulations resolve substructure masses from to for a parent halo. However, according to Metcalf et al. (2003), the required substructure mass is in the range of in the case of 2237+0305. If the mass spectrum of substructures extends all the way down to , one can estimate that the fraction of mass in substructures with is about a factor of 3 smaller than that in substructures with , i.e., the mass fraction in substructures in the range required by Metcalf et al. (2003) will be even lower than our predicted value. This conclusion depends on the mass spectrum. However, for any power-law spectrum with a slope shallower than , the mass fraction in substructures with is likely smaller than that in higher-mass substructures identified in numerical simulations.
There is another effect that may reduce the utilizable mass in substructures even further: the need for compactness, an issue we already touched upon in §2 (see Fig. 1). In order to affect the flux ratios significantly, the physical size of substructures must be sufficiently compact (cf. Metcalf et al. 2003). The most efficient substructures should be of the same order of the image separation of the pairs or triples. For the five CLASS quadrupole lenses that have known lens and source redshifts (see §4), the closest pairs have projected separations from kpc (for B1422+231) to kpc (for MG0414+0534). At redshift of 0.5, dark matter haloes with will have kpc, and so they will be efficient in causing flux anomalies if they are located between close pairs or triples. For larger masses, the effect is reduced. We estimate the reduction by assuming that only the mass enclosed within kpc will affect the flux ratios. We adopt a mass spectrum for dark matter haloes of for . Each halo is described by an NFW profile with a concentration parameter given by (e.g., Zhao et al. 2003). Note that the substructures in the central parts are tidally truncated and so cannot be fitted well by NFW profiles, but as most substructures have in spherical radius, the effect of tidal truncation may be modest. We find that the mass in substructures that can efficiently cause flux anomalies is reduced by an additional factor of five compared with the total mass in all substructures – most substructures which are in the outer parts are too extended to cause flux anomalies efficiently. Our rough estimate shows that the compactness requirement is an issue that needs to be addressed more carefully. The two additional effects noted can reduce the likely mass fraction in substructures having the required masses and sizes to as low as , uncomfortably low compared with the observational requirement.
Progress can be made from both the observational and theoretical fronts to reduce the uncertainties. Observationally, in the radio, the effect of scattering can be studied with observations at high frequency where it is expected to be unimportant. In the infrared, it would be interesting to have more observations with integral field spectroscopy similar to that reported by Metcalf et al. (2003). This method offers a way to separate stellar microlensing from substructure milli-lensing. More astrometric signatures of substructures will be important as well (see §2). Theoretically, higher-resolution simulations are needed and are already under-way. If future observations and numerical simulations still indicate a discrepancy between lensing requirements and CDM predictions, then alternatives must be sought. One possibility is that these substructures are massive black holes with (Lacey & Ostriker 1985; Xu & Ostriker 1994), which satisfy the mass and compactness requirements. We require only a few percent of the surface density in the substructures, so the density parameter in these black holes is only , which is about of the baryon density in the universe. These massive black holes will have other observable signatures (e.g., Wambsganss & Paczyński 1992; Tremaine & Ostriker 1999) and can be further tested.
References
- (1) Biggs, A. et al. 2003, MNRAS, submitted
- (2) Bode, P, Ostriker J. P. 2003, ApJS, 145, 1
- (3) Bolatto, A. D., Simon, J. D., Leroy, A., Blitz, L. 2002, ApJ, 565, 238
- (4) Bradac, M., Schneider, P., Steinmetz, M., Lombardi, M., King, L. J., Porcas R. 2002, A&A, 388, 373
- (5) Browne, I.W.A., et al. 2003, MNRAS, 341, 13
- (6) Chen, J., Kravtsov, A.V., Keeton, C. R. 2003, ApJ, 592, 24
- (7) Chiba, M. 2002, ApJ, 565, 17
- (8) Dalal, N., & Kochanek, C. S. 2002, ApJ, 572, 25
- (9) Evans, N. W., & Witt, H. J. 2003, MNRAS, 345, 1351
- (10) Fassnacht, C. D. et al. 1999, AJ, 117, 658
- (11) Ghigna, S., Moore, B. Governato, F., Lake, G., Quinn, T., Stadel, J. 2000, ApJ, 544, 616
- (12) Hewitt, J. N. et al. 1992, AJ, 104, 968
- (13) Ibata, R., Irwin, M., Lewis, G. F., Stolte, A. 2001, ApJ, 547, L133
- (14) Jackson, N. J. et al. 1998, MNRAS, 296, 483
- (15) Jing, Y. P. & Suto Y. 2000, ApJ, 529, L69
- (16) Jing, Y. P. & Suto Y. 2002, ApJ, 574, 538
- (17) Lacey, C. G., & Ostriker, J. P. 1985, ApJ, 299, 633
- (18) Kauffmann, G., White, S. D. M., Guiderdoni, B. 1993, MNRAS, 264, 201
- (19) Keeton, C. R. 2001, ApJ, 561, 46
- (20) Keeton, C. R. 2003, ApJ, 584, 664
- (21) Keeton, C. R., Kochanek, C. S., Seljak, U. 1997, ApJ, 482, 604
- (22) Klypin, A., Kravtsov A. V., Valenzuela O. 1999, ApJ, 522, 82
- (23) Kochanek, C.S. 1991, ApJ, 373, 354
- (24) Kochanek, C.S. et al. 2000, ApJ, 543, 131
- (25) Kochanek, C.S., & Dalal, N. 2002, preprint (astro-ph/0212274)
- (26) Kochanek, C.S., & Dalal, N. 2003, preprint (astro-ph/0302036)
- (27) Koopmans, L. V. E., Fassnacht, C. D. 1999, AJ, 123, 627
- (28) Koopmans, L. V. E. et al. 2002, ApJ, 334, 39
- (29) Koopmans, L. V. E. et al. 2003, ApJ, 595, 712
- (30) Mao, S., Schneider, P. 1998, MNRAS, 295, 587
- (31) Marlow, D. et al. 1999, AJ, 118, 654
- (32) Metcalf, R. B. 2002, 580, 696
- (33) Metcalf, R. B., & Madau, P. 2001, ApJ, 563, 9
- (34) Metcalf, R. B., & Zhao, H.S. 2002, ApJ, 567, L5
- (35) Metcalf, R. B., Moustakas, L. A., Bunker, A. J., Parry, I. R. 2003, astro-ph/0309738
- (36) Mo, H. J., Mao, S., White, S. D. M. 1998, MNRAS, 295, 319
- (37) Moore, B., Ghigna, S., Governato, F. et al. 1999, ApJ, 524, L19
- (38) Moustakas, L.A., & Metcalf R. B. 2003, MNRAS, 339, 607
- (39) Myers, S. T. et al. 1995, ApJ, 447, L5
- (40) Myers, S. T. et al. 2003, MNRAS, 341, 1
- (41) Patnaik, A. R. et al. 1992, MNRAS, 259, 1P
- (42) Patnaik, A. R., & Narasimha, 2001 MNRAS, 326, 1403
- (43) Phillips, P. M. et al. 2000, MNRAS, 319, L7
- (44) Romanowsky, A. J. et al. 2003, astro-ph/0308518
- (45) Navarro, J. F., Frenk, C. S., White, S. D. M. 1997, ApJ, 490, 493
- (46) Schechter, P. L., & Wambsganss J. 2002, ApJ, 580, 685
- (47) Schechter, P. L., & Wambsganss J. 2003, astro-ph/0309163
- (48) Springel, V., White, S. D. M., Tormen, G., & Kauffmann, G. 2001, MNRAS, 328, 726
- (49) Spergel, D.N.S. et al. 2003, ApJS, 148, 175
- (50) Stoehr, F., White, S. D. M., Tormen, G., Springel, V. 2002, MNRAS, 335, L84
- (51) Swaters, R. A., Madore, B. F., van den Bosch, F. C., Balcells, M. 2003, ApJ, 583, 732
- (52) Tremaine, S., & Ostriker, J. P. 1999, MNRAS, 306, 602
- (53) Wambsganss, J., & Paczyński, B. 1992, ApJ, 397, L1
- (54) Weldrake, D. T. F., de Blok, W. J. G., Walter, F. 2003, MNRAS, 340, 12
- (55) Xu, G., & Ostriker, J. P. 1994, ApJ, 437, 184
- (56) Yanny, B. et al. 2003, ApJ, 588, 824
- (57) Zhao, D. H., Jing, Y. P., Mo, H. J., & Boerner G. 2003 ApJ, 597, L9