PAHs and crystalline silicates in the bipolar post-AGB star IRAS 162794757 ††thanks: Based on observations with the European Southern Observatory, 3.6-meter telescope with TIMMI-2 at La Silla. The proposal number is 71.D-0049. ††thanks: Based on observations with ISO, an ESA project with instruments funded by ESA Member States (especially the PI countries: France, Germany, the Netherlands and the United Kingdom) with the participation of ISAS and NASA.
Abstract
IRAS 162794757 belongs to a group of post-AGB stars showing both PAH bands and crystalline silicates. We present mid-infrared images, that resolve the object for the first time. The morphology is similar to that of the ‘Red Rectangle’ (HD 44179), the prototype object with PAHs and crystalline silicates. A two-component model and images suggest a dense oxygen-rich torus, an inner, low-density carbon-rich region and a carbon-rich bipolar outflow. The PAH bands are enhanced at the outflow, while the continuum emission is concentrated towards the center. Our findings support the suggestion that mixed chemistry and morphology are closely related. We discuss the ISO/SWS spectra of IRAS 162794757. Several bands in the ISO/SWS spectrum show a match with anorthite: this would be the first detection of this mineral outside the solar system. Compared to HD 44179, the shapes of PAH bands are closer to those of planetary nebulae, possibly related to a population of small PAHs present HD 44179, but absent around IRAS 162794757. Detailed examination of the spectra shows the individual character of these two objects. The comparison suggests that the torus found in IRAS 162794757 may have formed more recently than that in HD 44179.
1 Introduction
Some post-AGB stars show both PAH and crystalline silicate bands in their infrared spectra. The formation history of this mixed chemistry (oxygen-rich silicates versus carbon-rich PAHs) is not well understood. A possibility, but implausible, is that these stars all evolved from oxygen-rich to carbon-rich within the last few hundred years (Zijlstra et al., 1991). Waters et al. (1998) and Molster et al. (1999) propose that the silicate dust is stored in a long-lived circumbinary disk. In this scenario, the PAHs form during a later mass-loss phase, after the star became carbon-rich, while the gas stored in the disk retains the chemistry of the earlier, oxygen-rich phase. Part of the amorphous silicate dust crystallizes in the disk. The scenario explains why there are relatively few post-AGB stars with this mixed chemistry, and why the silicates have a lower temperature than the carbon rich dust. It requires all such stars to be binaries, as is the case for the prototype of the class, the Red Rectangle (HD 44179; Waelkens et al. (1996)).
IRAS 162794757 (hereafter IRAS 16279) is classified as a post-AGB star, based on a double peak in its spectral energy distribution indicating a detached envelope (van der Veen et al., 1989). Optical spectra suggest a spectral type of G5 (Hu et al., 1993). The ISO/SWS spectra show crystalline silicates beyond 20 m (Molster et al., 1999) and PAH bands are seen in the near-infrared (van der Veen et al., 1989) and ISO spectra. IRAS 16279 is therefore a member of the group of mixed-chemistry post-AGB stars.
We present TIMMI-2 mid-infrared imaging and spectroscopic data, resolving IRAS 16279 for the first time. In this paper we discuss the spatial distribution of the different dust components based on these images, and compare these with predictions from the circumbinary disk scenario. We compare the spectra of this object with those of the prototype mixed-chemistry object, the Red Rectangle.
2 The observations
| Filter | [m] | Flux [Jy] | Error [Jy] | Apt. [arcsec] | |||||
| N7.9 | 7. | 42 – | 8. | 11 | 23. | 4 | 4. | 8 | 4 |
| N8.9 | 8. | 29 – | 9. | 07 | 19. | 5 | 4. | 4 | 4 |
| N9.8 | 9. | 10 – | 10. | 02 | 20. | 0 | 4. | 5 | 4 |
| N10.4 | 9. | 80 – | 10. | 82 | 29. | 0 | 5. | 4 | 4 |
| N11.9 | 10. | 99 – | 12. | 19 | 59. | 8 | 7. | 7 | 6 |
| Q | 17. | 35 – | 18. | 15 | 172. | 12. | 6 | ||
We obtained 10 and 18 m images with TIMMI-2 (Käufl et al., 2000) at the ESO 3.6m telescope on La Silla, on the 27th of May 2003. The weather was clear with occasional cirrus. We used 6 narrow N and Q-band filters (Table 1). The diffraction limit is about 0.7 arcsec (first null) in the N-band and 1.4 arcsec at Q-band. The optical seeing of 0.8–1.1 arcsec in FWHM allowed us to reach the diffraction limit in the images. The pixel scale is 0.2 arcsec. The background was subtracted with nodding and chopping with an offset of 15 arcsec. The pipeline-reduced data were used for imaging. The results from the aperture photometry are given in Table 1. The exposure time is about 16 minutes per image.
We also obtained 10 m spectra with TIMMI-2, taken through a 1.250 arcsec2 slit, oriented North–South. The slit was centered 0.5 arcsec west from the brightest N-band position. The resolution is about 160 in . The background was subtracted with 15 arcsec chop-and-nod. We used eclipse and IDL for the data reduction. The source extends approximately arcsec2, and the spectra are spatially resolved. The pixel scale of 0.45 arcsec per pixel was binned to 0.9 arcsec along the slit to increase the signal-to-noise ratio. The total exposure time is 58 minutes.
The flux calibration, and the response/atmospheric transmission correction in the spectra was derived using HD 169916 (K1III). The spectral template for HD 169916 is calculated by Cohen (1998).
We also use archival ISO/SWS spectra, obtained on 21 August 1997 with a resolution of 250–600. The aperture is 1427 arcsec2 or larger, sufficient to cover the entire source. However, there are several flux discrepancies between the detector bands, probably due to a slight mis-pointing. We scaled the separate ISO/SWS bands (12.45–27.29 m, 27.28–28.90 m, and 28.90–45.38 m) so as to smoothly connect across the bands, and to simultaneously agree with the IRAS broad-band flux levels.
3 Results
3.1 Mid-infrared images
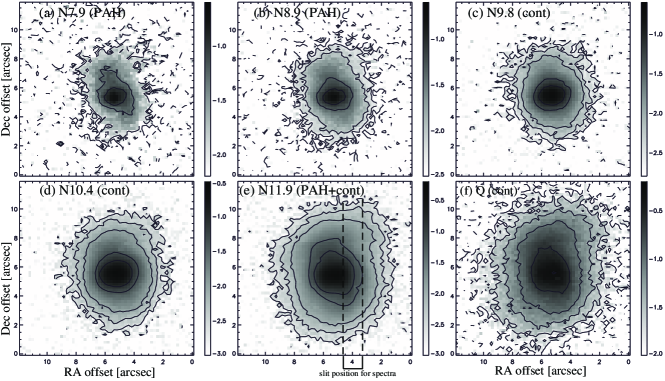
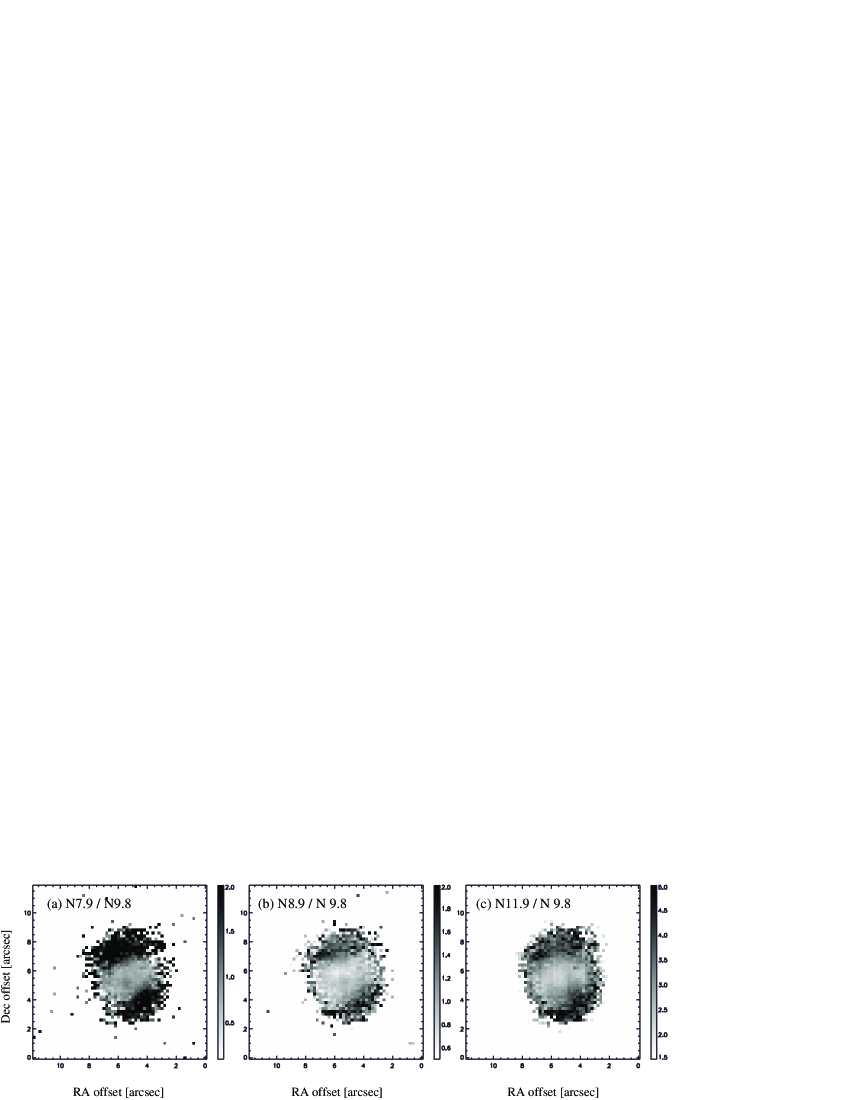
The TIMMI-2 images of IRAS 16279 are shown in Fig. 1. The object is clearly resolved in all images, and more elongated within the PAH bands. This is clearly seen in Fig. 2 in which we compare the intensity profiles of the various filters along the north-south axis with the profiles of a calibration star. To further quantify the spatial variations in the PAH and continuum emission, we show the PAH-to-continuum-ratio (Figs. 3 and 4). The PAH emission is enhanced towards the SW and NE, giving the appearance of bipolarity. At the center, the PAH-to-continuum ratio is low. The elongated PAH emission distribution, and the low PAH/continuum ratio at the center are similar to what is found in the Red Rectangle (Waters et al., 1996).
To confirm that the PAH images are more elongated than the continuum images, we fitted the images with two 2-dimensional Gaussian functions. The first Gaussian component represents the bright core, and the second Gaussian measures the intensity and elongation direction of the faint, extended emission. The peak positions of the two Gaussian profiles are fixed at the same place. The best-fit parameters are summarized in Table 2. The PAH bands (N7.9, N8.9, N11.9) show a relatively stronger second component (larger ratio), confirming the extended appearance in these bands.
The Q-band and N11.9 images (Fig. 1) show a more rectangular shape, slightly elongated both along the SW-NE direction (as found in PAH images) and the SE-NW direction. The rotation angles change from 160 degrees in the 10-m bands, to 75 degrees at 11.9 m, to 10 degrees at 18 m. The Q-band filter contains mainly dust continuum (Sec. 3.3). Although the N11.9 band contains a PAH feature, this contributes only about 1/2–1/3 of the intensity, and the rest is continuum. This rectangular shape might also be present in other continuum images, however, the emission is fainter in the shorter-wavelength continuum bands.

| / | ||||||||||||||||||
|---|---|---|---|---|---|---|---|---|---|---|---|---|---|---|---|---|---|---|
| N7.9 | 1. | 28 | 0. | 84 | 0. | 122 | 152. | 7 | 1. | 79 | 0. | 84 | 0. | 034 | 136. | 9 | 0. | 279 |
| N8.9 | 0. | 66 | 0. | 40 | 0. | 117 | 79. | 5 | 1. | 64 | 1. | 06 | 0. | 056 | 158. | 0 | 0. | 479 |
| N9.8 | 0. | 73 | 0. | 57 | 0. | 163 | 82. | 0 | 1. | 84 | 1. | 35 | 0. | 025 | 166. | 5 | 0. | 153 |
| N10.4 | 0. | 74 | 0. | 58 | 0. | 198 | 81. | 9 | 1. | 67 | 1. | 29 | 0. | 048 | 167. | 3 | 0. | 242 |
| N11.9 | 0. | 69 | 0. | 52 | 0. | 322 | 86. | 0 | 1. | 64 | 1. | 17 | 0. | 135 | 74. | 5 | 0. | 419 |
| Q | 1. | 10 | 0. | 79 | 0. | 266 | 146. | 1 | 2. | 39 | 1. | 73 | 0. | 213 | 8. | 4 | 0. | 801 |

3.2 TIMMI-2 Spectra
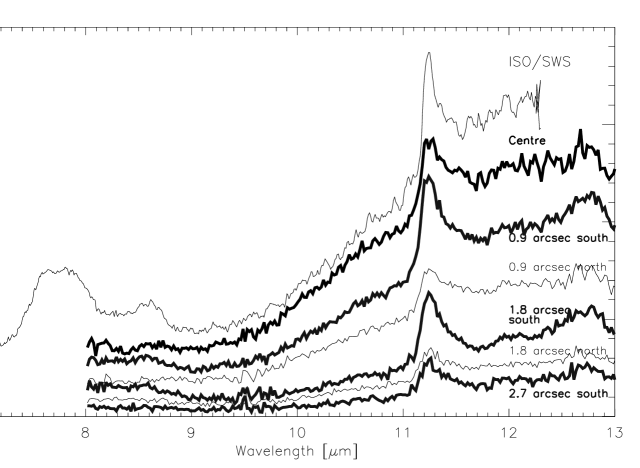
The N-band spectra (Fig. 5) show PAH bands at 7.7, 8.6, and 11.2 m. The weaker 12.7 m PAH band (e.g. Cohen, Tielens, Allamandola, 1985; Hony et al., 2001) is also detected in IRAS 16279. The spatially resolved N-band spectra show that the central spectrum (actually 0.5′′ west of the brightest position) has the strongest continuum, while the strongest 11.2 m PAH band is found 0.9′′ south (see also Fig. 6). The spectrum 0.9′′ north shows only a weak PAH feature. The line-to-continuum ratio is lower at the center than at 0.9′′ south, in agreement with the ratio images displayed in Fig. 3.
3.3 Modeling the ISO/SWS spectra
In order to obtain a globally consistent physical picture of the source we model the ISO/SWS spectrum. We show the full 2.3–45 m spectrum in Fig. 7. Most of the detected energy falls in the infrared range and thus originates from the circumstellar dust. The peak wavelength of the energy distribution (30 m) implies a typical dust temperature of about 100 K. Below 15 m the spectrum is dominate by C-rich material, while beyond 20 m the solid-state features can be attributed to crystalline silicates.
We use a spherically symmetric model consisting of two distinct regions, one containing carbon dust and PAHs, and the other containing silicate dust. The model is described in Siebenmorgen, Krügel (1992), and Siebenmorgen, Zijlstra, Krügel (1994): it is a 1-d model which includes scattering and transient heating. The radiative transfer is solved independently for the carbon-rich and the oxygen-rich region. We do not include the possible effect of the fairly low extinction within the carbon-rich region on the heating of the (outer) oxygen-rich region.
The distance and extinction are derived assuming a luminosity of . The integrated flux (optical to infrared photometry from Hu et al. (1993), Van de Steene et al. (2000), IRAS, and ISO) gives a distance estimate of 2.0 kpc. IRAS 16279 is in the Galactic plane () and will suffer interstellar extinction. The optical photometry is reported as and mag (Hu et al., 1993). For a spectral type of G5 (Hu et al.) we derive mag. Six field stars within 30 arcmin show an interstellar extinction of 1.0 mag kpc-1 out to 1.3 kpc. This suggests an interstellar extinction of 2.0 mag. Most of the large extinction of IRAS 16279 is likely circumstellar origin. Therefore, we ignore the interstellar extinction in the model fit.
Fig. 7 shows the fitted result. Up to 10 m, the emission from carbon material is the dominant source of continuum emission. The oxygen shell begins to contribute at 11 m and is dominant beyond 15 m. The derived parameters (Table 3) show that most of the dust is actually cold oxygen-rich dust: the carbon region is much less dense and contributes little to the mass.
Table 3 shows that the carbon-rich gas is mostly located inside the oxygen-rich region. Both regions have a covering factor (sky coverage as seen form the central star) of about 30–35 %. The precise value depends on the choice of parameters, but all fits we obtained required that the output infrared flux be scaled down by at least half. The derived covering factors and the bipolar morphology in the images suggest that the different dust components may be located in different directions from the star. The model is consistent with an oxygen-rich torus, where we assume that the radial density distribution is the same everywhere within the torus.
The major PAH bands can be reasonably fitted with the model, except for the one at 8.6 m (this problem is also found by Siebenmorgen et al. (1994)). The oxygen shell gives less than half the observed and a weaker-than-observed amorphous silicate absorption feature (seen against the carbon-continuum): the remainder may be due to interstellar absorption, or may be due to geometrical effects. The 10 m absorption is seen mainly against the inner arcsecond, carbon-rich dust. For a shell, the tangential line of sight can have a much higher extinction, and depending on the viewing angle, this can affect the carbon-rich region. The 1-d nature of the model means that self-absorption within the dust regions is not well described. The line of sight to the star also shows higher extinction, but it is clear that a global 1-d model may well underestimate the column density in individual lines of sight.
The carbon rich shell has an outer radius of cm (1.8 arcsec) in the model, which is close to measured in the PAH bands. The inner radius of carbon-rich shell is cm (0.3 arcsec). The inner radius is not clearly seen in the image because the spatial resolution is not high enough and because the point spread functions of the central star and the shell are merged.
The model fitting yields several constraints:
-
(1)
To excite the PAH, the model requires a stellar temperature of 6 000 K or more; otherwise the bands disappear due to lack of exiting photons. This includes absorption by neutral PAHs. The PAH emission features are thought to arise from mixture of neutral and charged PAHs. PAH ions can absorb in the optical (c.f. Li, Draine, 2002) and this would allow a lower stellar temperature. Li, Draine (2002) show that weak PAH bands can be seen for stellar temperatures as low as 3000 K, but reach full strength only above 6000 K. Additionally, the presence of 11.2 m feature, which attributes to neutral PAHs (Hony et al., 2001) suggests that UV radiation is necessary and extremely low temperature is not possible. The observed PAH bands are compatible with a G-type central star.
-
(2)
The PAH bands are only seen in relatively unshielded (low extinction) gas. Within the model, only a low density shell contributes to the PAH bands. Higher density carbon regions, if present, would not contribute to the observed PAH bands: the excitation of the PAHs would be suppressed by internal extinction. We therefore have few constraints on higher density carbon-rich gas.
-
(3)
The oxygen-rich gas is located relatively far out (inner radius of 1 arcsec) and has much higher mass than the carbon-rich gas. The low temperatures of this gas are consistent with the observed crystalline silicate bands (70–110 K; Sect. 4.2).
| C shell | O shell | ||
| [cm] | |||
| [cm] | |||
| [M⊙] | 2.1 | ||
| [mag] | 0.6 | 6.4 | |
| [K] | 330–140 | 125–57 | |
| Coverage | [%] | 30 | 35 |
4 Dust features
The N-band images clearly show that the PAH emission originates from a bipolar geometry. This further strengthens the link between this source and HD 44179, and the link between the mixed chemistry nature and a bipolar (+disk) geometry. It is interesting to further explore the comparison between IRAS 16279 and the Red Rectangle as the prototype of the dual chemistry sources. In the following we will compare the PAH emission features between the two sources, and we present a detailed comparison of the crystalline silicate bands.

4.1 PAH bands
4.1.1 Integrated spectrum
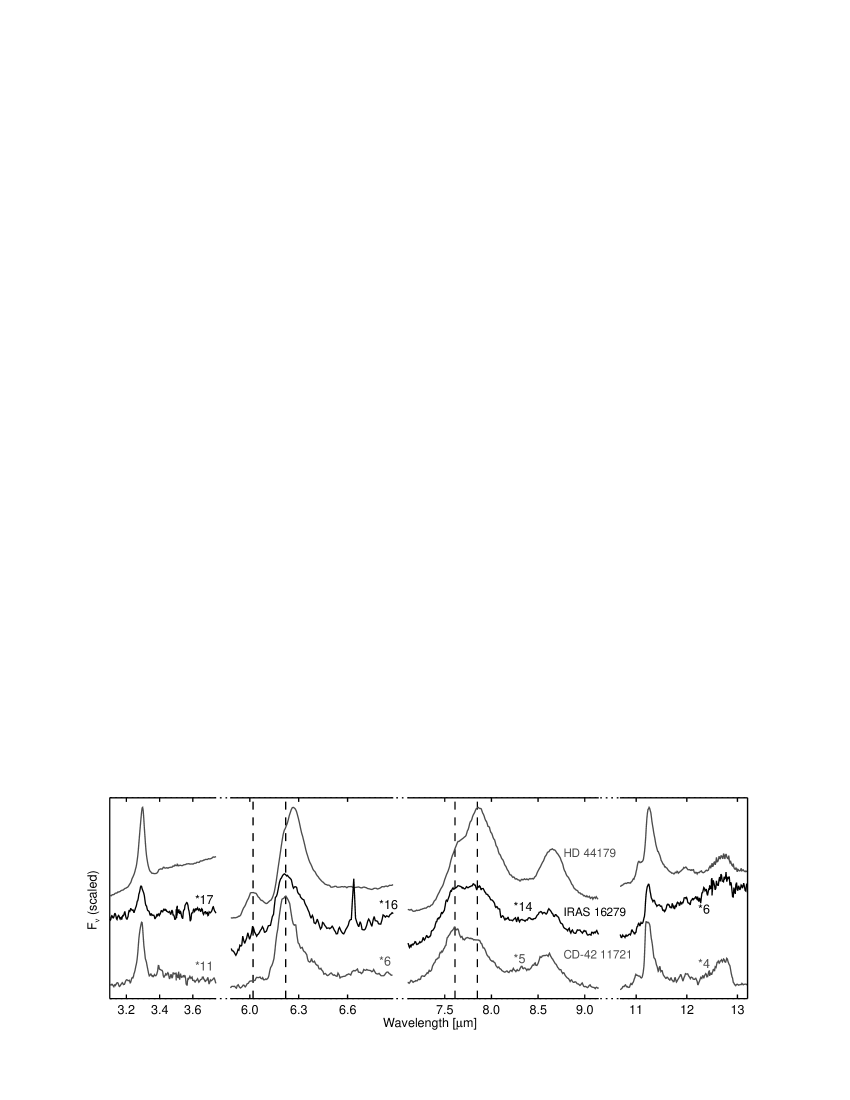
In Fig. 8 we show the ISO PAH spectra of IRAS 16279, HD 44179 as the prototype of the mixed chemistry post-AGB stars and CD-42 11721 as a prototypical ISM/star-forming-region PAH spectrum. The profile features are very similar in the 3 m and the 10 to 13 m region (C–H modes) while large differences are found in the PAH spectrum from 6 to 9 m (C–C modes). This strong variation in the 6 to 9 m PAH bands when compared to the other PAH bands is a common feature of the interstellar PAH spectra (van Diedenhoven et al., 2004). The profiles of the 6–9 m PAH bands of IRAS 16279 are intermediate between HD 44179 and CD-42 11721 (Peeters et al., 2002). The 6.2 m feature of IRAS 16279 is broader than in CD-42 11721. This broadening is due to an extra contribution near 6.05 m which is also present in HD 44179 and a weak emission band which peaks near 6.28 m. The latter band is dominant in the spectrum of HD 44179 while only marginally detected in IRAS 16729, where the usual 6.22 m band is the strongest.
The PAH bands from 7 to 9 m (regularly dubbed the “7.7 complex”) also attest to the intermediate nature of IRAS 16279 PAH emitters. In the ISM and in star-forming regions, usually the 7.6 m band is dominant, while in planetary nebulae and post-AGB stars the 7.8 m band is strongest (Bregman, 1989; Cohen et al., 1989; Peeters et al., 2002). In IRAS 16279 both bands are roughly equally strong.
Hony et al. (2001) found that the band strength ratio of the 11.2 to 12.7 m bands ( where and represent the integrated flux of each band) correlates with the source type. In the planetary nebulae this ratio is very high as is the case for HD 44179 (=5.0). The band strength ratio found in IRAS 16279 (=2.0) is not typical for evolved stars.
When comparing the band strength of the 3.3 m band with the longer wavelength PAH bands we find that the 3.3 m of IRAS 16279 is much weaker than in HD 44179. The ratios of the integrated band strengths, , are 1.9, 5.2 and 3.9 in HD 44179, IRAS 16279, CD-42 11721 respectively. The ratios of IRAS 16279 are closer to CD-42 11721. This may point to a population of smaller PAHs around HD 44179 which does not exist around the other two sources. Such small PAHs might be easily destroyed when exposed to the hard UV radiation present in the ISM and planetary nebulae.
4.1.2 Spatially resolved spectroscopy
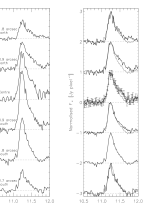
In Fig. 6 we show the profile of the 11.2 m band as extracted from the N-band spectra for different positions. On the right we compare the normalized profiles. The profile varies with the position along the slit, being broader at the central position and 0.9′′ north. A longer tail at 11.5 m is usually interpreted as being due to hotter PAHs (Tielens et al., 1999; Pech, Joblin, Boissel, 2002). Alternatively, a different profile might arise from a variation of the PAH population as a function of distance to the source. For example, PAHs with two neighboring C–H bonds may give rise to emission in the red wing of the 11.2 m solo C–H mode (Hony et al., 2001). We prefer the hot PAH interpretation, because of the fact that the sharp blue-side rise stays the same in the all spectra, which is difficult to envisage in the scenario of a strongly varying PAH population. Furthermore, the most pronounced tail is found closest to the central star, where multiple photon heating may play a rôle and therefore hotter PAHs might be expected.
Miyata et al. (2001) show spatially resolved N band spectra of HD 44179 in which they also find variations of the emission features as a function of distance to the star. Like in IRAS 16279 the 11.2 m band diminishes close to the central star. However, unlike in IRAS 16279, the HD 44179 spectrum near the central star is dominated by bands at 11.0 and 11.9 m. These bands could be related to the crystalline enstatite that is present in the disk. Due to this possible confusion between the different contributors to the emission in HD 44179 it is not feasible to determine the band profile of the 11.2 m nearest the central star.
Concluding, we can state that there are significant differences in the PAH spectrum of HD 44179 and IRAS 16279, both in band strength ratios and profile features, where the latter source exhibits an PAH spectrum intermediate between HD 44179 and the prototypical ISM PAH spectrum. In this sense the PAH spectrum of IRAS 16279 compares better, in bands strengths and feature profiles, with the young C-rich planetary nebulae IRAS 21282+5050 (Hony et al., 2001; Peeters et al., 2002).
4.2 Crystalline silicate bands
The ISO/SWS spectra beyond 20 m show the solid state features which are attributed to crystalline silicates (Fig. 7). Continuum subtracted spectra are shown in Fig. 9. The continuum is obtained with a quadratic fit (polynomial fit to the three neighboring points) to the smoothed spectra.
The feature at 33.7 m has been identified with crystalline olivine (Mg2xFe2-2xSiO4, with between 0 and 1). Its position fits best with that of the pure Mg-olivine, i.e. forsterite (Mg2SiO4) (Waters et al., 1996; Molster et al., 2002a). The band ratio depends on the temperature (Molster, 2000, chap. 1). The absence of a feature around 23.7 m shows that forsterite is below 100 K. The plateau up to 37 m, which has no clear mineralogical identification, is prominent in this star.
The feature at 40.5 m is normally attributed to pyroxene-like silicates (MeSiO3, where Me stands for metal). The presence of features also around 43 m is normally an indication for the presence of enstatite (MgSiO3). However, the lack of enstatite features below 30 m makes this identification questionable. The ISO/SWS band 3E (27.5–29 m) is known for its mediocre performance. This could be the reason for the lack of enstatite features around 28 m. Alternatively, enstatite can also simply be very cold just like the forsterite. Whatever the reason is, it should be noted that the 40.5 m feature is rather strong with respect to the 43 m feature if it is purely due to enstatite. This implies that more materials might be present.
There are some other features present around 26, 29 and 32 m. These three positions together with the 40.5 m feature could fit with the features of diopside (CaMgSi2O6) measured in the laboratory (Koike et al., 2000). The slight wavelength shift around 26 and 40.5 m with respect to the laboratory, and, in addition, the lack of a clear feature around 21 m makes the identification less conclusive. But these differences might be explained by temperature and grain size and shape effects as is also observed for other silicates, like forsterite (Bowey et al., 2002; Molster et al., 2002a, b).
Another mineral that might explain some of the features is anorthite. Properties of anorthite have been measured in the laboratory (Chihara et al., 2003; Keller et al., 2003). The profile presented in Fig. 9 is for a sample of An96 in Chihara et al. (2003). It matches with the feature at 26 m, the long wavelength side of the 40 m complex and the extra feature just before the 33.7 m forsterite feature. This would be the first identification of anorthite outside the solar system. The lack of anorthite features in the ISO-spectrum around 18 m might be explained by low temperature, or interstellar absorption.
We would require future spectra beyond 45 m to confirm the presence of anorthite and diopside, which have stronger bands in these wavelength. We should also stress here that we are dealing with an artificial continuum and this can have some influence on the strength of the features.

5 Discussion
The mid-infrared images of IRAS 16279 show an elongation in the PAH band and a rectangular shape in the N11.9 and Q-band images. At the center, the PAH-to-continuum ratio decreases. There is some resemblance to the Red Rectangle (HD 44179) (Waters et al., 1998). In the Red Rectangle, the silicates are thought to be located in a disk and the PAHs are in the perpendicular polar flows. The images of IRAS 16279 strengthen this link between morphology and mixed chemistry as proposed by Waters et al. (1996) and Molster et al. (1999).
The temperature of the crystalline silicate bands in HD 44179 is about 135 K (enstatite; Molster et al. (2002b)), while it is below 110 K in IRAS 16279. Nevertheless, both objects show a lower temperature in the silicates than in the PAH region. In fact, all crystalline silicates in post-AGB stars tend to show low temperatures (100–250 K) (Molster et al., 2002b).
In the case of IRAS 16279, the model suggests that the PAH emission in the SW and NE regions (Fig.1) cannot be shielded by the dusty oxygen-rich regions. The oxygen-rich material should be configured as an torus rather than a shell, allows radiation to leak towards the SW and NE directions. The model explains the PAH excess at 2 arcsec: the decreasing temperature suppresses the continuum but not the PAH bands.
This structure, with a low-density carbon-rich region and an obscured, dense oxygen-rich torus, agrees with the (Red Rectangle) oxygen-rich-disk scenario of Waters et al. and Molster et al. But the oxygen-rich region in IRAS 16279 is several times larger than seen in the Red Rectangle. A circumbinary disk is expected to be compact in order to store the oxygen-rich gas over a long time. It is not clear whether this has happened in IRAS 16279. The extended torus should disrupt faster than the disk of the Red Rectangle. Its formation may have happened relatively recent.
The crystallization of amorphous silicates occurs via heating and subsequent cooling of the grain. This may occur slowly at low temperature in a long-term stable disk, under the influence of UV radiation (as in the Red Rectangle), or quickly in the AGB wind at very high mass-loss rates, through high temperature annealing (Waters et al., 1996; Sylvester et al., 1999). Assuming an expansion velocity of 20 km s-1, the mass-loss rate of IRAS 16279 was of order , sufficient for high temperature annealing in the outflow to occur. Therefore, crystallization itself may occurred already in the AGB outflow. Part of the crystallized silicate is stored in the disk later, and part of it may remain in the outflow.
It is not clear that the torus is stable long enough for long-term crystallization. This may be solved by shocks addressed by Harker, Desch (2002) who found a 5 km s-1 shock is sufficient for annealing comets. This velocity range might be possible in AGB or post-AGB wind interaction with the torus. In this case, the higher density of the torus is more likely to obtain a higher rate of crystallization, and this may compensate the short life of the torus than the disk.
The crystalline silicate bands in IRAS 16279 are significantly weaker than in the HD 44179 (Waters et al., 1998). The weakness of the features indicate that either they are less abundant than in HD 44179, or the temperature difference with the hotter amorphous silicates (responsible for the continuum) is larger in IRAS 16279. Although a difference in abundance can clearly not be excluded, the low temperature of the crystalline silicates seems to be supported by the absence of detectable features below 30 m.
References
- Bowey et al. (2002) Bowey, J.E., Barlow, M.J., Molster, F.J., et al. 2002, MNRAS, 331, L1
- Bregman (1989) Bregman, J. 1989, in IAU Symp. 135, Interstellar Dust, ed. L.J. Allamandola, & A.G.G.M. Tielens, Kluwer Academic Publishers, Dordrecht, p.109
- Brucato et al. (1999) Brucato J.R., Colangeli L., Mennella V., Palumbo P. & Bussoletti E. A&A 1999, 348, 1012
- Chihara et al. (2003) Chihara H., Koike, C., Tsuchiyama, A., in preparation
- Cohen (1985) Cohen, M., Tielens, A.G.G.M., Allamandola, L. J. 1985, ApJ 299, L93
- Cohen (1998) Cohen M. 1998, AJ 115, 2092
- Cohen et al. (1989) Cohen, M., Tielens, A.G.G.M., Bregman, J. et al., 1989, ApJ, 341, 246
- Harker, Desch (2002) Harker, D.E., Desch, S.J., 2002, ApJ 565, L109
- Hony et al. (2001) Hony, S., Van Kerckhoven, C., Peeters, E., Tielens, A.G.G.M., Hudgins, D.M., Allamandola, L.J. 2001, A&A 370, 1030
- Hu et al. (1993) Hu, J.Y., Slijkhuis, S., de Jong, T., Jiang, B.W. 1993, A&AS 100, 413
- Hu et al. (1994) Hu, J.Y., Te Lintel Hekkert, P., Slijkhuis, F., Baas, F., Sahai, R., Wood, P. R. 1994, A&AS 103, 301
- Jura et al. (1995) Jura, M., Balm, S.P., Kahane, C., 1995, ApJ 453, 721
- Käufl et al. (2000) Käufl, H. U., Ageorges, N., Dietzsch, E., et al. 2000, The Messenger, ESO, 102, 4
- Keller et al. (2003) Keller L., in preparation
- Koike et al. (1999) Koike, C., Shibai, H., Suto, H. et al. 1999 in Proceedings of the 32nd ISAS Lunar and Planetary Symposium 32, p175
- Koike et al. (2000) Koike, C.; Tsuchiyama, A., Shibai, H., et al. 2000, A&A, 363, 1115
- Li, Draine (2002) Li, A., Draine, B. T. 2002, ApJ 572, 232
- Miyata et al. (2001) Miyata, T., Kataza, H., Okamoto, Y., et al., 2001, in Post-AGB Objects as a Phase of Stellar Evolution, ed. R. Szczerba & S. K. Górny, Astrophysics and Space Science Library, 265, 351
- Molster et al. (1999) Molster, F.J., Yamamura, I., Waters, L.B.F.M. et al. 1999, Nature 401, 563
- Molster (2000) Molster, F.J., PhD thesis, 2000, University of Amsterdam
- Molster et al. (2002a) Molster, F.J., Waters, L.B.F.M., Tielens, A.G.G.M. 2002a, A&A 382, 222
- Molster et al. (2002b) Molster, F.J., Waters, L.B.F.M., Tielens, A.G.G.M., Koike, C., Chihara, H. 2002b, A&A 382, 241
- Pech et al. (2002) Pech, C., Joblin, C., Boissel, P. 2002, A&A 388, 639
- Peeters et al. (2002) Peeters, E., Hony, S., Van Kerckhoven, C., Tielens, A.G.G.M., Allamandola, L.J., Hudgins, D.M., Bauschlicher, C.W. 2002, A&A 390, 1089
- Siebenmorgen, Krügel (1992) Siebenmorgen, R., Krügel, E. 1992, A&A 259, 614
- Siebenmorgen et al. (1994) Siebenmorgen, R., Zijlstra, A.A., Krügel, E. 1994, MNRAS 271, 449
- Sylvester et al. (1999) Sylvester, R.J., Kemper, F., Barlow, M.J., de Jong, T., Waters, L.B.F.M., Tielens, A.G.G.M., Omont, A. 1999, A&A 352, 587
- Thompson et al. (2002) Thompson S. P., Fonti S., Verrienti C., Blanco A., Orofino V., & Tang C. C. A&A 2002, 395, 705
- Tielens et al. (1999) Tielens, A.G.G.M., Hony, S., van Kerckhoven, C., Peeters, E., 1999, ‘The Universe as Seen by ISO’, ed. P. Cox & M. F. Kessler, ESA-SP 427, p579
- van Diedenhoven et al. (2004) van Diedenhoven et al., 2004, A&A in preparation
- van der Veen et al. (1989) van der Veen, W.E.C.J., Habing, H. J., Geballe, T. R. 1989, A&A 226, 108
- Van de Steene et al. (2000) Van de Steene, G.C., van Hoof, P.A.M., Wood, P.R. 2000, A&A 362, 984
- Waters et al. (1996) Waters, L.B.F.M., Molster, F.J., de Jong, T., et al. 1996, A&A 315, L361
- Waters et al. (1998) Waters, L.B.F.M., Cami, J., de Jong, T., et al. 1998, Nature 391, 868
- Waelkens et al. (1996) Waelkens, C., Van Winckel, H., Waters, L.B.F.M., Bakker, E.J. 1996, A&A 314, L17
- Zijlstra et al. (1991) Zijlstra A.A., Gaylard M.J., te Lintel Hekkert, P., Menzies, J.W., Nyman, L.-A., Schwarz, H. E., 1991, A&A, 243, L9