Methanol: a diagnostic tool for high-mass star-forming regions
1 Introduction
Kinetic temperature and density are fundamental parameters for our
understanding of the interstellar medium (ISM).
Usually, symmetric rotors such as NH3 are used
to probe a cloud’s kinetic temperature, while linear molecules, e.g.
CS, probe its density. However, different spatial distributions of
the tracers (“chemistry”) often complicate the picture
(see, e.g., tafalla )
as they often trace physically different
and spatially non-coexisting gas components. It is thus desirable to
trace all relevant physical parameters with a single molecule.
Promising candidates exist among slightly asymmetric rotors, which
have properties qualifying them as tracers for physical conditions.
Methanol, CH3OH, is a slightly asymmetric rotor. It is
ubiquitous and associated with different regimes of star formation,
from quiescent, cold ( K), dark clouds,
to “hot core” sources near high-mass (proto)stellar objects, where
[CH3OH/H2]
values are observed menten .
Up to now an extremely poor knowledge of the CH3OH
collisional rates and of their propensity rules has prevented
realistic systematic studies exploiting methanol’s full potential as
an interstellar tracer. Recently, this situation has changed with the
calculation of collisional rate coefficients by
pottage1 ; pottage2 , for collisions with helium, for both
CH3OH- and CH3OH-, for levels up to
.
Here we would like to focus on general aspects connected to the analysis
of complex molecules’ spectra, of which CH3OH is one of the simplest examples,
(for details on
methanol excitation and on its probing properties see leurini ).
2 Analysis technique
The traditional approach for deriving physical parameters such as
kinetic temperature and spatial density from an observed spectrum
involves “by-hand” fitting of the lines with multiple components and
2 analysis comparing the measured quantities with statistical
equilibrium calculations.
However, this single line fitting procedure is extremely
time-consuming and suffers from several drawbacks.
With sensitive receivers nowadays
available and in view of the next generation of instruments, which will
provide copious amounts of data in a short time, new methods of data analysig
and modelling are required.
An innovative technique to handle the problem, proposed by
schilke and recently improved by comito ,
is based on the simultaneous fit of the complete spectrum with a
synthetic spectrum computed under Local Thermodynamic Equilibrium
(LTE) conditions. Here we propose an extension to this technique using
the Large Velocity Gragient (LVG) approximation, which ensures more reliable results when
prominent departures from LTE are expected.
The free parameters
for each component are excitation temperature, molecular hydrogen
density, source size, column densities for A and E states, which are
treated as two independent parameters to take into account
their possibly different abundance.
Line width and LSR velocity are fixed parameters
and assumed to be the same for all the lines in each component.
Within a component,
the optical depths for lines with a frequency separation
are summed up to include local line overlap between both symmetry states.
Line identification is based on the Cologne Database for Molecular
Spectroscopy,
(http://www.cdms.de muller ), which includes new measurements
by xu .
Although the simultaneous fit of a spectrum has been demonstrated to
be a powerful technique of analysis
comito , it does imply several approximations.
The assumption behind the analysis is that the CH3OH distribution can be reasonably
well approximated by a small number of non-interacting
components, thus ignoring any structure in the source.
The LVG approach adds other uncertainties to the obtained results, since it assumes
only one set of physical parameters for the source and implicitly
neglects any local and non-local overlap between the lines.
Also, fitting CH3OH spectra assures a
reliable determination of kinetic temperature only when a large
amount of lines are fitted and/or when millimeter and submillimeter
data are combined, since CH3OH shows a strong dependence
on temperature mainly in the
submillimeter range leurini .
Another drawback is the uniqueness
of the 2 minimization, which is not a priori
guaranteed. Indeed the fit results occasionally depend on the
input parameters: an analysis of the 2 distribution is therefore
necessary to verify that the found minimum is global.
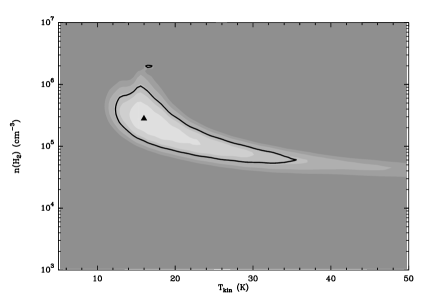
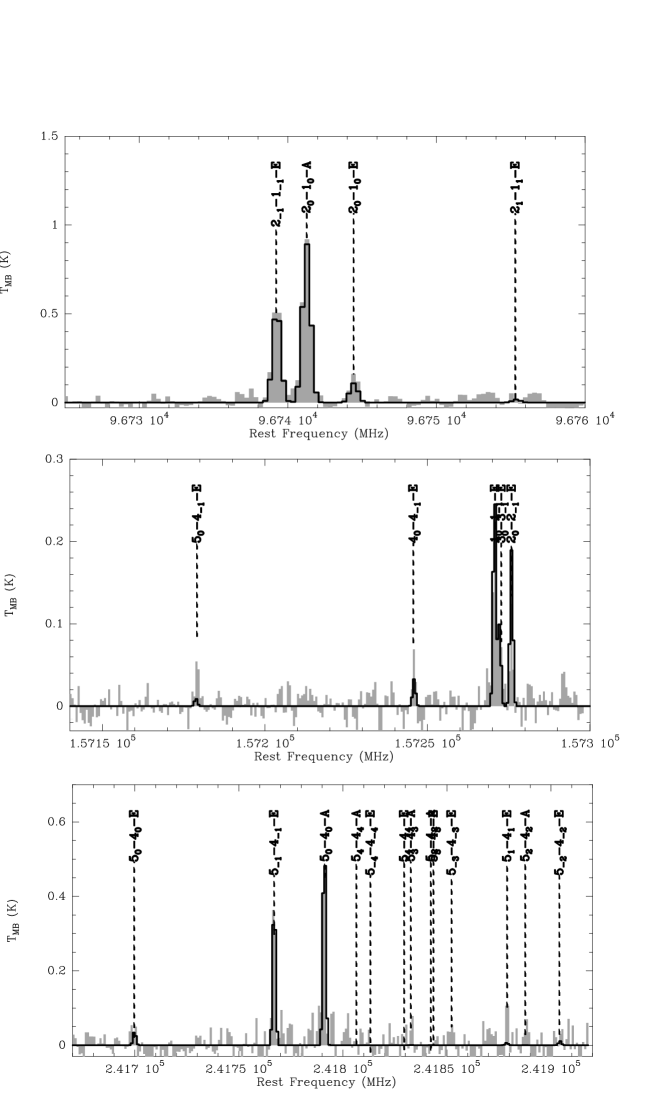
Having all these limitations in mind, the application of this technique to
G79.3P1, an infrared-dark cloud,
gives very satisfying results, (Fig. 2).
Table 1 lists the best fit results
and the fit range. The source size, ,
is based on a BIMA map of
CH3OH at 3mm, (Wyrowski, priv. comm.).
Fig. 1 shows the distribution in the [Tkin,n(H2)] plane,
with the 3 confidence surface in black.
| best fit | 3 fit range | |
|---|---|---|
| TK | 17 K | 12–37 K |
| n(H2) | 2.5 105(cm | 3 – 4 (cm |
| N(CH3OH-A) | 7.9 1013 (cm | 6 –1 (cm |
| N(CH3OH-E) | 5.7 1013 (cm | 3 –8 (cm |
References
- (1) C. Comito: Exploring the submillimeter sky: molecular line studies at 350 m. PhD Thesis, Rheinische Friedrich-Wilhelms Universität, Bonn (2003)
- (2) S. Leurini, P. Schilke, K. M. Menten et al: in preparation
- (3) K. M. Menten, C. M. Walmsley, C. Henkel et al: AA 157, 318 (1986)
- (4) H. S. P. Müller, S. Thorwirth, D. A Roth et al: AA 370, L49 (2001)
- (5) J.T. Pottage, D. R. Flower and S. L Davis: J. Phys. B: At. Mol. Phys. 34, 3313 (2001)
- (6) J.T. Pottage, D. R. Flower and S. L Davis: J. Phys. B: At. Mol. Phys. 35, 2541 (2002)
- (7) P. Schilke, T. G. Phillips and D. M. Mehringer. In: The Physics and Chemistry of the Interstellar Medium, ed by V. Ossenkopf, J. Stutzki, and G. Winnewisser (GCA-Verlag Herdecke, 1999) pp 330-337
- (8) M. Tafalla, P.C. Myers, P. Caselli, P. et al: ApJ. 569, 815 (2002)
- (9) L.-H Xu and F. L. Lovas: J. Phys. Chem. Ref. Data 26, 17 (1997)