Cosmology and the Stellar Halo
Abstract
If the favored hierarchical cosmological model is correct, then the Milky Way system should have accreted and subsequently tidally destroyed low-mass galaxies in the past Gyr. We model this process using a hybrid semi-analytic plus N-body approach and show that the disrupted systems lead naturally to stellar halos with masses and density profiles much like the stellar halo of our own Galaxy. We present predictions for the properties of stellar halos and show that ours is likely dominated by substructure beyond kpc and more spatially smooth within that radius. The average stellar halo density profile is expected to drop off with radius more quickly than that of the dark matter because the stellar halo is formed from the most tightly bound material in infalling systems, while the majority of the accreted dark matter is stripped and deposited at larger radii. We argue that stars associated with the inner halo should be quite different chemically from stars in surviving satellites and also different from stars in the outer halo or those liberated in recent disruption events. We discuss how deep halo surveys and chemical probes may be useful tools for uncovering evidence of accretion. Searches of this kind offer a direct test of whether cosmology is indeed hierarchical on small scales.
Harvard-Smithsonian Center for Astrophysics, 60 Garden St. MS 51,
Cambridge, MA 02138, USA; jbullock@cfa.harvard.edu
1 Hubble Fellow
Van Vleck Observatory, Wesleyan University, Middletown, CT 06459-0123, USA; kvj@astro.wesleyan.edu
1. Introduction
The LCDM model of structure formation predicts that the dark matter halos of galaxies like the Milky Way were formed by the continual accretion of lower-mass systems. While some fraction of the accreted dark halos are expected to survive as subhalos, most of the extended dark halo is built up from merging systems that are tidally destroyed (Zentner & Bullock 2003). Similarly, if the accreted systems contain dissipationless stars, e.g. in the form of a dwarf galaxy, then this process leads naturally to the formation of an extended stellar halo. The LCDM expectation for the formation of the stellar halo is reminiscent of the Searle & Zinn (1978) scenario of chaotic accretion, and has the positive feature that the expected accretion history is well-known theoretically, at least for the dark matter. In this contribution we describe efforts to model the formation of the stellar halo in the context LCDM cosmology using a set of idealized N-body simulations. We make predictions for the abundance of stellar halo substructure as a function of radius and argue that deep probes of the stellar halo offer a unique test of the hierarchical nature of structure formation on small scales.
Modeling the stellar halo from a cosmological context is non-trivial. Fully self-consistent cosmological simulations allow the dark matter dynamics to be followed in detail, but even simulations of millions of particles will only have a few thousand particles in the very largest satellites (e.g. Helmi, White, & Springel 2002). Moreover, such simulations are computationally intensive and hence prohibit examining more than a handful of halos. Analytic or semi-analytic approaches (e.g. Bullock et al. 2001, Johnston, Sackett & Bullock 2001) allow the production of many halos, but only approximate the dynamics.
In this study we take a hybrid approach, and use accretion histories generated semi-analytically within a cosmological model to inform us of the luminosity, mass and accretion times of satellites, as well as the instantaneous mass of the parent galaxy. An N-body simulation for each accreted satellite is then run within an analytic model for the parent. This approach allows a vast decrease in the necessary computing time, while at the same time allows us to follow the dynamics in detail. Our approach is limited in its ability to correctly follow major mergers, so our model results are most accurate for the outer halo (kpc). The inner halo formed early on (Gyr ago) during a period of rapid mass accretion when major mergers were common. In addition, the detailed phase-space structure of the inner halo was likely influenced by the formation process of the Galaxy itself, which is rather poorly understood. For this reason we focus mostly on the outer halo, which should have formed from more recently-accreted systems (Gyr). Fortunately, the vast majority of expected stellar substructure comes from accretion events that occurred late, after the last merger event.
We describe the method more fully in §2 and our results and conclusions in §3. In what follows we assume an LCDM cosmology with , , , and . A more thorough presentation of this work will be given elsewhere (Johnston & Bullock; Bullock & Johnston, in preparation).
2. Methods
2.1. Cosmological Context and Semi-Analytic Star Formation
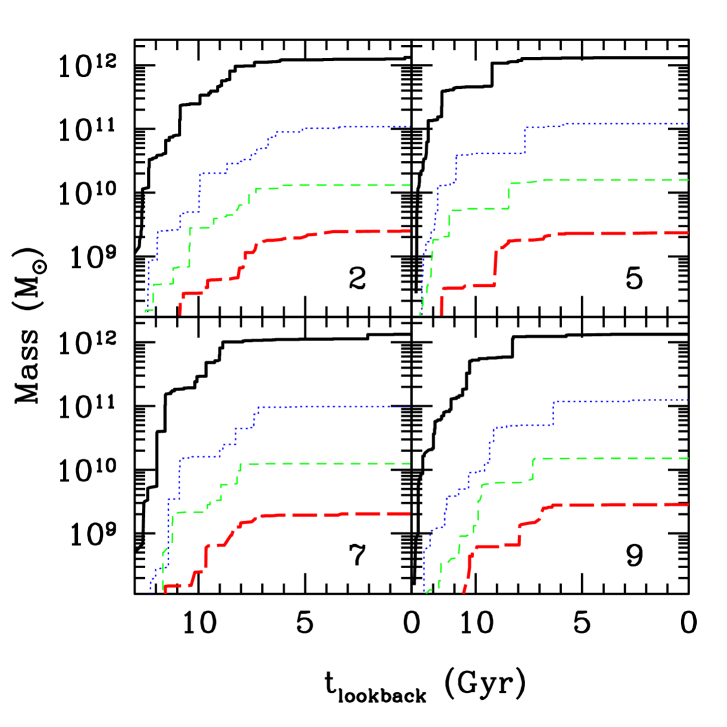
We set the mass accretion and subhalo accretion histories of our host halos using Extended-Press-Schechter (e.g. Lacey & Cole 1993) and employ the merger tree algorithm proposed by Somerville & Kolatt (1999). This allows us to generate mass accretion histories of our host halos as a function of time, as shown in Figure 1 for four example realizations (upper solid lines). We demand that the hosts at have a mass of . The merger tree also provides a list of the masses, , and accretion redshifts, , of all subhalos that merge to form the host halo.
Assigning luminosities and stellar masses to each accreted dark matter halo is a fundamental step in any attempt to model the stellar halo in this context. We do so by modeling star formation in each system based on an estimate for its total mass in cold gas: , where is the star formation timescale. For massive systems, the mass in cold gas accreted in a given time is proportional to the dark matter mass accreted: . Here is the baryon fraction, and parameterizes the amount of hot gas that might arise from inefficient cooling and feedback. For low-mass systems (s-1), we solve the dwarf satellite problem (e.g. Klypin et al. 1999) following the suggestion of Bullock, Kravtsov & Weinberg (2000), and assume that the total amount of gas available to form stars is proportional to the mass in place at the epoch of reionization . Remarkably, we find that the choices Gyr and allow us to roughly reproduce the main characteristics of our Galaxy, including the stellar halo, disk, and bulge masses, as well as the observed star formation rates and gas mass fractions of isolated dwarf galaxies and Local Group irregulars (see Johnston & Bullock, in preparation).
Crucial in this agreement is the rather long star formation timescale we have assumed for low-mass systems, Gyr. This means that systems that are accreted early tend to have high gas mass fractions, and contribute more to the main galaxy than the to stellar halo. Indeed, the observed ongoing star formation in many dwarf galaxies effectively demands that the star formation timescales must be long, at least in an average sense (e.g. Grebel 2001). The star formation timescale is likely shorter in larger-mass systems like the Milky Way host, perhaps because the gas can reach higher densities and feedback effects are less important in stabilizing the star formation. Figure 1 shows the expected evolution of the disk, bulge, and stellar halo components for four example accretion histories (dotted, dashed, and thick-dashed from top to bottom in each panel). We have associated mass accreted in hot gas with disk material, cold gas associated with disrupted satellites as bulge material, and unbound stellar mass as stellar halo material. While the disk mass and bulge mass build-up presented in this figure is somewhat dependent on our assumptions about gas infall, the general feasibility of our picture for how galaxies like the Milky Way were assembled is clear. We go on to use this simple semi-analytic model to generate the input conditions for our more detailed numerical modeling.
2.2. The parent galaxy
The potential of the parent galaxy is represented by three analytic functions, corresponding to bulge, disk, and halo components. The first two are held at fixed mass and scale. For the halo, we use a spherical NFW (Navarro, Frenk & White, 1996) model that grows in mass and scale according to the smoothed accretion history of the parent galaxy, described above. We do so following the prescription developed by Wechsler et al (2002) to fit fully self-consistent N-body simulations.
2.3. The satellite galaxies
We find that over course of its history, each Milky-Way-type halo accretes luminous satellites. We simulate the orbital evolution of each satellite once accreted using 105 particles, initially distributed as an NFW profile with mass, scale and accretion time taken from the semi-analytically generated accretion history. The orbits of the satellites are chosen at random so that the distribution of final orbits matches that measured by Ghigna et al (1998) at the end point of a cosmological N-body simulation. The self-gravity of the satellite is calculated using a basis-function-expansion code (Hernquist & Ostriker 1992) and the influence of the parent is imposed from the analytic functions described above. In addition, all particles within two tidal radii of the satellite feel a drag force due to dynamical friction, calculated as suggested by Hashimoto, Funato & Makino’s (2003) simulations.
The total mass in luminous matter in the satellites is assigned based on the star formation algorithm described above (gas mass is ignored for now.) Based on its luminosity, we assign each satellite galaxy a King density profile, with a core radius set to match the distribution of scales observed in local dwarf galaxies (Dekel & Woo, 2003). We assign a luminosity to every particle based on its energy at the time of accretion. We do so using Eddington’s formula (Binney & Tremaine 1982) for the appropriate King profile embedded within an equilibrium NFW halo. The key element here is that the star particles tend to be much more tightly bound than than most of the dark matter in the infalling satellite halos.
3. Preliminary Results
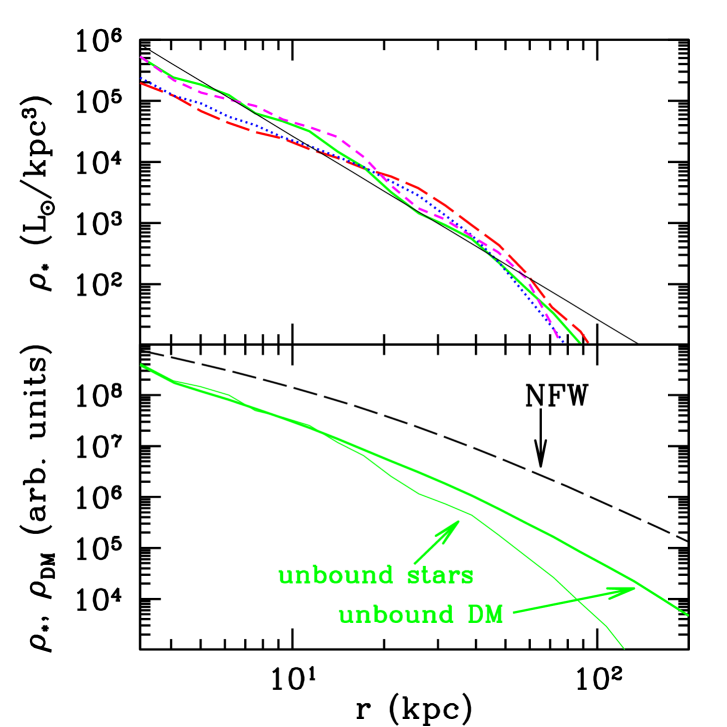
As shown by the thick dashed lines in Figure 1, the total stellar halo mass at in our model matches well what is expected for our Galaxy, , with the total value varying from galaxy-to-galaxy by a factor of . The top panel of Figure 2 shows the resulting stellar halo profiles derived from our simulations for four example halos (four thick lines, see caption). The thin line, for reference, shows an power law. Rough agreement with the expected power-law is evident, although we do predict a steep fall-off beyond kpc. Some understanding of this steepening can be gained from the lower panel of Figure 2, which shows our derived stellar halo profile along with the profile of all of the unbound dark matter mass in our simulations. We see that the stellar profile falls off more quickly at large radii because the star particles tended to sample the most tightly-bound cores of the infalling halos. It is those cores that tend to survive deep into the halo core before becoming disrupted.
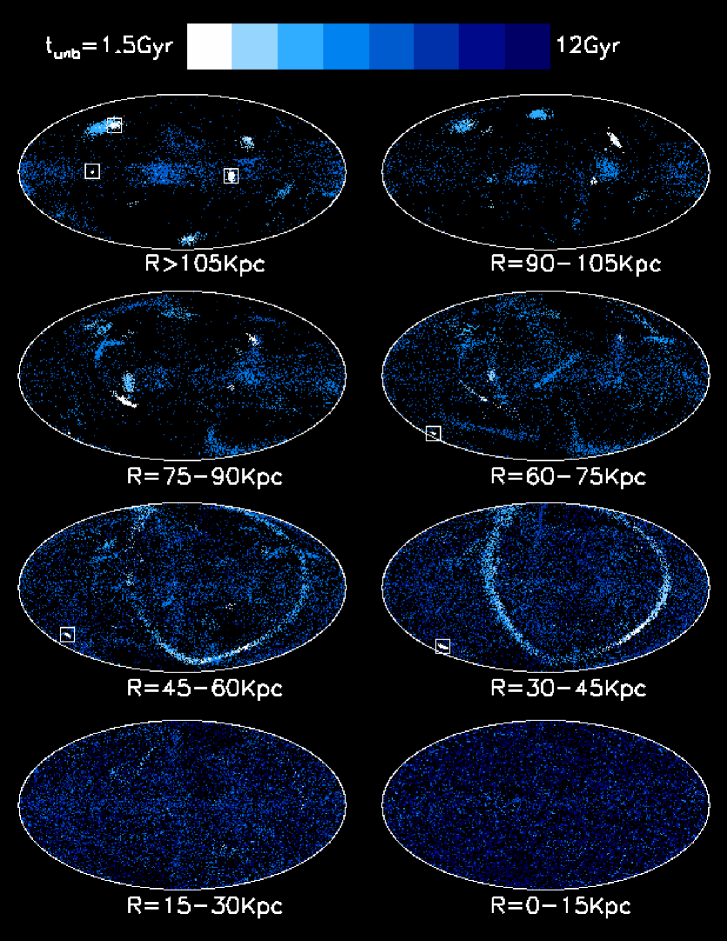
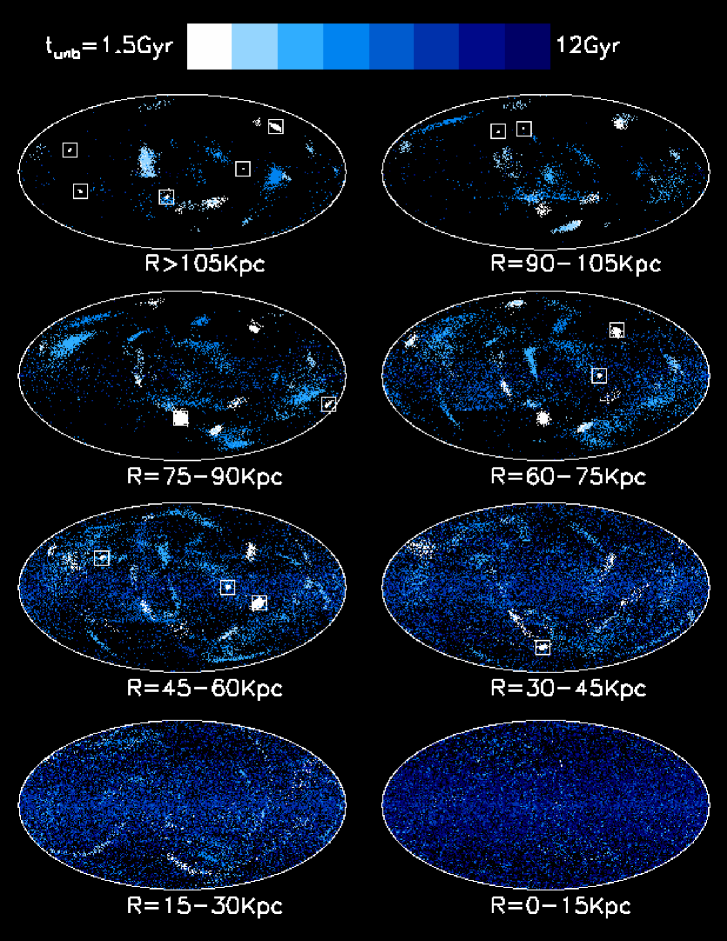
Figures 3 and 4 show Aitoff sky projections for two of our stellar halo realizations. Projected in radial bins, each point represents a tracer star that samples 1 in 500 , and we have assumed a stellar mass-to-light ratio of 2 in the V-band. The outer halos, beyond kpc, show pronounced substructure, while the inner halos are more smooth. We expect structures of this kind to be uncovered by deep halo surveys like the Deep Giant Star Survey, Spaghetti Survey, and the Sloan Digital Sky Survey (Majewski et al. 2000, Morrison et al. 2000, Yanny et al. 2000). We have colored each point based on the time it became unbound (scale bar at the top), and the substructure is even more evident in this representation. Specifically, more recent disruption events tend to be seen as coherent substructure. This is dramatically apparent in the great-circle stream in Figure 3 at kpc, but smaller coherent streams can be seen as far in as kpc, especially in Figure 4. If star formation is ongoing in satellites after they are accreted, then more chemically evolved stars will be associated with more recently unbound particles. This suggests that chemical probes may prove useful in substructure searches. While not shown, similar trends are seen even if we tag particles simply by the time when the satellite was accreted.
Note that the surviving satellites (boxes) are likely to have had significantly different chemical evolution histories than those that disrupted early and contributed to the central halo. The median accretion time for surviving satellites is Gyr in the past, while most of the stellar halo was in place Gyr ago. That the surviving systems are expected to represent a different population of dwarfs than those that get destroyed may help explain why most satellite dwarf abundance patterns do not look like that of the average inner stellar halo of the Milky Way (e.g., Shetrone et al. 2001). Interestingly, studies indicate that the outer halo may have abundances similar to those in some dwarfs (e.g., Fulbright 2002). This trend is roughly consistent with our expectations, as demonstrated in Figure 3 and especially in Figure 4.
Acknowledgments.
JSB is supported by NASA through Hubble Fellowship grant HF-01146.01-A from the Space Telescope Science Institute, which is operated by the Association of Universities for Research in Astronomy, Incorporated, under NASA contract NAS5-26555. KVJ was supported by NASA LTSA grant NAG5-9064, NSF CAREER award AST-0133617 and a travel award from Wesleyan University. We thank Francisco Prada, David Martínez-Delgado, and the rest of the organizers for an enjoyable and instructive meeting.
References
Binney, J. & Tremaine, S. 1987, Galactic Dynamics (Princeton: Princeton University Press)
Bullock, J. S., Kravtsov, A. V., & Weinberg, D. H. 2000, ApJ, 528, 145
Bullock, J. S., Kravtsov, A. V., & Weinberg, D. H. 2001, ApJ, 548, 33
Dekel, A. & Woo, J. 2003, MNRAS, 344, 1131
Fulbright, J.P. 2002, AJ, 123, 404
Ghigna, S., Moore, B., Governato, F., Lake, G., Quinn, T., & Stadel, J. 1998, MNRAS, 300, 146
Grebel, E. K. 2001, ApSSS.277–231G
Hashinoto, Y. Funato, Y. & Makino, J. 2003, astro-ph/0208452
Helmi, A., White, S.D.M., & Springel, V. 2003, MNRAS, 339, 834
Hernquist, L. 1990, ApJ, 356, 359
Johnston, K. V., Sackett, P. D., & Bullock, J. S. 2001, ApJ, 557, 137
Klypin, A.A., Kravtsov, A.V., Valenzuela, O., & Prada, F. 1999, ApJ, 552, 82
Lacey, C. & Cole, S. 1993, MNRAS, 262, 627
Majewski, S. R., Ostheimer, J. C., Kunkel, W. E., & Patterson, R. J. 2000, AJ, 120, 2550
Morrison, H. L. et al. 2000, AJ, 119, 2254
Navarro, J. F., Frenk, C. S., & White, S. D. M. 1996, ApJ, 462, 563
Searl, L. & Zinn, R. 1978, ApJ, 225, 357
Shetrone, M.D.,Côté, P., & Sargent, W.L.W. 2001, ApJ, 548, 592
Somerville, R. S. & Kolatt, T.S. 1999, MNRAS, 305, 1
Wechsler, R. H., Bullock, J. S., Primack, J. R., Kravtsov, A. V., & Dekel, A. 2002, ApJ, 568, 52
Yanny, B. et al. 2000, ApJ, 540, 825
Zentner, A.J. & Bullock, J. S. 2003, ApJ, 598, 49