Small-scale variations in the radiating surface of the GRB 011211 jet
Abstract
We report the discovery of the afterglow of the X-ray rich, long-duration gamma-ray burst GRB 011211 and present evidence for oscillatory behaviour in its early optical light curve. The time-scale of the fluctuations, 1 hour, is much smaller than the time of the observations, 12 hours from the onset of the gamma-ray burst. The character and strength of the fluctuations are unprecedented and are inconsistent with causally connected variations in the emission of a symmetric, relativistic blast wave, i.e. flux variations which are produced uniformly throughout the shell surface are ruled out. Therefore, the wiggles are the result of spherically asymmetric density or energy variations. Additionally, there is evidence for fluctuations in the X-ray afterglow light curve. If real, the resulting difference in the observed time of the peaks of the short-term variations at X-ray and optical frequencies, would demonstrate that the energy content across the jet-emitting surface is not uniform.
keywords:
Gamma rays: bursts , X-rays: generalPACS:
95.85.Kr , 95.85.Nv , 98.70.Rz, , , , , , , , , , , , , ,
1 Introduction
GRB 011211 was detected on 2001 December 11.798 UT (Gandolfi, 2001a) with one of the Wide Field Cameras (WFCs) on board the Italian-Dutch satellite BeppoSAX. The prompt gamma-ray emission lasted 270 s, making it one of the longest bursts observed with the satellite. Following the distribution of a 2′ radius error circle (Gandolfi, 2001b), we identified (Grav et al., 2001) the optical counterpart of the gamma-ray burst (GRB). An X-ray afterglow was subsequently detected (Santos-Lleo et al., 2001) and its redshift measured via absorption lines in the optical spectrum to be (Fruchter et al., 2001; Holland et al., 2002). The analysis of the X-ray spectrum (Reeves et al., 2002) showed emission lines arising in metal-enriched material with an outflow velocity of 0.1. The presence of such line features strongly suggests a massive stellar progenitor, but the details remain model dependent (Lazzati et al., 2002a).
Afterglow observations of long-duration GRBs typically show their flux to decline as a power-law in time. However, recent continuous early-time monitoring of GRB optical light curves has shown evidence for variations or bumps superposed on power-law decays (Bersier et al., 2003; Fox et al., 2003; Uemura et al., 2003). We note that these are not supernova bumps as observed in the optical afterglow (OA) light curves of several bursts (see e.g. Bloom et al., 1999; Garnavich et al., 2003; Hjorth et al., 2003). We present here for the first time a comparative study of multi-wavelength oscillations observed in the light curve of GRB 011211. Despite intensive monitoring of many GRB counterparts (Hjorth et al., 1999; Stanek et al., 1999; Halpern et al., 2003; Burenin et al., 2003; Laursen & Stanek, 2003; Gorosabel et al., 2003), the only other burst for which short-term time-scale (less than one hour) variations have been detected in its optical light curve is GRB 021004, albeit in a random fashion (Bersier et al., 2003). The oscillatory behaviour and the rapid, sharp decline and rise of the pulses of the light curve of GRB 011211 presented here, are unlike any other light curve reported before. Our observations provide a useful probe of the GRB explosion, the structure of the emerging jet, as well as the structure of the surrounding environment.
2 Observations & data analysis
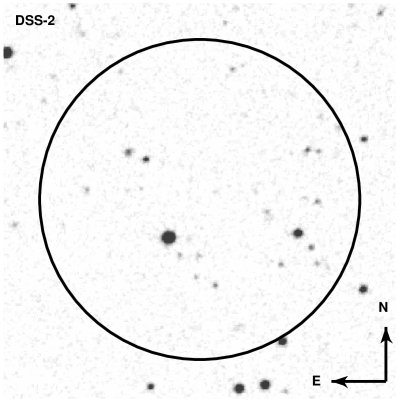
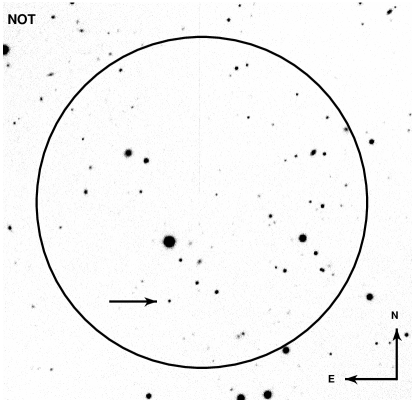
We observed GRB 011211 9.6 hours after the GRB trigger (starting 2001 December 12.22 UT) with the Nordic Optical Telescope (NOT) at the Canary Island of La Palma and with the Danish 1.54-m telescope at La Silla in Chile, in standard -, -, -, and -bands (Grav et al., 2001). A detailed log of our observations is listed in Table 1. A comparison of our first image with the Digitized Sky Survey 2 (DSS-2) frames, identified a new source shown in Fig. 1. Subsequent observations with the NOT revealed that the source was fading, thus establishing that the nature of the transient was consistent with being the OA of GRB 011211.
Reference stars for astrometry were collected using the large field of view provided by the Danish Faint Object Spectrograph and Camera (DFOSC) mounted on the Danish 1.54-m ( arcmin2). Based on 50 USNO stars per image, we determined 11 independent positions of the afterglow. The mean value of the 11 afterglow coordinates is RA(J2000) = and Dec(J2000) = with an error of .
| Date (UT) | Tel. | Magnitude | Seeing | Exp. time |
|---|---|---|---|---|
| (2001 Dec) | (arcsec) | (s) | ||
| B-band: | ||||
| 12.2816 | NOT | 1.1 | 300 | |
| 12.3539 | 1.54-m | 1.4 | 200 | |
| V-band: | ||||
| 12.2907 | NOT | 1.0 | 300 | |
| 12.3586 | 1.54-m | 1.2 | 300 | |
| R-band: | ||||
| 12.2181 | NOT | 1.7 | 300 | |
| 12.2227 | NOT | 1.4 | 300 | |
| 12.2272 | NOT | 1.3 | 300 | |
| 12.2831 | 1.54-m | 1.5 | 600 | |
| 12.2912 | 1.54-m | 1.5 | 600 | |
| 12.2994 | 1.54-m | 1.4 | 600 | |
| 12.3075 | 1.54-m | 1.4 | 600 | |
| 12.3157 | 1.54-m | 1.3 | 600 | |
| 12.3238 | 1.54-m | 1.1 | 600 | |
| 12.3633 | 1.54-m | 1.1 | 300 | |
| 12.3681 | 1.54-m | 1.0 | 300 | |
| I-band: | ||||
| 12.2861 | NOT | 0.9 | 300 | |
| 12.3350 | 1.54-m | 1.3 | 300 | |
| 12.3397 | 1.54-m | 1.8 | 300 | |
| 12.3491 | 1.54-m | 1.4 | 300 |

We obtained very well sampled early -band observations of the OA 10–14 hours after the burst. Our data indicated significant temporal variations superposed on the power-law fit to the light curve of the GRB (Jakobsson et al., 2003, hereafter J03). To enhance the visibility of these features, we subtracted from our data the power-law decay contribution () in the optical flux; the result is shown in Fig. 2 (top panel). The deviation of the data points from a pure power-law decline is significant () as derived from Spearman’s rank correlation. The residual weighted mean is with a root mean square (rms) of (after correcting for the photon noise). The amplitude of the largest oscillation is 0.25 magnitudes. We detect two maxima with a single minimum in-between and by fitting Gaussians to the data set we measure the time-scale of the temporal oscillations to be hours. In the middle panel of Fig. 2 we display the combined multicolor light curve of GRB 011211; a wave-like behaviour similar to that in the -band light curve is evident in the combined -, -, and -band residuals.
The bottom panel of Fig. 2 shows the temporal variations present in the residuals of the X-ray afterglow of GRB 011211 observed with the X-ray Multi Mirror-Newton satellite (XMM-Newton) (Santos-Lleo et al., 2001). The reduction of the X-ray data set is described in detail in J03. We observe significant deviations from the power-law decline () in the X-ray flux (3 as derived from Spearman’s rank correlation). Although the X-ray fluctuations are not as significant as the optical ones, the value of the (X-ray) Spearman rank correlation coefficient translates to a probability of less than that this correlation is a statistical fluctuation. The weighted mean of the residuals is , with an 11 rms variation around the mean flux (after correcting for the photon noise). There is weak evidence that the fluctuations are of a similar oscillatory nature as the optical ones. The fluctuation time-scale is comparable to that observed in the optical, with . From the short overlap of the optical and X-ray data, we find that the oscillations are not in phase with a time difference of at least hours (as derived from the cross correlation function).
3 Discussion
The short-term wave-like behaviour of the GRB 011211 optical light curve reported here is unprecedented. This behaviour was not detected in the earlier analysis of the OA of GRB 011211 reported by Holland et al. (2002), due to insufficient data sampling. Moreover, the variations detected in the optical afterglow of GRB 021004 (Bersier et al., 2003) appeared highly random and erratic, and all other GRBs have displayed variations with much longer time-scales. We discuss below the origin of the bumps in the optical light curve of GRB 011211.
The simplest afterglow model, where a relativistic jet decelerates as it expands into the ambient matter leading to a radiative output with a characteristic power-law decay, has been remarkably successful so far in accommodating the present data (van Paradijs et al., 2000). How does this model account for the unusual optical light curve of GRB 011211? The strong temporal variations in the early afterglow could be interpreted as a result of i) refreshed shocks created as the leading edge of the jet decelerates and is caught up by slower-moving jet gas (e.g. Rees & Mészáros, 1998; Panaitescu et al., 1998; Ramirez-Ruiz et al., 2001b), ii) the relativistic jet impacting an external medium of variable density (e.g. Wang & Loeb, 2000; Ramirez-Ruiz et al., 2001a; Lazzati et al., 2002b; Heyl & Perna, 2003; Nakar et al., 2003), or iii) a non-uniform jet structure (e.g. Mészáros et al., 1998; Kumar & Piran, 2000). We note that a smooth jet traveling through a clumpy medium would quickly cease to be homogeneous, i.e. it is possible that ii) could give rise to iii). Refreshed shocks covering a large fraction of the emitting surface can only increase the energy of the blast wave, and therefore cannot account for the rapid decay seen in the optical data (top panel of Fig. 2).
The sharpness of the features observed at optical frequencies is difficult to reconcile with a density discontinuity covering most of the visible surface of the jet (Nakar & Piran, 2003). On the other hand, the short time-scale of the oscillations provides interesting upper limits of 1–10 AU on the size of the clumps around the source. These limits are lower than the fluctuation amplitudes seen on similar scales in the local interstellar medium (Wang & Loeb, 2000), though they may reflect the length scale of comet-like clumps observed in ring nebulae surrounding massive stars (e.g. Garcia-Segura et al., 1996).
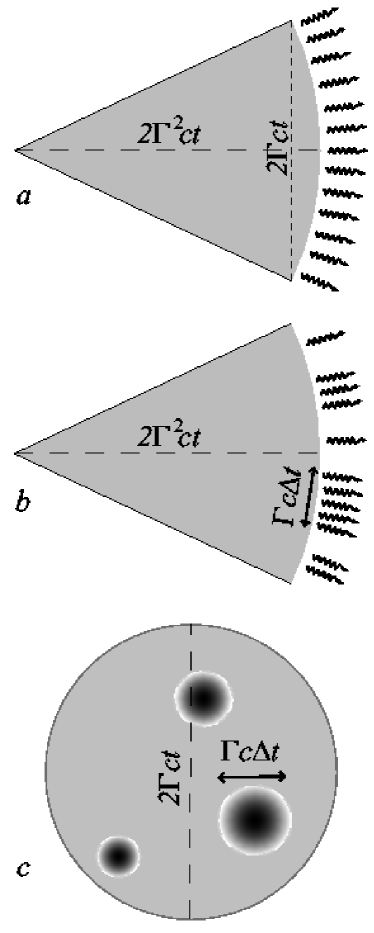
A promising alternative interpretation is energy variations within the expanding jet. It is possible for a large fraction of the emitting surface of the jet to become active and the flare region to remain small, because the energy content of the jet varies strongly as a function of angle. At the time of the observations the region contributing to the total observed flux would have a transverse size of , where is the Lorentz factor of the jet. Only regions the size of can produce afterglow fluctuations with time structures of . In other words, the jet-emitting surface is peppered with many regions (hot spots) on a scale much smaller than the narrow cone visible along the line of motion (see Fig. 3). Variations in the initial conditions as a function of the opening angle could spread the causally disconnected regions out along the line of sight to the observer such that the emission would arrive at different times. The corresponding overall emission at a given wavelength is then averaged over the observed region, and it may increase or decrease locally depending on the number, intensity, and spectrum of the different flare sites across the jet surface. This can happen either because the radiating material is in narrow fingers or, as the jet slows down, we observe afterglow emission not just from material moving directly towards us, but also from a wider range of angles. Thus, an inhomogeneous energy jet is a viable explanation for the observed rapid variations in the light curve, with the size of a hot spot determining the duration of the bump.
From our optical observations alone we can safely conclude that the wiggles in the light curve of GRB 011211 are the result of spherically asymmetric density or energy variations, i.e. variations that cover less than the observed region.111This is because the observed time-scale of the variations (1 hour) is much shorter than the overall elapsed time after the burst trigger (12 hours), when angular smoothing would have smeared out the light curve variations. The question remains: Can we decide between the above two scenarios. In principle, simultaneous multi-wavelength observations can help settle this question (see Salmonson & Ramirez-Ruiz, in preparation, for a detailed treatment) and, although the X-ray variations are of lower significance than the optical, in what follows we explore the implications of fluctuations in both bands. As shown by J03, the X-ray band is located above the cooling frequency at the time of our observations, where density variations of the ambient medium have a much weaker impact on the emitted flux (see e.g. equation 7 in Nakar et al., 2003). Given the observed 11 variation in the X-ray flux, we would then expect a much stronger correlated optical one, which we do not observe. On the other hand, uncorrelated fluctuations at different energy bands can be produced by hot spots (small regions with higher energy and/or ). Since strongly affects the synchrotron peak frequency, a situation can easily arise where we observe a hot spot releasing most of its energy in the X-rays, without a significant optical contribution above the continuum. Conversely, an optical/infrared bump can be detected without an X-ray counterpart, at least when the cooling frequency of the afterglow continuum spectrum is located between the optical and the X rays. Thus, the combined departure from a power-law decay observed in the optical and X-ray light curves seems to disfavour a scenario in which the density of the ambient medium varies and the energy is kept constant across the jet surface.
The above reasoning assumes that the X-ray and optical photons are emitted from the surface of the expanding jet, an assumption justified by the fact that the variations seen at different energies have similar time-scales. Interestingly, the analysis of the X-ray spectrum during this time frame uncovered the presence of emission line features arising from metal-enriched material (Reeves et al., 2002). It is feasible that a fraction of X-ray photons reach the observer after being reflected by material away from the line of sight (Lazzati et al., 2002a). While the presence of such spectral features is not conclusive (but see e.g. Watson et al., 2003), the X-ray wiggles observed here could be attributed to variations in the line emission intensity, which in turn are caused by changes in the illuminating continuum. The X-ray afterglow could then, at least in part, be due to the continuing power output from the GRB central engine interacting with the envelope of a massive progenitor star (Rees & Mészáros, 2000).
Collapsar (MacFadyen et al., 2001) or magnetar-like (Wheeler et al., 2000) models not only provide a natural scenario for a sudden burst followed by a decaying energy output but could also easily imprint a non-uniform structure to the GRB jet as it bores its way through the stellar mantle (Zhang et al., 2003). Further data on early X-ray spectral and temporal features provided by the Swift satellite will offer additional clues to the nature of the progenitor and the relativistic jet that it triggers.
Acknowledgements
It is a pleasure to thank Sir M. Rees, S. E. Woosley, G. Björnsson, E. H. Gudmundsson, A. Loeb, S. T. Holland and E. Nakar for helpful comments and suggestions. We are grateful to the anonymous referee for stimulating remarks which have improved the paper. Our results are based on observations made with the Nordic Optical Telescope, operated on the island of La Palma jointly by Denmark, Finland, Iceland, Norway, and Sweden, in the Spanish Observatorio del Roque de los Muchachos of the Instituto de Astrofisica de Canarias. We acknowledge the availability of DSS-2 exposures used in this work. P.J. gratefully acknowledges support from The Icelandic Research Fund for Graduate Students, and a Special Grant from the Icelandic Research Council. E.R. thanks CONACyT and the ORS for sponsorship. J.P.U.F. and K.P. acknowledge support from the Carlsberg foundation. This work was supported by the Danish Natural Science Research Council (SNF). The authors acknowledge benefits from collaboration within the EU FP5 Research Training Network “Gamma-Ray Bursts: An Enigma and a Tool”.
References
- Bersier et al. (2003) Bersier, D., et al., 2003. ApJ 584, L43
- Bloom et al. (1999) Bloom, J. S., et al., 1999. Nature 401, 453
- Burenin et al. (2003) Burenin, R., et al., 2003. AstL 29, 573
- Fox et al. (2003) Fox, D. W., et al., 2003. Nature 422, 284
- Fruchter et al. (2001) Fruchter, A., Vreeswijk, P., Rhoads, J., Burud, I., 2001. GCN Circ. 1200
- Gandolfi (2001a) Gandolfi, G., 2001a. GCN Circ. 1188
- Gandolfi (2001b) Gandolfi, G., 2001b. GCN Circ. 1189
- Garcia-Segura et al. (1996) Garcia-Segura G., Langer N., Mac Low M.-M., 1996. A&A 316, 133
- Garnavich et al. (2003) Garnavich, P., et al., 2003. ApJ 582, 924
- Gorosabel et al. (2003) Gorosabel, J., et al., 2003. A&A, submitted (astro-ph/0309748)
- Grav et al. (2001) Grav, T., et al., 2001. GCN Circ. 1191
- Halpern et al. (2003) Halpern, J. P., Mirabal, N., Bureau, M., Fathi, K., 2003. GCN Circ. 2021
- Heyl & Perna (2003) Heyl, J. S., Perna, R., 2003. ApJ 586, L13
- Hjorth et al. (1999) Hjorth, J., et al., 1999. GCN Circ. 320
- Hjorth et al. (2003) Hjorth, J., et al., 2003. Nature 423, 847
- Holland et al. (2002) Holland, S., et al., 2002. AJ 124, 639
- Jakobsson et al. (2003) Jakobsson, P., et al., 2003. A&A 408, 941 (J03)
- Kumar & Piran (2000) Kumar, P., Piran, T., 2000. ApJ 535, 152
- Laursen & Stanek (2003) Laursen, L. T., Stanek, K. Z., 2003. ApJ 597, L107
- Lazzati et al. (2002a) Lazzati, D., Ramirez-Ruiz, E., Rees, M. J., 2002a. ApJ 572, L57
- Lazzati et al. (2002b) Lazzati, D., Rossi, E., Covino, S., Ghisellini, G., Malesani, D., 2002b. A&A 396, L5
- MacFadyen et al. (2001) MacFadyen, A. I., Woosley, S. E., Heger, A., 2001. ApJ 550, 410
- Mészáros et al. (1998) Mészáros, P., Rees, M. J., Wijers, R., 1998. ApJ 499, 301
- Nakar & Piran (2003) Nakar, E., Piran, T., 2003. ApJ 598, 400
- Nakar et al. (2003) Nakar, E., Piran, T., Granot, J., 2003. NewA 8, 495
- Panaitescu et al. (1998) Panaitescu, A., Mészáros, P., Rees, M. J., 1998. ApJ 503, 314
- Ramirez-Ruiz et al. (2001a) Ramirez-Ruiz, E., Dray, L. M., Madau, P., Tout, C. A., 2001a. MNRAS 327, 829
- Ramirez-Ruiz et al. (2001b) Ramirez-Ruiz, E., Merloni A., Rees M. J., 2001b. MNRAS 324, 1147
- Rees & Mészáros (1998) Rees, M. J., Mészáros, P., 1998. ApJ 496, L1
- Rees & Mészáros (2000) Rees, M. J., Mészáros, P., 2000. ApJ 545, L73
- Reeves et al. (2002) Reeves, J. N., et al., 2002. Nature 416, 512
- Santos-Lleo et al. (2001) Santos-Lleo, M., Loiseau, N., Rodriguez, P., Altieri, B., Schartel, N., 2001. GCN Circ. 1192
- Stanek et al. (1999) Stanek, K. Z., Garnavich, P., Kaluzny, J., Pych, W., Thompson, I., 1999. ApJ 522, L39
- Uemura et al. (2003) Uemura, M., et al., 2003. Nature 423, 843
- van Paradijs et al. (2000) van Paradijs, J., Kouveliotou, C., Wijers, R. A. M. J., 2000. ARA&A 38, 379
- Vietri & Stella (1999) Vietri, M., Stella, L., 1999. ApJ 527, L43
- Wang & Loeb (2000) Wang, X., Loeb, A., 2000. ApJ 535, 788
- Watson et al. (2003) Watson, D., Reeves, J. N., Hjorth, J., Jakobsson, P., Pedersen, K., 2003. ApJ 595, L29
- Wheeler et al. (2000) Wheeler, J. C., Yi, I., Hoefflich, P., Wang, L., 2000. ApJ 537, 810
- Zhang et al. (2003) Zhang, W., Woosley, S. E., MacFadyen, A. I., 2003. ApJ 586, 356