The Luminosity-Metallicity relation in the local universe from the 2dF Galaxy Redshift Survey
Abstract
We investigate the Luminosity – Metallicity () relation in the local universe () using spectra of 6 387 star-forming galaxies extracted from the 2dF Galaxy Redshift Survey. This sample is by far the largest to date used to perform such a study. We distinguish star-forming galaxies from AGNs using “standard” diagnostic diagrams to build a homogeneous sample of starburst galaxies for the study. We propose new diagnostic diagrams using “blue” emission lines ([O ii] 3727, [O iii] 5007, and ) only to discriminate starbursts from AGNs in intermediate-redshift () galaxies. Oxygen-to-hydrogen (O/H) abundance ratios are estimated using the ”strong-line” method, which relates the strength of following bright emission lines [O ii] 3727, [O iii] 5007, and (parameters and ) to O/H. We used the [N ii] 6584/ emission-line ratio as “secondary” abundance indicator to break the degeneracy between O/H and . We confirm the existence of the luminosity – metallicity relation over a large range of abundances ( dex) and luminosities ( magnitudes). We find a linear relation between the gas-phase oxygen abundance and both the “raw” and extinction-corrected absolute -band magnitude with a rms of . A similar relation, with nearly the same scatter, is found in the band. This relation is in good agreement with the one derived by Melbourne & Salzer (2002) using the KISS data. However, our relation is much steeper than previous determinations using samples of “normal” irregular and spiral galaxies. This difference seems to be primarily due to the choice of the galaxy sample used to investigate the relation rather than any systematic error affecting the O/H determination. We anticipate that this luminosity – metallicity relation will be used as the local “reference” for future studies of the evolution with cosmic time of fundamental galaxy scaling relations.
keywords:
galaxies: abundances – galaxies: starburst – galaxies: evolution1 Introduction
Our understanding of galaxy formation and evolution certainly benefits from improving our knowledge about the chemical properties of galaxies. The chemical composition of stars and gas within a galaxy depends on various physical processes, such as the star formation history, gas outflows and inflows, stellar initial mass function, etc. Although it is a complicated task to disentangle the effects of these various processes, the determination of galactic chemical abundances at various epochs put strong constraints on the likely evolutionary histories of galaxies (see Pettini 2003 for a review).
The correlation between galaxy metallicity and luminosity in the local universe is one of the most significant observational results in galaxy chemical evolution studies. Lequeux et al. (1979) first revealed that the oxygen abundance O/H increases with the total mass of irregular galaxies. To avoid several problems in the estimate of dynamical masses of galaxies, especially for irregulars, absolute magnitudes are commonly used instead. The luminosity – metallicity () relation for irregulars was later confirmed by Skillman, Kennicutt & Hodge (1989), Richer & McCall (1995) and Pilyugin (2001a) among others. Subsequent studies have extended the relation to spiral galaxies (Garnett & Shields 1987; Zaritsky et al. 1994; Garnett et al. 1997; Pilyugin & Ferrini 2000), and to elliptical galaxies (Brodie & Huchra 1991). The luminosity correlates with metallicity over magnitudes in luminosity and 2 dex in metallicity, with indications suggesting that the relationship may be environmental- (Vilchez 1995) and morphology- (Mateo 1998) free. This suggests that similar phenomena govern the over the whole Hubble sequence, from irregular/spirals to ellipticals (e.g. Garnett 2002; Pilyugin, Vilchez & Contini 2004). Recently, Melbourne & Salzer (2002) have used a sample of 519 star-forming emission-line galaxies from the KPNO International Spectroscopic Survey (KISS) to confirm the existence of the relation over a broad range of luminosity and metallicity. They found however that the slope of the relation is steeper than the dwarf galaxy relation (see also Pilyugin & Ferrini 2000). This may be evidence that the relationship is not linear over the full luminosity range (see also Mouhcine & Contini 2002).
Many recent studies in galaxy evolution trace changes in scaling relations of galaxies as a function of cosmic epochs, such as the Tully – Fisher relation for disks (e.g. Milvang-Jensen et al. 2003; Ziegler et al. 2002) and the fundamental plane relation for spheroids (e.g. van Dokkum & Ellis 2003; Im et al. 2002). In this context, the luminosity – metallicity relation of galaxies can be used as a sensitive probe and consistency check of galaxy evolution.
The chemical properties of galaxies at different epochs provide new constraints on theories of galaxy formation and evolution. If local effects such as the gravitational potential and “feedback” from supernova-driven winds are the dominant regulatory mechanisms for star formation and chemical enrichment, then the relation might be nearly independent of cosmic epoch, such as predicted by the semi-analytic models of galaxy formation and evolution (e.g. Kauffmann et al. 1993; Somerville & Primack 1999). However, based on our current knowledge of galaxy evolution, suggesting that the cosmic star formation rate was higher in the past (e.g. Madau et al. 1996), and that the overall metallicity in the universe at earlier times was lower, we might expect galaxies to be considerably brighter at a given metallicity if there was more primordial gas available in the “young” universe to fuel star formation.
With the advent of the 10-m class telescopes and the powerful optical and near-infrared spectrographs, it is now possible to probe the physical properties (SFR, extinction, chemical abundances, mass, stellar populations, etc) of intermediate (; Kobulnicky, Kennicutt & Pizagno 1999; Hammer et al. 2001, Contini et al. 2002, Lilly, Carollo & Stockton 2003; Kobulnicky et al. 2003; Lamareille et al. in preparation) and high-redshift (; Pettini et al. 1998, 2001; Kobulnicky & Koo 2000; Mehlert et al. 2002; Lemoine-Busserolle et al. 2003; Erb et al. 2003) galaxies. Even if the number of galaxies per redshift bin is still small, these studies show that high-redshift galaxies () are 2-4 magnitudes brighter than local galaxies of similar metallicity. This deviation from the local relation demonstrates that the ratio between the luminosity and metal content varies throughout a galaxy’s lifetime and is a powerful diagnostic of its evolutionary state.
At intermediate redshifts, the situation is still not clear. Kobulnicky & Zaritsky (1999) and Lilly, Carollo & Stockton (2003) found their samples of intermediate- galaxies to conform to the local relation without any significant evolution of this relation out to . On the contrary, Kobulnicky et al. (2003) claimed recently that both the slope and zero point of the relation evolve with redshift, the slope becoming steeper at early cosmic time.
The determination of the fraction of galaxies that deviate from the local relation, as well as the amplitude of this deviation as a function of redshift, will certainly help in constraining the “differential” rate of star formation between high-redshift galaxies and local ones. However, such studies require a reliable local relation, extending over a large range of metallicities and luminosities, taking into account the variety of the local galaxy population and giving a better estimate of the overall shape of the relation and its intrinsic scatter.
The main goal of this paper is thus to establish the luminosity – metallicity relation in the local Universe. To do so we extracted a sub-sample of nearly 7 000 emission-line star-forming galaxies with high signal-to-noise spectra from the 2dF Galaxy Redshift Survey (hereafter 2dFGRS). We anticipate that this luminosity – metallicity relation will be used as the local calibration for future studies of the evolution with cosmic time of fundamental galaxy scaling relations.
This paper is organized as follow. In Sect. 2, we present the selection criteria applied to the original 2dFGRS sample to define a sub-sample of emission-line galaxies with high quality spectra. Various observed line ratios and their implications for the analysis of the physical conditions in emission-line galaxies, and the oxygen abundance estimates are also discussed. In Sect. 3 we present the derived luminosity – metallicity relation, and show how it compares with previous determinations. In Sect. 4, we present the results of this paper and summarize our conclusions.
Throughout this paper, all calculations assume the cosmology given by WMAP, with , and .
2 The data
2.1 Sample selection
The sample of emission-line star-forming galaxies used to establish the local relation is extracted from the 2dFGRS observations.
The 2dFGRS data set consists of optical (Å; Å) spectroscopy of more than 250 000 galaxies, covering two contiguous declination strips, plus 99 randomly located fields. One of the strips is located close to the super galactic plane, while the other strip is located in the northern galactic hemisphere. The mean redshift of the initial sample is , with almost all galaxies with . Full details of the survey strategy are given in Colless et al. (2001). Although, the original 2dFGRS spectra are not flux calibrated, the relative flux calibration, which is more critical for our analysis of emission-line ratios and equivalent widths is accurate (Lewis et al. 2002). The data reduction ensures that the flux ratio of adjacent emission lines is reliable.
The measurement of equivalent widths has been done using a fully automatic procedure by fitting Gaussian profiles to both absorption and emission lines simultaneously (see Lewis et al. 2002 for a detailed discussion of the procedure and the determination of the fitting quality). The measured spectral features include [O ii] 3727, , [O iii] 4959,5007, , [N ii] 6584, and [S ii] 6717,6731. All strong emission lines needed to reliably estimate the nature of the main ionizing source and the gas phase oxygen abundance are measured.
Starting from the original 2dFGRS sample of 269 013 spectra, we have applied different quality criteria to draw a sub-sample of 7 402 galaxies. This sub-sample was selected as follows.
To get accurate estimate of the gas phase abundances and to avoid any bias due to observational problems, we have restricted ourselves to galaxies with high-quality spectra. We first exclude all galaxies observed before 31th August 1999, which exhibit problems due to a fault of the atmospheric dispersion compensator within the 2dF instrument (see Lewis et al. 2002 for more detailed discussion on this issue). For these galaxies, the fitting procedure to determine line properties leads to poor quality results. In addition, only galaxies with good overall spectrum quality are selected. We thus selected galaxies for which we have the best quality fit, i.e. no bad pixels detected within of the line center, for emission lines used to determine both the nature of the main ionizing source and the oxygen abundance, namely [O ii] 3727, , [O iii] 4959,5007, , [N ii] 6584, and [S ii] 6717,6731.
We also choose spectra with a median signal-to-noise ratio (measured between Å) of at least 10. Indeed, we found during preliminary investigations that adding more noisy spectra will introduce a bias in the relation. Finally, for galaxies observed several times we kept the spectrum with the best overall quality or, if the same, the best signal-to-noise ratio.
2.2 Nature of the main ionizing source: starburst or AGN?
The selection criteria applied up to now focus only on the quality of the data. The restricted sub-sample built so far using these criteria includes emission-line galaxies with different ionizing sources, i.e., either young massive stars related to a recent starburst or a non-thermal continuum produced by an Active Galactic Nucleus (AGN). As we are interested in star-forming galaxies only, we have to exclude galaxies for which the emission-line spectrum is typical of AGNs. AGN-like spectra are distinguished from starburst ones by stronger collisional emission lines relative to recombination lines.
Seyfert 1 galaxies are distinguished from the other types of AGNs (Seyfert 2, LINERs) by broader Balmer emission lines. The distribution of Full Width at Half-Maximum (FWHM) for [O ii] 3727, [O iii] 5007, and emission lines shows that the maximum value for [O ii] 3727 and [O iii] 5007 is 10Å, whereas 49 galaxies have FWHM() exceeding this limit. These galaxies have been classified as Seyfert 1 galaxies, and thus excluded from the sample.
The widely used technique to distinguish starburst galaxies from narrow-line AGNs invokes diagnostic line ratios (e.g. Baldwin et al. 1981; Veilleux & Osterbrock 1987). The large wavelength coverage of 2dFGRS spectra allows the easy identification of an AGN-dominated spectrum (Seyfert 2 and LINER) by the presence of high [N ii] 6584/ and [S ii] 6717+6731/ flux ratios relative to [O iii] 5007/.
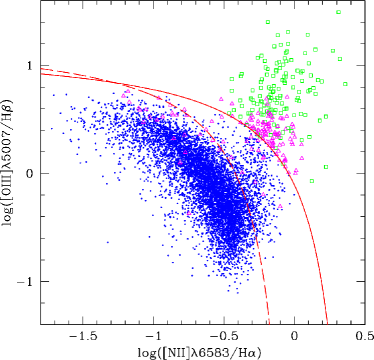
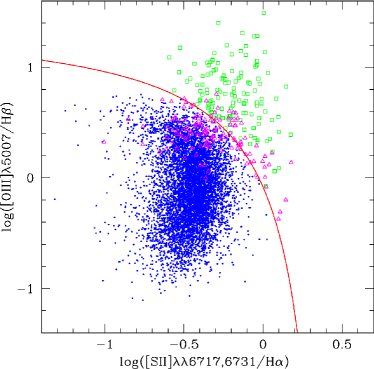
Figure 1 shows the location of our galaxy sample in the diagnostic diagrams [N ii] 6584/ vs. [O iii] 5007/ and [S ii] 6717+6731/ vs. [O iii] 5007/. We used equivalent width (EW) ratios instead of flux ratios in these diagrams. Note that these ratios are weakly sensitive to reddening and to uncertainties in the spectrophotometry. The left panel of Figure 1 shows that there are two well-separated sequences of emission-line galaxies in the [N ii] 6584/ vs. [O iii] 5007/ diagram. A similar distribution has been found for a sample of galaxies drawn from the Sloan Digital Sky Survey (SDSS) and discussed recently by Kauffmann et al. (2003). Our sample contains galaxies with a large variety of excitation levels, suggesting that this sample contains both low-metallicity and metal-rich galaxies. This sample is thus suitable for studying the relation over a large range of metallicities. The AGN sequence originates from the bottom of the location of starburst galaxies, i.e. where metal-rich galaxies locate. This suggests that the inclusion of AGNs in a sample used to investigate the relation will contaminate only the high-metallicity end.
The location of starburt galaxies relative to AGNs in the diagnostic diagrams has been extensively investigated in the literature. Recently Kewley et al. (2001) have coupled stellar population and photo-ionization models to predict the distribution of starburst galaxies in the diagnostic diagrams. Theoretical model predictions have associated uncertainties. Several input parameters, such as massive star atmosphere models, stellar evolutionary tracks, depletion factors and the slope of the initial mass function are not known with high accuracy. Observationally, starburst galaxies show correlations between their intrinsic properties, and consequently may scatter around any separation in the diagnostic diagrams. The solid line in the [S ii] 6717+6731/ vs. [O iii] 5007/ diagram gives an indication of the model uncertainties, and represents an upper limit to the theoretical boundary between starbursts and AGNs, corresponding to Kewley et al. (2001) model + 0.15 dex.
In both diagnostic diagrams, the predicted separation of Kewley al. (2001) between star-forming galaxies and AGNs match quite well the observed separation between starbursts and AGNs. We also show, in the [N ii] 6584/ vs. [O iii] 5007/ diagram, the separation limit adopted by Kauffmann et al. (2003) for SDSS galaxies. Unfortunately, they do not show either the location of SDSS galaxies in the [S ii] 6717+6731/ vs. [O iii] 5007/ diagram or the separation between starbursts and AGNs in this diagram. We found the separation limit adopted by Kauffmann et al. (2003) quite strict as it increases the number of galaxies with inconsistent classifications. We thus decided to adopt the theoretical seperation of Kewley et al. (2001).
We classified galaxies as starburst or AGN only if the classification criteria using both diagnostic diagrams are consistent, and reject all galaxies with a different classification in each diagnostic diagram. We end up with 7 085 starburst galaxies, 133 narrow-line AGNs (113 Seyfert 2 and 20 LINERs) and 135 galaxies with an ambiguous classification. The completeness of the final spectroscopicaly-selected sample is difficult to define. By restricting the sample to the presence of all the emission lines, from [O ii] 3727 to [S ii] 6717+6731, used both to classify the galaxies (starburst/AGN) and to calculate the gas-phase oxygen abundances, we implicitly impose an upper redshift limit of . By also requiring high-quality data, we exclude all galaxies with redshifts higher than . Our sub-sample thus remains incomplete at higher redshift and fainter magnitudes. Since the analysis of the relation does not rely strongly on the completeness level of the galaxy sample, and in order to use the largest number of galaxies for the analysis, we have decided to keep all the galaxies that satisfy our selection criteria listed above. Figure 2 shows the redshift distribution of the 7 085 star-forming emission-line galaxies we will use to derive the local relation. The median redshift of this sample is .

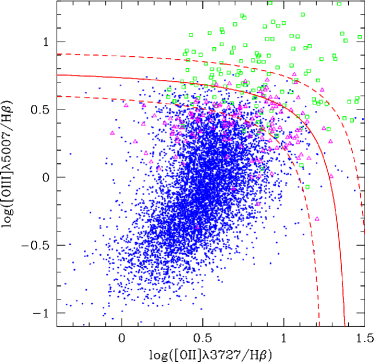
Taking advantage of the large sample of emission-line galaxies from 2dFGRS, we investigate the location of starbursts and narrow-line AGNs (Sey 2) in diagnostic diagrams involving “blue” emission lines only, i.e. [O ii] 3727, , and [O iii] 5007. Such diagrams could be very useful to discriminate AGNs from starbursts in spectra of intermediate-redshift galaxies obtained in large ongoing or future deep spectroscopic surveys (VVDS, DEEP, etc). Indeed, the “red” emission lines, such as , [N ii] 6584, and [S ii] 6717+6731, usually used to identify AGNs in the local universe are not observable in the optical range (up to Å) for redshifts greater than . Such investigations have already been performed in the past (e.g. Rola et al. 1997; Dessauges-Zavadsky et al. 2000) but on limited-size samples.
The location of the “classified” narrow emission-line 2dFGRS galaxies in new diagnostic diagrams is shown in Figure 3. The first diagram between [O iii] 5007/ and [O ii] 3727/, proposed by Rola et al. (1997), shows a clear distinction between starbursts (bottom left) and AGNs (upper right). From this diagram, we define the following analytical expression for the demarcation curve between starbursts and AGNs:
| (1) |
Starburst galaxies are located below this line. The contamination by AGNs in this region is very low (%) taking into account dex uncertainties in the separation curve.
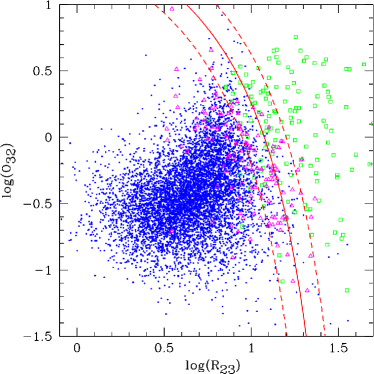
The second diagram between and (see Sect. 2.4 for a definition of these ratios) shows also a clear separation between starbursts (left part) and AGNs (right part). From this diagram, we define the following analytical expression for the demarcation curve between starbursts and AGNs:
| (2) |
Starburst galaxies are located to the left of this line. The discrimation between starbursts and AGNs is even better using this diagram, as the contamination by AGNs is very low (%) taking into account only dex uncertainties in the separation curve.
We conclude that these two diagnostic diagrams could be very efficient to separate AGNs from starbursts in intermediate-redshift () galaxies for which “blue” emission lines only are available.
2.3 Underlying Balmer absorption
Balmer emission-lines (e.g. , ) are generally affected by absorption lines from the underlying stellar populations, older than the current starburst, and have to be corrected. Usually the effect of the underlying stellar in absorption is accounted for by applying an ad hoc correction to the rest-frame equivalent width of the emission line independently of the galaxy properties. Different correction values for the stellar absorption have been used in the literature, ranging from 1Å (Jansen et al. 2000) to 5Å (Kennicutt 1992).
The emission lines in the spectra of our galaxy sample have been corrected from the underlying stellar absorption by a simultaneous fit of the emission and absorption lines. Figure 4 shows the distribution of EW restricted to galaxies with a good quality fit to in absorption. The mean value of the EW is 4.6Å, similar to Kennicutt (1992) value.

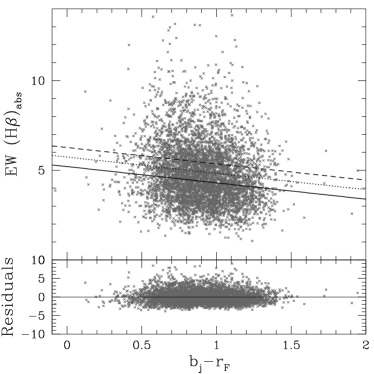
Instead of assuming a constant value for the EW of in absorption, as usually done in previous studies, we tried to link the EW to easily measured galaxy parameters. We found a correlation with the () color, an indicator of galaxy morphological type, i.e. redder is the galaxy smaller is the EW(. We found a lower dependancy on the absolute magnitude in -band (), i.e. brighter is the galaxy smaller is EW(. Figure 5 shows the EW( versus () relation. Also shown is a linear least-squares fit to the relation described by the following empirical calibration:
| (3) |
The rms of the residuals is 1.75Å. The EW of in absorption is deduced from EW using the empirical ratio (Gonzalez-Delgado et al. 1999). For a number of galaxies in our sub-sample, i.e., 1 955, the fit for the absorption line is of a poor quality. These spectra have been corrected using Eq. 3.
2.4 Metallicity
Using estimates of the oxygen abundance as indicators of the gas-phase metallicity is now well documented and calibrated (e.g. Pagel 1997). The most reliable method to derive the gas-phase oxygen abundance requires an estimate of the electronic temperature and density of the ionized gas (Osterbrock 1989). An accurate determination of these parameters requires reliable measurements of temperature-sensitive auroral lines, usually the [O iii] 4363 emission line. Unfortunately, the 2dFGRS spectra do not have the required S/N to measure correctly this line. The absence of direct detection of auroral lines, particularly in the case of metal-rich galaxies where these lines are too weak to be observed, require the development of alternative methods based on strong emission lines. The most widely used method is based on the measurement of strong emission lines, such as [O ii] 3727, [O iii] 4959,5007, and . These lines contain enough information to get an accurate estimate of the oxygen abundance (McGaugh 1991). This is done through the parameter introduced initially by Pagel et al. (1979), and defined as follow:
| (4) |
Extensive studies have been dedicated to calibrate the relation between and oxygen abundance (McCall et al. 1985; Pilyugin 2001b). The small number of emission lines needed to estimate makes this method very attractive. Strong-line ratios reliably indicate the oxygen abundance to within the accuracy of the model calibrations, i.e. dex. Traditionaly, is estimated from the flux of emission lines. Kobulnicky & Phillips (2003) have shown that the use of equivalent widths instead of fluxes of the same emission lines to derive gives almost the same results. The main advantage of this method is to be, at the first order, insensitive to the reddening. Thanks to the small wavelength separation between the emission lines involved in a given ratio, we are free to use the EWs of these lines instead of their fluxes.
Generally, the [O iii] 4959 emission line has a lower signal-to-noise ratio than the [O iii] 5007 line; thus the fitting procedure of this line gives poor results for % of our galaxy sample. For these galaxies we have used the theoritical ratio [O iii] 5007/[O iii] 4959=2.85. The distribution of the [O iii] 5007/[O iii] 4959 ratio, restricted to galaxies with good fitting quality of both lines, is in good agreement with this value, taking into account measurement uncertainties.
A complication with the use of parameter to estimate the oxygen abundance is that the dependency of metallicity on this parameter is degenerate. Indeed, at a fixed value of two different values of metallicity are possible; different ionization parameters should lead to similar oxygen abundances. increases with oxygen abundance in the low-metallicity regime (), while for metal-rich objects () it decreases with O/H reflecting the efficiency of oxygen cooling over abundance in these objects. In the “intermediate” metallicity region ( ), galaxies may have a large range of metallicities for a tight range of . The uncertainties in this metallicity domain, i.e. whether an object with a given parameter lies on the metal-rich branch or on the metal-poor branch of the O/H vs. relation, dominate the uncertainties related to model calibrations (see above).
Different abundance indicators have been used to break the degeneracy, e.g. [N ii] 6584/[O iii] 5007 (Alloin et al 1979), [N ii] 6584/[O ii] 3727 (McGaugh 1994), [N ii] 6584/ (van Zee et al. 1998), and galaxy luminosity (Kobulnicky, Kennicutt & Pizagno 1999). The first indicator is sensitive to the ionization parameter, while the galaxy luminosity can hardly be used to break the degeneracy, first of all because this is exactly what we are looking for, and secondly the universality of the relation is not established yet (see Contini et al. 2002 for detailed discussion). To break the degeneracy between low and high metallicities, we used the [N ii] 6584/ secondary indicator. Galaxies with log([N ii] 6584/) are classified as low metallicity objects, while the others are assumed to be metal-rich galaxies.
The oxygen abundance can be determined using the calibrations of McGaugh (1991). Analytical expressions are found in Kobulnicky, Kennicutt & Pizagno (1999), both for the metal-poor and metal-rich regimes. These calibrations are parametrized as a function of and the ionization parameter defined as = [O iii] 4959,5007/[O ii] 3727. We found that 495 galaxies fall into the low-metallicity region and 5 892 into the high-metallicity one. For 698 galaxies, the oxygen abundance estimated using the low-metallicity calibration was greater than the one derived using the high-metallicity calibration. This may happen when the parameter exceeds the maximum value allowed by the model. Those galaxies have been excluded from the sample in further analysis.
3 The Luminosity – Metallicity relation
In this section, we investigate the luminosity – metallicity relation in the local universe () using the sample of 6 387 star-forming galaxies extracted from the 2dFGRS as explained in the previous section.
Figure 6 shows our relation for star-forming emission-line galaxies. The general trend, widely discussed in the literature and confirmed here, is an increase of metallicty with luminosity over a large magnitude range, from to . Both the least-square bisector fit (Isobe et al. 1990) and the average of the forward fit, considering the absolute magnitude as the independent variable, and the backward fit, considering the metallicity as the independent variable, yield to similar results. The bisector linear fit111This fitting technique is more suitable in cases in which the intrinsic correlation being sought measurement errors are dominated by intrinsic scatter. is shown as the solid line in Figure 6, and is described by the following relation:
| (5) |
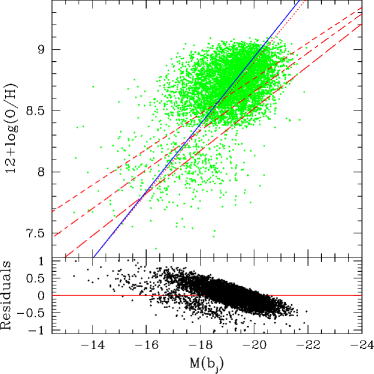
The rms scatter around the linear fit to the relationship between metallicity and luminosity is equal to 0.27 dex , greater than the error estimates for metallicity determination (0.15 dex). The origin of this intrinsic scatter may be due to differences in the star formation history, the evolutionary status of the current starburst, different initial mass function, etc (see e.g. Mouhcine & Contini 2002). The rms we found is identical to the one derived by Melbourne & Salzer (2002), who used a sample times smaller than our sample, suggesting that the rms value of 0.27 dex might be the “real” scatter of the relation. The uncertainty on the coefficients of Equ. 5 is lower than the one derived by Melbourne & Salzer (2002) thanks to our larger sample. The linear regression estimated after eliminating the points distant for more than 3 from the original regression does not show any significant difference.
It is instructive to compare our determination of the local relation with other published determinations. In Figure 6, we plot the relation for local “normal” irregular and spiral galaxies (Kobulnicky & Zaritsky 1999; short-dashed line), UV-selected and Hii galaxies (Contini et al. 2002; long-dashed line), spiral galaxies (Pilyugin et al. 2004, short/long-dashed line), and Melbourne & Salzer (2002) determination using a sample of 519 emission-line galaxies from KISS project (dotted line). It is worth mentioning that all determinations of the relation have been corrected to the same cosmology. Our new luminosity – metallicity relation has a steeper slope than the one found for nearby dwarf irregulars (Skillman et al. 1989; Richer & McCall 1995). This is in contrast with Kobulnicky & Zaritsky (1999) and Garnett (2002) finding, who concluded that the relation exhibits a uniform growth over both the low- (irregular galaxies) and high-metallicity (spiral galaxies) regimes. On the other hand, our determination is in excellent agreement with the Melbourne & Salzer (2002) one. The slopes of both determinations are almost identical taking into account uncertainties.
3.1 Possible sources of systematic errors
3.1.1 Different methods to derive O/H
Before going further in our discussion, it will be useful to highlight an issue that may be problematic. A criticism that may be addressed is the suitability of the strong-line method to derive oxygen abundances, and to which extent the systematic errors inherent to this method may affect our relation.
Different authors have pointed out that the method involves systematic errors due to the failure to take into account the variety of physical conditions in different Hii regions. For instance, Kennicutt et al. (2003) suspected the method to be systematically biased toward higher value of O/H than the direct method, especially at the high-metallicity end (see also Stasinska 2002). The strong-line method yields oxygen abundances that are systematically higher than the electronic temperature-based technique by an amount depending on the calibration and the excitation range considered. However, it is not clear whether the direct electronic temperature-based method is underestimating the oxygen abundances, or the strong-line method is overestimating them (see Stasinska et al. 2001 for a discussion of the modelling of Hii regions). The debate of understanding if the discrepancies in abundance scales are due to systematic biases in the electronic temperature-based scale or in the Hii region models used to calibrate different strong-line vs. abundance relations, particularly at high metallicity regime, is not settled yet.
The parameter has been calibrated and correlated with metallicity by measuring oxygen abundances using the direct method, i.e. based on estimates of eletronic density and temperature, for a large sample of Hii regions in the low-metallicity regime and using photoionization models for the high-metallicity regime (see Garnett 2002 for a review). The direct method suffers from severe limitations, such as the restricted range of the ionization parameters and/or metallicities and the observability of intrinsic weak lines. This makes this method difficult to use for abundance estimates, especially for galaxies at cosmological distances. There are several reasons for questioning the accuracy of both abundance scales (see Kennicutt et al. 2003 for a detailed discussion of different issues related to this topic). Pilyugin (2000) has provided new calibrations to implement McGaugh (1991) corrections into the empirical strong-line method. This method, usually called the “P-method”, is claimed to be more accurate for low-ionization Hii regions and for metal-poor nebulae than the traditional method. However, the P-method seems to suffer some weaknesses even within the abundance range for which it was designed for (Saviane et al. 2002; Kennicutt et al. 2003). Edmunds & Pagel (1984) and Pilyugin (2000) calibrations, between and O/H, have the same slope but are shifted towards higher abundances by dex, a value smaller than both the intrinsic uncertainties of the calibration and the intrinsic scatter of the luminosity – metallicity relation. Moreover, Melbourne & Salzer (2002) have shown that using Pilyugin (2000) calibration instead of Edmunds & Pagel (1984) one has only a small effect on the slope of the relation.
To check any dependancy of the relation on the choice of the O/H vs. calibration, we used the Pilyugin (2000) and the McGaugh (1991) calibrations to derive oxygen abundances. In each case, both line fluxes and equivalent widths are used to calculate the and parameters. We have to mention that these calibrations are roughly parallel in the O/H – diagram; the McGaugh (1991) calibration being systematicaly shifted toward higher abundances by dex at a given . In each case, we performed a linear regression on the relation, in a similar way used to derive Equ. 5. We find that i) the slopes of the different relations are similar, ii) none of the adopted O/H – calibration leads to a slope as shallow as the relation slope for irregular galaxies. We conclude that while the slope of the luminosity – metallicity relation is slightly sensitive to the choice of the O/H – calibration, our determination is not biased toward a steep slope. As our first motivation is to build a luminosity – metallicity relation for the local universe to be used as a reference for intermediate and high-redshift studies where the majority of abundance estimates are based on the strong-line method (e.g. Lilly et al. 2003; Kobulnicky et al. 2003; Lemoine-Busserolle et al. 2003; Lamareille et al., in preparation), and since it is a “differential” comparison of the abundance properties of different galaxies, the accurate choice of the calibration is not a critical issue.
3.1.2 Reddening
Is there any other systematic effect that may be responsible for the steep relation we derived? The luminosity – metallicity relation could be biased toward a steeper relation as a result of neglecting the effect of internal extinction. One may expect naively that bright galaxies are more affected by internal reddening than fainter ones, causing a systematic effect which increases as a function of the absolute magnitude and leading to a steeper relation. To investigate this effect, we have to estimate the extinction for our sample of galaxies. We derived the intrinsic interstellar reddening using the observed Balmer line flux ratios / following the standard prescription (e.g. Osterbrock 1989), and using the extinction law from Seaton (1979). Note that although different extinction laws available in the literature are different in the UV, they show similar behaviour in the optical, making the results of the subsequent analysis independent of the chosen extinction law (discussion of the galactic internal reddening and how its behaves as a function of galaxy properties will be discussed in more detail in a forthcoming paper).
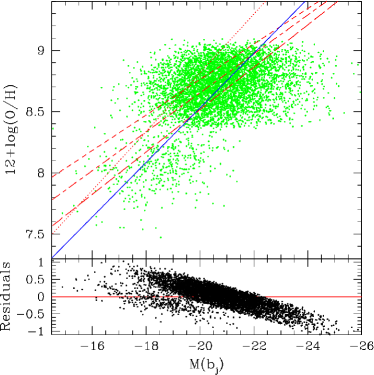
The results of the extinction correction on the relation, using the O/H – calibration as given by Kobulnicky et al. (1999), is shown in Figure 7. Again, a linear least square bisector fit is applied to the data, and we find the following expression to the luminosity – metallicity relation:
| (6) |
with an rms of 0.32. The extinction-corrected relation is slightly shallower than the previous one (uncorrected for extinction), but we still find a much steeper slope than what was reported before in the literature. Interestingly enough, the slope of our extinction-corrected relation is again in good agreement with the one found by Melbourne & Salzer (2002) after correcting their photometry for the internal extinction, despite the different methods adopted to estimate the internal reddening correction. The shift in the zero point between the two relations may be due to the different procedures used to correct for extinction. Melbourne & Salzer (2002) have corrected only galaxies that deviate at from the observed colour-magnitude relation, while we correct galaxies independently of their location in the observed colour-magnitude diagram.
3.2 Discussion on the slope of the relation
None of the possible sources of systematic errors listed above, i.e. the choice of the O/H – calibration and the internal reddening, can explain the steep slope of the relation we find. How can we explain the difference between our relation and the one derived for “normal” irregulars and spirals? The fact that different determinations of the luminosity – metallicity relation for irregular and spiral galaxies, using different methods and techniques, have similar slopes suggests that the systematic errors inherent to the O/H – calibration cannot bias the relation. Hence, the observed discrepancy between our relation and the other quoted determinations cannot be explained entirely by the uncertainties affecting the calibrations.
The difference between these relations may be attribuable to the different samples used by various authors. We think that the nature of the galaxy sample used to study the luminosity – metallicity relation has a strong impact on the derived slope. Mouhcine & Contini (2002) have investigated the relation for samples of Hii galaxies, UV-selected galaxies, and optical/far-infrared selected starburst nucleus galaxies. A linear fit to the entire sample provides a steeper correlation than what is found by Kobulnicky & Zaritsky (1999), i.e. a slope of 0.25. Once the starburst nucleus galaxies are excluded from the sample, the linear fit is consistent with shallower determinations of the relation (Richer & McCall 1985; Kobulnicky & Zaritsky 1999; Contini et al. 2002; Pilyugin et al. 2004). Again, this suggests that the relation is primarily sensitive to the nature of galaxy samples. The linear fit to irregular and spiral galaxies shown in Figure 6 is almost parallel to the fit to the UV-selected and Hii galaxies, i.e. at a given metallicity star-forming galaxies are brighter than “normal” galaxies. This is consistent with the expected effect of the current star formation episode in these galaxies, decreasing for a short period their mass-to-light ratio. As discussed by Melbourne & Salzer (2002), different recent determinations of the relation over a large range of metallicities/luminosities deviate from the relation derived for dwarf galaxies, the former being steepper (Zaritsky et al. 1994; Pilyugin & Ferrini 2000). The 2dFGRS galaxy sample contains a mixture of galaxies of different types, representative of the diversity of galaxies in the local universe. Thus, we believe that our determination of the luminosity – metallicity relation is consistent and more representative of the relation in the local universe than the previous determinations restricted to a particular type of galaxies.
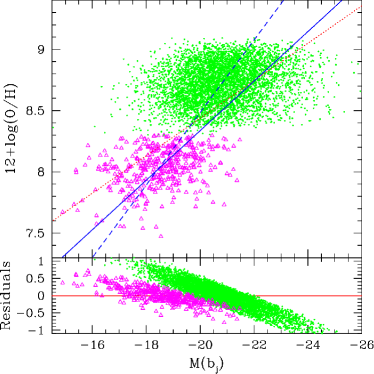
The difference between our relation and the one derived for dwarf galaxies suggests that the overall form of the luminosity – metallicity relation may not be simply approximated by a single linear relation. We split our sample of galaxies into two sub-samples, the first one having , as a representative sample of nearby metal-poor galaxies, and a second one having to mimic the metal-rich galaxy population. Figure 8 shows the relation for these sub-samples. Also shown are i) the linear fit to the metal-poor sample (solid line) given by the following equation: compared to Skillman et al. (1989) relation for nearby irregular (metal-poor) galaxies (dotted line), and ii) the linear fit to the metal-rich sample (dashed line) given by the following equation: . The luminosity – metallicity relations derived for these sub-samples are different, with metal-rich galaxies following a steeper relation than the metal-poor galaxies. The slope of the dwarf galaxy relation is slightly steeper than the one derived by Skillman et al. (1989), for which the oxygen abundances were estimated using the direct electronic-temperature method. Restricting the 2dFGRS sub-sample to the best quality spectra, we found a slope (), for the dwarf galaxy relation, similar to what has beenderived by Skillman et al. (1989), i.e. a slope of 0.153. The variation in the derived slopes being small and included in the error bars, it shows that the choice of the 2dFGRS sub-sample resulting from the selection criteria does not change significantly the slope of the derived relations. The small differences in the slope and zero point between our determination and the one by Skillman et al. (1989) for metal-poor galaxies may be due to: i) the different methods applied to derive O/H in low-mass galaxies; Skillman et al. (1989) used the “direct” method as we used the strong-line one, ii) the filter used to measure the galaxy magnitude varies also; -filter in our case instead of the standard -filter used by Skillman et al. (1989), and iii) the limited-size of the Skillman et al.’s sample compared with the 2dFGRS sub-sample.
3.3 Dependance with other galaxy properties
The large sample presented in this paper gives an opportunity to investigate a possible sensitivity of the luminosity – metallicity relation to various galaxy properties, such as star formation rate (SFR), galaxy stellar content, etc.
At a given mass, starburst galaxies tend to be brighter than “normal” galaxies forming stars at a lower rate, especially in the band. This could introduce a systematic shift in the relation for starburst galaxies toward higher luminosities for a given metallicity. Unfortunately, the 2dFGRS spectra are not calibrated in absolute flux, preventing us from estimating the current SFR of galaxies. Rather then using fluxes, we thus use Balmer emission-line EWs. The Balmer emission-line EWs are a measure of the relative proportion of ionizing photons (produced by massive stars related to the current star formation event) and continuum photons (produced by a mix between the whole cluster embedded in the Hii region, the underlying older stellar population, and a contribution from the ionized gas). The Balmer emission-line EWs may be understood as a measurement of the specific SFR. An analysis of the luminosity – metallicity relation as a function of the EW of Balmer emission lines might therefore tell us something about the sensitivity of this relation to the “current” SFR of galaxies.
We split the sample into different groups as a function of their . The first group contains galaxies having Å, group II contains galaxies with , group III contains those with , and finally group IV contains galaxies having . We then perform, for each group, a linear least square bisector fit to the relation. We find that the luminosity – metallicity relations for the first two groups are similar, whithin the errors, to each other and to the whole sample relation, showing similar scatter around the fit. This might be expected as the first two bins are sampling a short starburst age interval (Stasinska et al. 2001), within which the luminosity is not expected to vary significantly. The two remaining groups show relations with different slopes, indicating a sensitivity of the latter to the current SFR. However, the scatter around the fits are large, preventing us from drawing any firm conclusion.
Similarly, we investigate the sensitivy of the luminosity – metallicity relation to the galaxy colour. Again, no firm conclusion can be drawn. Furthermore there is no obvious correlation between the residuals from the relation in one hand and and colour in other hand. The present sample of galaxies does not present any appealing evidence for the sensitivity of the luminosity – metallicity relation to the stellar content of galaxies.
3.4 The relation in the band
-band photometry is available for the 2dFGRS galaxy sample. We thus investigate the -band luminosity – metallicity relation and find a trend between these two quantities similar to what is found in the “blue” band. We fit a linear relation between the oxygen abundance and the -band absolute magnitude, in a similar way to what has been done for the -band relation. We find the following -band relation:
| (7) |
with an rms of the residuals of 0.25 dex, lower than the scatter for the -band relation. This might be due to the smaller sensitivity of -band luminosity to the occurrence and the evolutionary status of a recent star formation episode.
3.5 Dependance with redshift and selection biases
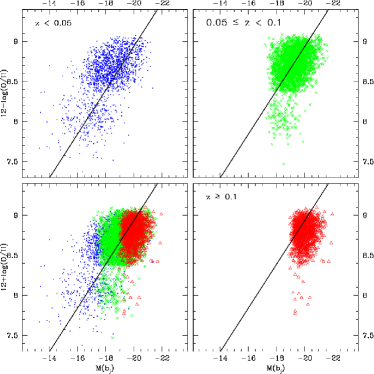
In this last section, we investigate whether the relation is redshift-dependant as recently suggested in Schulte-Ladbeck et al. (2003) using SDSS data. Despite the small redshift range of our sub-samble (), Figure 9 shows indeed significant differences if we divide the sample into three different redshift bins (i.e. , and ). At a given metallicity, the available observed luminosity range seems to be shifted toward higher luminosities when we look further in the past. This effect is supported by calculating, for each bin, the mean value of the luminosity, which increases ( for , for and for ) while, in average, the metallicity remains approximatively constant ( = 8.58, 8.70 and 8.77 respectively). This effect is particulary strong for low-metallicity objects ( , see the bottom-left panel).
Before drawing any conclusion on the evolution of the relation with redshift, one must take into account some selection effects. First of all, we have to consider that high-luminosity objects will preferably appear at high redshifts, where the volume of the observed universe is large enough to make their number significative given their small intrinsic proportion. In the opposite way, low-luminosity objects may appear at all redshifts, but most of them are observed at low redshift due to the magnitude-limited nature of the survey (the Malmquist bias). The first effect does not explain the evolution of the mean luminosity, while it is normalized to the total number of observed objects. The last one is more problematic because we loose almost all low-metallicity objects at higher redshift. Our quality selection criteria also introduce a bias: very metal rich, and thus very luminous, objects have been rejected from our sub-sample by the quality criterium on oxygen emission lines, considering that they are very faint (low S/N) for .
Taking into account these selection effects, no firm conclusion can be drawn from this study on any evolution of the relation with redshift.
4 Conclusions
We have investigated the luminosity – metallicity relation in the local universe, using data of star-forming galaxies () extracted from the 2dFGRS spectroscopic data set. The sample used in this paper is by far the largest sample of galaxies to date to derive the relation.
We first distinguished star-forming galaxies from AGNs using “standard” diagnostic diagrams to build a homogeneous sample of 6 387 starburst galaxies for the study. We propose also new diagnostic diagrams using “blue” emission lines ([O ii] 3727, [O iii] 5007, and ) to discriminate starbursts from AGNs in intermediate-redshift () galaxies. We have shown that the underlying absorption lines affecting Balmer lines in emission depend on galaxy properties, with a wide distribution ranging from 1 Å to 10 Å with an average value of 4.6Å. Oxygen-to-hydrogen abundance ratios were estimated for this sample of star-forming galaxies using the strong-line method, which relates the and parameters to O/H. We confirmed the existence of the luminosity – metallicity relation over a large range of abundances and luminosities. We find a linear relation between the gas-phase oxygen abundance and both the “raw” and extinction-corrected -band absolute magnitude with a rms of . A similar relation, with nearly the same scatter, exists for the -band absolute magnitude.
Our determination of the relation is in a remarkably good agreement with the one derived by Melbourne & Salzer (2002) using the KISS data . However, the slope of the relation we derived is much steeper than the ones previously determined using different samples of “normal” dwarf and spiral galaxies. We argue that this difference is not due to any systematic error inherent to the method used to derive O/H in galaxies. The nature of the galaxy sample used to investigate the correlation is however crucial. Neglecting a certain type of galaxies, such as starburst nucleus galaxies, in previous studies has biased the determination of the relation toward shallower slopes. The relation restricted to metal-poor galaxies of our sample is in agreement with the relation derived by Skillman et al. (1989) for the low-metallicity irregular galaxies.
The luminosity – metallicity relation extends over a range of magnitudes in luminosity, and a factor of in oxygen abundance. The 2dFGRS sample of galaxies used in this paper contains a large diversity of masses and stellar populations, from dwarf galaxies to massive spirals. By using such a sample of galaxies, we are constructing a more general luminosity – metallicity relation in the local universe than previous studies restricted to a given class of galaxies. This correlation seems to be continuous from faint dwarf galaxies to massive spirals, implying that the physical mechanism(s) regulating this correlation is common to star-forming galaxies over the whole Hubble sequence, without a clear dependency on the stellar content of galaxies.
The investigation of the chemical properties of high- galaxies, and the comparison between galaxy properties over a large range of redshifts will certainly help to clarify the evolutionary pattern of galaxies at different cosmic epochs.
Acknowledgments
M. M. would like to thank warmly A. Lançon for interesting and highlighting discussions about reddening in galaxies. We are grateful to the anonymous referee for useful comments and suggestions.
References
- [\citeauthoryearAlloin et al.1979] Alloin D., Collin-Souffrin S., Joly M., Vigroux L., 1979, A&A, 78, 200
- [\citeauthoryearBaldwin et al.1981] Baldwin J. A., Phillips M. M., Terlevich R., 1981, PASP, 93, 5
- [\citeauthoryearBrodie & Huchra1991] Brodie J., Huchra J.P., 1991, ApJ, 379, 157
- [\citeauthoryearColless et al.2001] Colless M., Dalton G., Maddox S.J., et al., 2001, MNRAS, 328, 1039
- [\citeauthoryearContini et al.2002] Contini T., Treyer M. A., Sullivan M., Ellis R. S., 2002, MNRAS, 330, 75
- [\citeauthoryearDessauges-Zavadsky et al.2000] Dessauges-Zavadsky M., Pindao M., Maeder A., Kunth D., 2000, A&A, 355, 89
- [\citeauthoryearEdmunds & Pagel1984] Edmunds M. G., Pagel B. E. J., 1984, MNRAS, 211, 507
- [\citeauthoryearErb et al.2003] Erb D.K., Shapely A.E., Steidel C.C., et al., 2003, ApJ, 591, 101
- [\citeauthoryearGarnett & Shield1987] Garnett D.R., Shield G.A., 1987, ApJ, 317, 82
- [\citeauthoryearGarnett et al.1997] Garnett D.R., Shield G.A., Skillman E.D., et al., 1997, ApJ, 489, 63
- [\citeauthoryearGarnett2002] Garnett D.R., ApJ, 2002, 581, 1019
- [\citeauthoryearGonzalez-Delgado1999] González Delgado R.M., Leitherer C., Heckman T.M., 1999, ApJS, 125, 489
- [\citeauthoryearHammer et al.2001] Hammer F., Gruel N., Thuan T.X., Flores H., Infante L., 2001, ApJ, 550, 570
- [\citeauthoryearIm et al.2002] Im M., Simard L., Faber S.M., et al., 2002, ApJ, 571, 136
- [\citeauthoryearIsobe et al.1990] Isobe T., Feigelson E. D., Akritas M. G., Babu G. J., 1990, ApJ, 364, 104
- [\citeauthoryearJansen et al.2000] Jansen R.A., Fbricant D., Franx M., Caldwell N., 2000, ApJS, 126, 331
- [\citeauthoryearKauffmann et al.1993] Kauffmann G., White S.D.M., Guiderdoni B., 1993, MNRAS, 264, 201
- [\citeauthoryearKauffmann et al.2003] Kauffmann G. et al., 2003, MNRAS, 346, 1055
- [\citeauthoryearKennicutt1992] Kennicutt R.C., 1992, ApJ, 388, 310
- [\citeauthoryearKennicutt et al.2003] Kennicutt R.C., Bresolin F., Garnett D.R., 2003, ApJ, 591, 801
- [\citeauthoryearKewley et al.2001] Kewley L. J., Heisler C. A., Dopita M. A., Lumsden S., 2001, ApJS, 132, 37
- [\citeauthoryearKobulnicky et al.1999] Kobulnicky H. A., Kennicutt Jr. R. C., Pizagno J. L., 1999, ApJ, 514, 544
- [\citeauthoryearKobulnicky & Phillips2003] Kobulnicky H. A., Phillips A. C., 2003, ApJ, 599, 1031
- [\citeauthoryearKobulnicky et al.2003] Kobulnicky H. A., Willmer C.N.A, Weiner B.J., Koo D.C., Phillips A. C., Faber S.M., Sarajedini V.L., Simard L., Vogt N.P., 2003, ApJ, 599, 1006
- [\citeauthoryearKobulnicky & Zaritsky1999] Kobulnicky H. A., Zaritsky D., 1999, ApJ, 511, 118
- [\citeauthoryearKobulnicky & Koo2000] Kobulnicky H. A., Koo D.C., 2000, ApJ, 545, 712
- [\citeauthoryearLemoine-Busserolle et al.2003] Lemoine-Busserolle M., Contini T., Pello R., Le Borgne J.-F., Kneib J.-P., Lidman C., 2003, A&A, 397, 839
- [\citeauthoryearLequeux et al.1979] Lequeux J., Peimbert M., Rayo J.F., et al., 1979, A&A, 80, 155
- [\citeauthoryearLewis et al.2001] Lewis I., Balogh M., De Propis R., et al. 2002, MNRAS, 334, 673
- [\citeauthoryearLilly et al.2003] Lilly S.J., Carrollo C.M., Stockton A.N., 2003, ApJ, 597, 730
- [\citeauthoryearMadau et al.1996] Madau P., Ferguson H.C., Dickinson M.E., Gaivalisco M., Steidel C.C., Fruchter A., 1996, MNRAS, 283, 1388
- [\citeauthoryearMateo1998] Mateo M., 1998, ARA&A, 36, 435
- [\citeauthoryearMcCall et al.1985] McCall M.L., Rybski P.M., Shields G.A., 1985, ApJS, 57, 1
- [\citeauthoryearMcGaugh1991] McGaugh S. S., 1991, ApJ, 380, 140
- [\citeauthoryearMcGaugh1994] McGaugh S. S., 1994, ApJ, 426, 135
- [\citeauthoryearMehlert et al.2002] Mehlert D., Noll S., Appenzeller I., et al., 2002, A&A, 393, 809
- [\citeauthoryearMelbourne & Salzer2002] Melbourne J., Salzer J. J., 2002, AJ, 123, 2302
- [\citeauthoryearMilvang-Jensen et al.2003] Milvang-Jensen B., Aragon-Salamanca A., Hau G., Jorgensen I., Hjorth J., 2003, MNRAS, 339, 1
- [\citeauthoryearMouhcine & Contini2002] Mouhcine M., Contini T., 2002, A&A, 389, 106
- [\citeauthoryearOsterbrock1989] Osterbrock D.E., 1989, Astrophysics of Gaseous Nebulae and Active Galactic Nuclei (Mill Valley: Unvi. Sci.)
- [\citeauthoryearPagel et al.1979] Pagel B.E.J., Edmunds M.G., Blackwell D.E., Chum M.S., Smith G., 1979, MNRAS, 189, 95
- [\citeauthoryearPagel1997] Pagel B.E.J., 1997, Nucleosynthesis and Chemical Evolution of Galaxies (Cambridge: Cambridge University Press)
- [\citeauthoryearPettini2003] Pettini M., 2003, to appear in “Chosmochemistry: The Melting Pot of Elements” (astro-ph/0303272)
- [\citeauthoryearPettini et al.1998] Pettini M., Kellogg M., Steidel C.C., Dickinson M., Adelberger K.L., Giavalisco M., 1998, ApJ, 508, 539
- [\citeauthoryearPettini et al.2001] Pettini M., Shapley A. E., Steidel C. C., Cuby J., Dickinson M., Moorwood A. F. M., Adelberger K. L., Giavalisco M., 2001, ApJ, 554, 981
- [\citeauthoryearPilyugin2000] Pilyugin L. S., 2000, A&A, 362, 325
- [\citeauthoryearPilyugin & Ferrini2000] Pilyugin L. S., Ferrini F., 2000, A&A, 358, 72
- [\citeauthoryearPilyugin2001a] Pilyugin L. S., 2001a, A&A, 374, 412
- [\citeauthoryearPilyugin2001b] Pilyugin L. S., 2001b, A&A, 369, 594
- [\citeauthoryearPilyugin et al.2004] Pilyugin L. S., Vílchez J. M., Contini T., 2004, A&A, submitted
- [\citeauthoryearRicher & McCall1995] Richer M.G., McCall M.L., 1995, ApJ, 445, 642
- [\citeauthoryearRola et al.1997] Rola C. S., Terlevich E., Terlevich R. J., 1997, MNRAS, 289, 419
- [\citeauthoryearSaviane et al.2002] Saviane I., Rizzi L., Held E.V., Bresolin F., Momany Y., 2002, A&A, 390, 59
- [\citeauthoryearSchulte-Ladbeck et al.2003] Schulte-Ladbeck, R.E., Miller, C.J., Hopp, U., Hopkins, A., Nichol, R.C., Voges, W., Fang, T., 2003, to appear in “Multiwavelength Mapping of Galaxy Formation and Evolution” (astro-ph/0312069)
- [\citeauthoryearSeaton1979] Seaton M. J., 1979, MNRAS, 187, 73P
- [\citeauthoryearSkillman et al.1989] Skillman E.D., Kennicutt R.C., Hodge P.W., 1989, ApJ, 347, 875
- [\citeauthoryearSomerville & Primack1999] Somerville R.S., Primack J.R., 1999, MNRAS, 310, 1087
- [\citeauthoryearStasinska2002] Stasinska G., 2002, Revista Mexicana de Astronomia y Astrofisica Conference Series, 12, 62
- [\citeauthoryearStasinska et al.2001] Stasinska G., Schaerer D., Leitherer C., 2001, A&A, 370, 1
- [\citeauthoryearvan Dokkum & Ellis2003] van Dokkum P.G., Ellis R.S., 2003, ApJ, 592, 53
- [\citeauthoryearvan Zee et al.1998] van Zee L., Salzer J. J., Haynes M. P., O’Donoghue A. A., Balonek T. J., 1998, AJ, 116, 2805
- [\citeauthoryearVeilleux & Osterbrock1987] Veilleux S., Osterbrock D. E., 1987, ApJS, 63, 295
- [\citeauthoryearVilchez1995] Vilchez J.M., 1995, AJ, 110, 1090
- [\citeauthoryearZaritsky et al.1994] Zaritsky D., Kennicutt R.C., Huchra J.P, 1994, ApJ, 420, 87
- [\citeauthoryearZiegler et al.2002] Ziegler B.L., Bohm A., Fricke, et al., 2002, ApJ, 564, 69