X-ray flares reveal mass and angular momentum of the Galactic Center black hole
We have analysed the light curve of the two brightest X-ray flares from the Galactic Center black hole, one flare observed by XMM-Newton on October 3, 2002 (Porquet et al. P2003 (2003)), and the other flare observed by Chandra on October 26, 2000 (Baganoff et al. B2001 (2001)). The power density spectra show five distinct peaks at periods of 100 s, 219 s, 700 s, 1150 s, and 2250 s common to both observations within their estimated measurement uncertainties. The power density spectrum of the recently reported infrared flare of June 16, 2003 (Genzel et al. Ge2003 (2003)) shows distinct peaks at two, if not three, periods (including the 1008120 s infrared period), which are consistent with the X-ray periods. The remaining two periods could not be covered by the infrared measurements. Each period can be identified with one of the characteristic gravitational cyclic modes associated with accretion disks, i.e. either Lense-Thirring precession, Kepler orbital motion and the vertical and radial epicyclic oscillation modes, in such a way that a consistent value for the black hole mass of MBH = 2.72 106M⊙ and the angular momentum = 0.9939 is obtained. The available data on MBH derived from studies of the orbital motion of the S2 (S0-2) star (Schödel et al. S2002 (2002), Ghez et al. Gh2003 (2003)) agree with our findings. Finally we discuss some implications of the fairly high value for the angular momentum.
Key Words.:
Galaxy: center – X-rays: individuals: Sgr A* – X-rays: general – Radiation mechanisms: general(bra@mpe.mpg.de)
1 Introduction
The region towards the Galactic Center (GC) has been recently resolved in X-rays by Chandra measurements (Muno et al. MBB2003 (2003), Baganoff et al. BMM2003 (2003)). A source was identified as X-ray counterpart of the GC black hole Sgr A*. The quiescent X-ray luminosity turns out to be extraordinary low (2.21033 erg s-1, Baganoff et al. BMM2003 (2003)) for a mass accreting black hole, given its mass which has been measured through the motion of the S0-2 star orbiting the black hole. Mass values range from 2.2106M⊙ (lower limit of Schödel et al. S2002 (2002)), 3.6 106M⊙ (Genzel et al. Ge2003 (2003)) to 4.10.6 106M⊙ for a distance of 8 kpc (Ghez et al. Gh2003 (2003)). Various models to explain the low luminosity have been proposed and discussed quite controversially including low accretion rates and radiatively inefficient accretion flows, for example. For a brief overview see for instance Melia & Falcke (MF2001 (2001)), Baganoff et al. (B2001 (2001)), Porquet et al. (P2003 (2003)) and Yuan et al. (YQN2003 (2003)). The quiescent state is interrupted by occasional, sometimes very bright, flares. The first bright flare with a peak luminosity of 1 1035 erg s-1 (Baganoff et al. B2001 (2001)) was observed with the Chandra ACIS-I instrument on October 26, 2000. An even brighter X-ray flare with a peak luminosity of 3.61035 erg s-1 occurred on October 3, 2002 and was caught with the XMM-Newton EPIC instruments (Porquet et al. P2003 (2003)). It is generally accepted that the radiation is from or at least channeled through the accretion disk orbiting the central black hole. Some models for the creation of flares have been brought forward, e.g., Markoff et al. (M2001 (2001)) suggest extra electron heating near the black hole, Liu & Melia (LM2002 (2002)) propose a sudden enhancement of accretion and Nayakshin & Sunyaev (NS2003 (2003)) prefer stars passing the disk. We think that the high luminosity involved in the flares suggests that somehow the inner regions of the accretion disk play a major role, basically because of the increased gravitational potential. Sporadic events like flares are then likely to take us closer to the black hole and enable us to discover more easily periodic or quasi-periodic changes in the light curve of a flare, like the Kepler frequency of the innermost marginally stable orbit, and others, by which mass and angular momentum of the central black hole could be determined. That this idea might have some bearing has been recently demonstrated by the discovery of a 16.82 min period in two infrared flares (Genzel et al. Ge2003 (2003)). Genzel et al. tentatively assign the period to the length of the marginally stable orbit and, adopting a mass of 3.6 106M⊙, they calculate an angular momentum of = 0.5 for the black hole.
In section 2 we show the light curves of the two brightest X-flares, which we have analysed including but separated from the time sections before and after the flare proper, as well as two very long (11 hours and 46 hours) X-ray light curves representing the so-called quiescent state. Like the two flares one event was observed by XMM-Newton and the other event was covered by Chandra. These two observations were primarily analysed for cross-checking with the flare characteristics. Section 2 also contains the power density spectra (PDS) of the relevant light curves. Five groups of characteristic frequencies with at least two detections per group have been found. In section 3 we describe the relation of these periods with the cyclic gravitational modes thought to be possibly created in accretion disks, i.e. the Lense-Thirring precession frequency, the Kepler frequency and the vertical and radial epicyclic frequencies. In section 3 we also describe how we derive the values for MBH and the angular momentum (the Kerr parameter) from the frequencies measured. We include in our analysis the power density spectra of the two infrared flares published by Genzel et al. (Ge2003 (2003)). Finally we discuss a few implications which result from the fairly high value of we have obtained.
2 Observations and analysis
2.1 Light curves
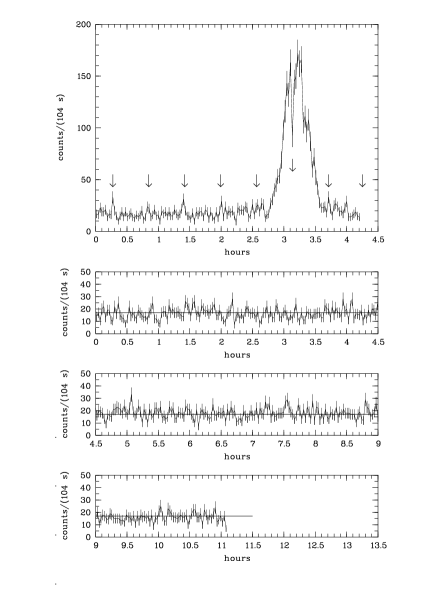
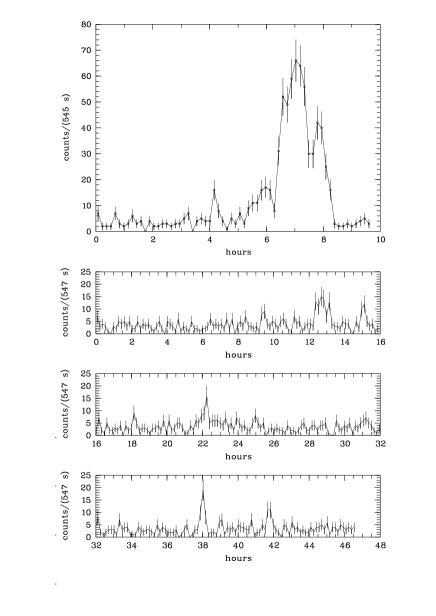
Figure 1a shows the light curve of the October 3, 2002 flare observed by XMM-Newton and published by Porquet et al. (P2003 (2003)) with a slightly different time binning. Figure 1b shows the light curve of an 11 hours quiescent period obtained by XMM-Newton on February 26, 2002. Figure 2a displays the light curve of the very first flare reported from Sgr A* dated October 26, 2000, observed with Chandra and published by Baganoff et al. (B2001 (2001)). We choose a slightly different energy band and a different binning. Sgr A* was observed for 46.5 hours on May 5/6, 2002 without a bright flare occurring, and the Chandra light curve is shown in Figure 2b. Because of the numerous peaks the source is apparently not in a true quiescent state but exhibits quite a number of smaller flux increases or small flares. The essential observational details are summarized in Table 1. The XMM-Newton data have been proprietary PI data, which by now are publicly available. The Chandra data have been extracted from the public Chandra archive (level 2 processed event list, provided by the Chandra X-ray Center). We restrict our analyses to just these four data sets because they cover the two brightest flares and the other two observations have the longest exposure of the so-called quiescent state. For the timing analysis we added PN, MOS1 and MOS2 data in one set using counts, which were for XMM-Newton extracted from a circle of 10′′ radius with energies between 2.6 - 10 keV. For the Chandra data the extraction radius was 1.5′′ around the archived source position, and the energy band is 2.0 – 8 keV.
| Instr. | observ. | total | flare | preced. | sampl. |
|---|---|---|---|---|---|
| time | time | time | time | ||
| date | (min) | (min) | (min) | (s) | |
| I | 03/10/02 | 254.1 | 56.33 | 197.8 | 2.6 |
| I | 26/02/02 | 667.2 | – | – | 2.6 |
| II | 26/10/00 | 589.3 | 115.3 | 372.4 | 3.241 |
| II | 25/05/02 | 2804.2 | – | – | 3.141 |
Because of the relatively broad point spread function of XMM-Newton the extraction radius of 10′′ contains emission from more objects than just Sgr A*. The Chandra image reveals another four or five additional sources as well as diffuse emission. Baganoff et al. (BMM2003 (2003)) estimate a net count rate of 5.740.40 10-3 count s-1 for Sgr A* in its quiescent state. The power law spectrum has a photon index of = 2.7 and an absorbing column density NH,q =9.8 1022 cm-2. Using the best fit values we estimate a Sgr A* quiescent state count rate of 0.029 0.003 count s-1 for MOS 1+MOS 2+PN, so that the conversion factor is 5 0.5 between the two instrument combinations. The mean EPIC count rate of Sgr A* in its quiescent state amounts to 0.16 count s-1 (c.f. Fig. 1b), which means that the background sources are likely to contribute on average 0.013 count s-1 or 82% of the total during the Sgr A* quiescent state, provided that neither the background sources nor Sgr A* have changed significantly compared to the October 26, 2000 observation. When we subtract the count rate of the background from the flare observation (fig. 1a) the peak count rate during the time preceding the actual flare has a level of 0.1250.03 count s-1, which means that the precursor section is 4 times brighter than Sgr A* in its quiescent state. It is interesting that flares observed in the infrared by Genzel et al. (Ge2003 (2003)) show about the same ratio of the flare peak intensity and the quiescent level. This suggests that the X-ray precursor and the infrared flares originated in the same process and that, given the huge X-ray flares, much brighter infrared flares still await their detections.
Conversion of instrument count rates to flux density requires knowledge of the source spectrum and column density of the photoelectrical absorption. This is available for the quiescent state measured by Chandra (Baganoff et al. BMM2003 (2003)), the October 26, 2000 flare measured by Chandra (Baganoff et al. B2001 (2001)) and the October 3, 2002 flare measured by XMM-Newton (Porquet et al. P2003 (2003)). Since both the spectrum and the absorption column density differ among the three observations we provide conversion factors for the EPIC count rate and the ACIS-I count rate for each of the three states. These are: 9.5 Jy (EPIC counts/s)-1, 47.6 Jy (ACIS-I counts/s)-1 (quiescent); 0.5Jy (EPIC counts/s)-1, 2.8Jy (ACIS-I counts/s)-1 (Chandra flare); 12.3 Jy (EPIC counts/s)-1, 71.8 Jy (ACIS-I counts/s)-1 (XMM-Newton flare). The relatively large uncertainty of the conversion factor for the Chandra flare are due to the uncertain spectrum and column density. The energy flux densities are given for E = 1 keV.
2.2 Power spectra
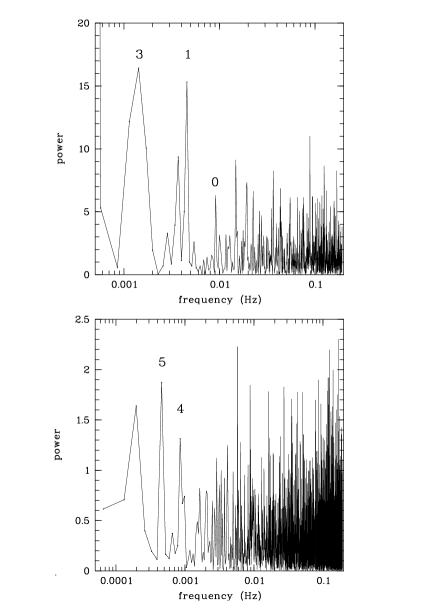
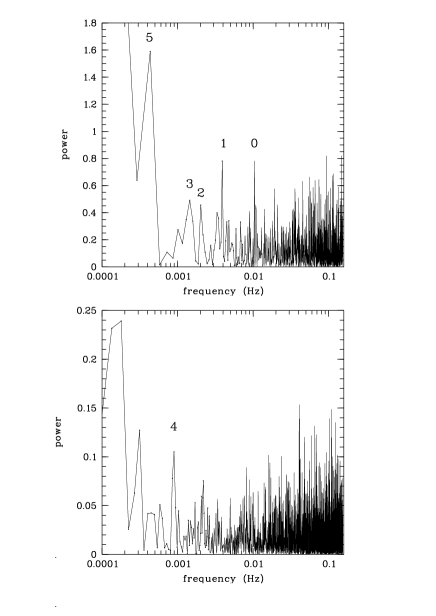
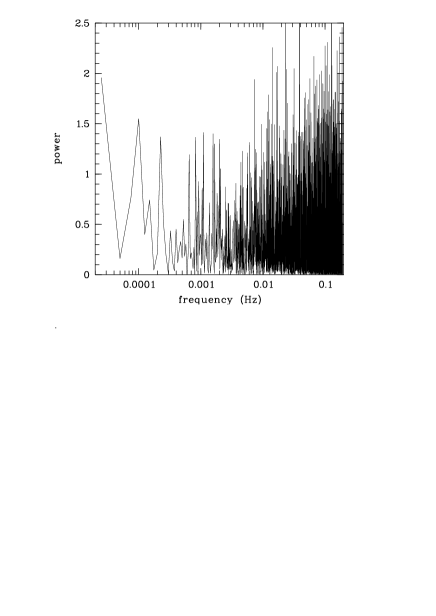
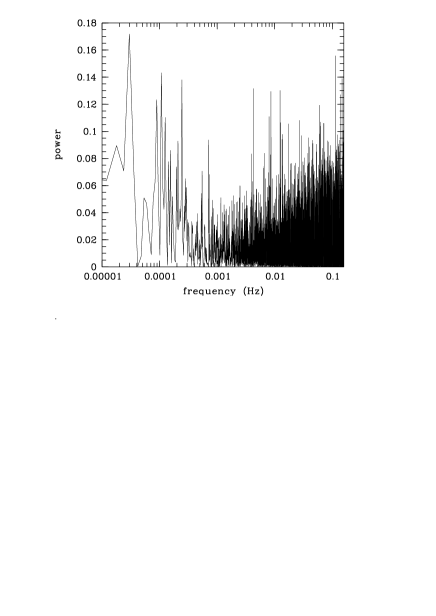
From the light curves shown in Figures 1 and 2, power density spectra (PDS) have been created by a Fourier analysis of six data sets. Two sets cover the time section of just the flare, one each for XMM-Newton (Fig. 3a) and Chandra (Fig. 4a); another two sets cover the time sections before and after the flare (Figs. 3b and 4b). For these PDS the data of the flare proper have been removed and replaced by data with a mean flux identical to that of the time preceding the flare assuming a Poissonian statistical distribution. The final two sets correspond to the two observations of the quiescent level (Figs. 5 and 6). We define the power spectral density psdn at a frequency fn and wave number n as psdn = (a+b)/(2; an and bn are the Fourier coefficients, is the sampling or binning time and is the total observing time (Table 1). The Fourier coefficients are in units of ACIS-I count s-1 for the Chandra observations and EPIC count s-1 for the XMM-Newton observations. Because of the different efficiencies the psdn’s are expected to generally differ by a factor of 255 for the same luminosity level given the energy spectrum described in section 2.1.
2.3 Frequencies
In general the six PDS look very much alike. There is a high frequency component which is more or less
rapidly growing with increasing frequency, which reflects the noise introduced by the
low counting statistics. We note that the smallest possible binning has been chosen so that we deal
with just no or one count per bin. At low frequencies the PDS are dominated by a few high peaks,
which summarize the mean shape of the light curves, averaged over periods which are just a few times shorter
than the whole track. Clearly separated from these two regimes is
a low noise mid-frequency section between 0.7 mHz and 7 mHz
for the flare observations (Fig. 3a and 4a),
and 0.7 mHz and 2.5 mHz for the flare precursor sections (Figs. 3b and 4b).
In this frequency band we see two distinct PDS peaks
at 1.426 mHz and 4.562 mHz (Fig. 3a; labels 3 and 1, respectively; XMM-Newton flare)
and similarly at 1.445 mHz and at 3.902 mHz (Fig. 4a; labels 3 and 1, respectively; Chandra flare),
standing well above the noise level in the corresponding frequency bands. In the Chandra flare
we see a third peak at 10.41 mHz (label 0), which, however,
is located at the beginning of the climbing high frequency noise section (Fig. 4a). The
XMM-Newton flare PDS shows a similar close-by peak at 9.12 mHz (label 0),
although at a fairly low power level. Like in the Chandra case
this frequency is at the high frequency edge of the low-noise
band. The existence of this pair of frequencies might be doubtful but they should be noted
basically because they seem to appear in two different observations.
These are the only pairs in the flare section.
Absent in the XMM-Newton PDS but fairly prominent in the Chandra PDS (Fig. 4a)
is a peak at 2 mHz (label 2).
The PDS of the data preceding the flare also show distinct peaks in the low noise regime at
0.853 mHz (Fig. 3b, label 4; XMM-Newton)
and 0.895 mHz (Fig. 4b, label 4; Chandra);
a further peak appears in the XMM-Newton PDS at 0.459 mHz (label 5).
The power at this frequency is so high that the equivalent period of 2178 s can be identified by peaks
in the light curve (c.f. arrows in Fig. 1a). A PDS peak associated with or close to 0.459 mHz is clearly
absent in the Chandra flare precursor observation but there is a peak at 0.434 mHz
in the Chandra flare (label 5).
The PDS is a function of discrete frequencies given by fn = with 1) and t the binning size. Therefore, there is in principle a systematic relative frequency uncertainty possible of = . In Table 2, we summarize the results including frequency , wave number , period , power spectral density psd and a label ID, which has the same value for frequencies close to each other. The same ID’s are shown as labels in the PDS graphs. We find in the XMM-Newton and the Chandra observations five groups of periods, each of which is a pair with one member from XMM-Newton and one from Chandra. The periods of the members of each pair are almost identical, i.e. 110/96 s (label 0), 219/256 s (1), 701/692 s (3), 1173/1117 s (4), 2178/2307 s (5). They appear to be not exactly identical but conceding the maximal possible uncertainty they are consistent with each other. This coincidence strongly supports their existence and suggests that each pair represents the same process.
| State/ | |||||
| Instrum. | f | n | P | psd | ID |
| (mHz) | (s) | 1) | |||
| flare | |||||
| XMM | 9.123 | 32 | 110 | 6.3 | 0 |
| Chandra | 10.41 | 72 | 96 | 0.78 | 0 |
| XMM | 4.562 | 16 | 219 | 15.3 | 1 |
| Chandra | 3.902 | 27 | 256 | 0.78 | 1 |
| XMM | - | - | - | - | - |
| Chandra | 2.023 | 14 | 494 | 0.46 | 2 |
| XMM | 1.426 | 5 | 701 | 16.4 | 3 |
| Chandra | 1.445 | 10 | 692 | 0.49 | 3 |
| XMM | na | na | na | na | na |
| Chandra | 0.434 | 3 | 2307 | 1.6 | 5 |
| precursor | |||||
| XMM | 0.853 | 13 | 1173 | 1.3 | 4 |
| Chandra | 0.895 | 20 | 1117 | 0.11 | 4 |
| XMM | 0.459 | 7 | 2178 | 1.9 | 5 |
| Chandra | - | - | - | - | - |
| IR flare | |||||
| IR/16 | 4.76 | 24 | 214 | - | 1 |
| IR/15 | 2.0 | 6 | 498 | - | 2 |
| IR/16 | 1.39 | 7 | 733 | - | 3 |
| IR/15 | 1.0 | 5 | 996 | - | 4 |
| IR/16 | 0.99 | 5 | 1026 | - | 4 |
Genzel et al. (Ge2003 (2003)) have published the discovery of a 16.82 min
period in the two infrared flares observed
on June 15 and June 16, 2003. A look at the two published PDS shows
that there are more peaks, which we have read off from
their figure 2c and added to Table 2 (IR/15, IR/16).
Except the peak at 321 s and wave number n = 16, appearing in the
June 16 flare,
each frequency has a close-by counterpart in the XMM-Newton and/or
Chandra PDS adding another finding to groups 1, 2, 3 and 4. Of course, the psd at 214 s
in IR/16 is fairly low but it shows up as a local maximum. There is no peak at the frequencies of group 5
in the infrared observations, which however have been too short to search for it. Obviously, the infrared
frequencies are fully consistent with the X-ray frequencies.
We note that at none of the frequencies selected from the flares or precursors a prominent psd is evident in the quiescent level observations. The PDS of the quiescent level observations are shown in Fig. 5 (XMM-Newton) and Fig. 6 (Chandra). The XMM-Newton PDS shows a set of six prominent PDS peaks between 0.65 mHz and 2 mHz centered on 1 mHz. This frequency band embraces the 0.853/0.895 mHz peaks of both the XMM-Newton and Chandra flare precursors. The psd’s at the six frequencies vary between 1.05 and 1.42 (EPIC count s-1)2 Hz-1 which is close to what is observed as power for the 1173 s period for the flare precursor (Table 2). A psd peak at the period of 2178 s is not present in the quiescent observations. The PDS of the Chandra quiescent level observations doesn’t show prominent peaks around one mHz (Fig. 6). But extrapolating the XMM-Newton psd of 1.2 (EPIC count s-1)2 Hz-1 the equivalent Chandra psd is expected to be close to the noise level.
The lowest frequencies accessible for this investigation are covered by the Chandra May 25, 2002 observation, with no bright flare though (Figure 6). Starting at 0.1 mHz the psd drops rapidly with frequency reaching the noise level minimum at 0.4 mHz. The region between 0.18 mHz and 0.35 mHz seems to show excess power peaking at 0.24 mHz or 4100 s. In this band the XMM-Newton PDS is very similar to the Chandra PDS with fairly high peaks at 0.225 mHz and 0.1 mHz, but details like in the Chandra observation are not resolved because of the shorter exposure (Figure 5). This PSD structure is probably not related to the occurrence rate of flares, which has been estimated to 1.20.6 per day by Baganoff (B2003 (2003)), which is a factor of about 17 lower in frequency. Excluding the 0.18 mHz – 0.35 mHz band the PDS, with 20 single psd values remaining, can be fitted by a power law with an index of roughly 2.3. We stress that the statistics are poor and we don’t claim the existence of a QPO but the excess between 0.18 mHz and 0.35 mHz looks like a QPO structure. QPO’s (quasi-periodic oscillations), which show up as a band of increased psd above an underlying, much broader PDS, which has the shape of a power law, have been observed in a number of galactic binaries, containing a compact object like a neutron star or black hole. The QPO’s are considered to be created in associated accretion disks (e.g., van der Klis, vdK2000 (2000)). As Nowak & Lehr (NL1998 (1998)) and others have pointed out, QPOs arising from supermassive black holes in AGN are expected to show periods between three hours and years, if a 0.1 s period is typical for a galactic black hole and if periods scale with mass. Such long periods are very difficult to measure for current missions. But for the Galactic Center black hole with its fairly low mass QPO periods might be shorter. In fact, if we scale the 300 Hz, which is the highest QPO frequency observed in the 7 M⊙ black hole microquasar GRO J1655–40 (Remillard et al. RMC1999 (1999), Orosz & Bailyn OB1997 (1997)) we expect a QPO around 0.6 mHz for the Galactic Center black hole, which is well within the long duration Chandra and XMM-Newton measurements.
2.4 Statistical significance
To quantify the significance of a measured psd value we have approximated the rather erratic flare light curves by some smooth functions which reproduce very well the general shape but do not introduce high frequency variations in the regime which contains the frequencies to be investigated. We are particularly interested in the frequencies of group 0 and group 1. The lower frequencies may be too much biased by red noise for which we don’t have a model. The model light curve of the XMM-Newton flare consists of three exponentials, one for the rise, one for the top and the third for the decay. The model light curve for the Chandra flare is set up by a four piece polygon. Each model light curve is normalized to the total number of measured counts. The model light curves are binned with the same sampling time as the measured data, and the model counts per bin are subject to Poissonian statistics. For each flare Z = 3105 light curves have been produced, Fourier analysed and the PDS calculated.
The significance of a power peak is defined via a confidence level S, which gives the probability that the detected power psdn,detect is not produced by the noise process, i.e. 1 - S = NW(psd psd (van der Klis, 1989). W is the ratio of the number of powers exceeding psdn,detect and Z. Ntrials is the number of frequencies for which the PDS has been measured, which is 674 and 1066 for the XMM-Newton and Chandra flare, respectively. We stress that we have not made use of a fixed form for W like a or Gaussian distribution, but we built W by Monte Carlo simulations (c.f. van der Klis, 1989). The simulations show that there are some significant peaks, i.e. for group 0: S(96 s) = 0.989 whereas the psd at 110 s of the XMM-Newton flare is consistent with a noise created peak; for group 1: S(219 s) = 0.993 and S(256 s) = 0.947, which means that signals with the latter periods quite likely exist. There is just one more pair of close-by frequencies each of which shows a significant psd, which are at a period of 11.31 s with S(11.31 s) = 0.634 in the XMM-Newton flare and of 10.68 s with S(10.68 s) = 0.968 in the Chandra flare. This very short period should be kept in mind for future studies.
We also tried quite a few different model light curves but they do not change significantly the values for S given before.
3 Discussion
Five characteristic frequency groups have been discovered in the X-ray flares with their existence being supported by the fact that they have been found in more than one observation. We try to identify each of these frequencies with one of the oscillation modes which could occur in accretion disks surrounding black holes. As Nowak & Lehr (NL1998 (1998)) for instance point out there are four cyclic modes which could give rise to periodic or quasi-periodic changes in accretion disks. These modes are based on gravitation but it is an open question whether they would create changes of the light output at the very same frequencies. However, Nowak & Lehr (NL1998 (1998)) point out that the mode frequencies predominantly depend upon fundamental gravitational frequencies and are not strongly affected by hydrodynamic processes for thin disks.
3.1 Characteristic accretion disk frequencies
There are four cyclic gravitational modes associated with black hole accretion disks (Nowak & Lehr NL1998 (1998), equations 1 to 3 and Merloni et al. MVSB1999 (1999), equation 4), which are the Kepler frequency (), the disk perturbation frequencies in vertical and radial direction called vertical () and radial () epicyclic frequency and the Lense-Thirring precession frequency (). Each frequency depends on the central mass M, the angular momentum and the radial distance from the center. Equations 1 to 4 show the relations, for which the standard notation of c=G=1 is used. Physical length scales are in units of GM/c2 and angular frequencies are in units of c3/GM. = 1 is defined as the gravitational radius rg.
| (1) |
| (2) |
| (3) |
| (4) |
3.2 Arrangement of frequencies and modes
Equations 1 to 4 show that decreases monotonically with increasing and, on the contrary, for fixed, both and initially rise with , go through a maximum and then decrease with increasing . reaches its maximum at a radial distance denoted by = rVmax and takes its maximum value at a distance denoted by = rRmax. For any and fixed . This means that the shortest period is to be assigned to at the smallest possible which is the innermost marginally stable orbit at = rms defined by = 0. For each of the other frequencies there is a choice between = r, = r, = r, = r and = r. = r is excluded because r = r = 0 per definition. Whether could be generated at rms is hard to tell, but = r could approach = r or could even be lower than the frequency of any other mode, depending on . We have chosen three radial fix points, i.e. = rms, = rVmax and r = rRmax. In principle there is no preference for any except for = rms but we note that and do not vary a great deal with over a reasonable range of centered on rVmax or rRmax, respectively. In the following we use periods, i.e. PLT, PK, PV and PR instead of angular frequencies . Each observed period is now assigned to one mode at either rms, rVmax or rRmax each resulting in a relation between MBH and . If these assignments cover all observed periods within their measurement uncertainties, a common value of MBH and should emerge. Group 0 contains the shortest period of 110 s; if assigned to Pr = r an upper limit for M 1.78106M⊙ exists for 1, which is in conflict with the lowest value of 2.2106M⊙ published by Schödel et al. (S2002 (2002)). Therefore this ascription is excluded. The next longer period of 219 s implies an upper limit of M 3.55106M⊙ if assigned to Pr = r. This is within the range of values for MBH reported in the literature and suggests the assignment to Keplerian motion along the marginally stable orbit.
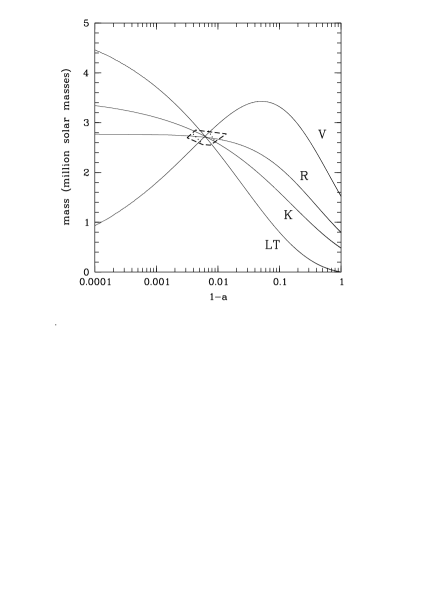
The only solution of equations 1 to 4 with consistent values for MBH and is obtained for the following assignation of period and mode: group 1, 219 s = P=r [K]; group 3, 692 s = P=r [V]; group 4, 1117 s = P=r [R]. With this set equation 4 predicts P 320 s. Such a period shows up with increased power in the June 16 infrared flare (321 s, Genzel et al. Ge2003 (2003), c.f. section 2.3). The four relations for MBH versus following from equations 1 to 4 are drawn in figure 7, which shows an almost perfect, single intersection of the four relations. The wide error polygon of figure 7 indicates the maximal range for MBH and (1 ) without the 321 s period and the inner polygon covers the constraints set by the 321 s period. This solution does not suggest a specific radius like rms, rVmax or rRmax for the remaining period of 500 s, but it is consistent with a Kepler period expected close to =rRmax. The periods of group 5 around 2200–2300 s, cannot arise from a region rRmax. However, we point out that this period is very close to just twice the period of the radial epicyclic mode and might indicate a dominance of the amplitude of every second cycle. We note that the group 0 period of 100 s is close to the first harmonic (m = 2) expected for the ’diskoseismology’ C-mode (Nowak & Lehr NL1998 (1998)).
The best-fit solution to the intersections is MBH = 2.72 106M⊙ and = 0.9939. The errors quoted are not 1 errors but reflect the maximal possible uncertainty given by the maximal uncertainties of the period determination. The radii involved are rms = 1.371 and rRmax =2.507. The gravitational radius (=1) amounts to 4.11011 cm.
Independent measurements of the orbital motion of the star S0-2 (S2) around the GC black hole have resulted in MBH = 3.71.5 106M⊙ (Schödel et al. S2002 (2002)) and MBH = 4.070.62 106M⊙ (R (Ghez et al. Gh2003 (2003)) with R0 the distance to the black hole. Our result is consistent with the Schödel et al. measurement at their 1 level and it also agrees with Ghez et al. ’s measurement at their 2 level and R0 = 8 kpc. Earlier Genzel et al. (GTK1996 (1996)) determined MBH to 2.5 - 3.0 106M⊙ from measurements of dark matter concentration in the central parsec of the Milky Way which appears to match our result best.
3.3 The high value of
The high value of 1 means that the emission from the inner parts of the accretion disk is quite close to the black hole. The event horizon is located at rH = 1.112. With rms = 1.371 the distance to the marginally stable orbit is just 3.6 light seconds. Light from matter crossing the marginally stable orbit is therefore very likely to disappear in a fairly short time. Is the PDS peak at 11 s the characteristic time scale at which the light is fading away? The light curve of the XMM-Newton flare (figure 1a) shows a deep, very short ( 100 s) cut close to maximum light, which might be such an event. A similar event is also seen in the Chandra flare (figure 2a). The arrows plotted in figure 1a point to the maxima of the 2178 s period, which seem somehow to synchronize with the deep cut in the light curve. According to our arrangement scheme the 2178 s period is characteristic for the radial epicyclic mode and it looks as if matter is pushed across the marginally stable orbit.
The high value of 1 and the proximity of the inner region to the event horizon also implies that fairly low (1) general relativistic boost factors have a major impact on the emission because of increasing beaming (e.g. Müller & Camenzind MC2004 (2004)). The radiation is not only shifted in frequency but the observed flux density (Fo) is significantly down-boosted compared to its rest-frame value (Frf) with Fo = (Lind & Blandford LB1985 (1985)) for a power law spectrum of energy index , which is 1.5 for the XMM-Newton flare (Porquet et al. P2003 (2003)). is to be averaged over an orbit, indicated by the overline, as varies along the orbit. For = 0.994, and a disk almost viewed edge-on at an inclination angle of = 70∘, varies between 0.064 and 0.834 at = rms and = 0.056, or the radiation received by the observer is reduced by a factor of 18 compared to its rest frame value. For larger radii the reduction factor approaches unity, but at = rRmax = 2.5 the radiation is still reduced by a factor of 1.7. The reduction becomes much more pronounced for disks viewed almost face-on. For = 15∘ 0.133 0.265 and 0.001. The Lense-Thirring frequency and the Keplerian motion at = rms have become unobservable like any other frequency close to the marginal stable orbit. At = 2.5, 0.038. Radiation from the innermost region is on average dimmed by a factor of some hundred, depending on the details of the radial brightness distribution. Because of the large reduction factors the observation of the inner regions of almost face-on accretion disks surrounding supermassive extragalactic black holes in AGN becomes progressively more difficult with increasing and/or decreasing . Maybe that this effect contributes to some extent to the faintness of the GC black hole.
Although we have no suggestion which physical process gives rise to the flare we constrain the region from where it comes. Since we see the light modulated with frequencies associated with the marginally stable orbit out to the maximum frequency of the radial epicyclic mode and in between the bulk of the emission arises from a region of 1.37 2.5, i.e. the innermost region of the accretion disk.
4 Conclusion
We have discovered five distinct periods in the power density spectrum of the XMM-Newton X-ray flare of October 3, 2002. One may wonder about the statistical significance, but these five periods, within their measurement uncertainty, also appear in the power density spectrum of the October 26, 2000 X-ray flare observed by Chandra, with perhaps one additional period which, however, does not show up in the XMM-Newton flare. Further evidence for the existence of these periods comes from the June 16, 2003 infrared flare (Genzel et al. Ge2003 (2003)). The power density spectrum shows a clear increase for at least two of the periods and possibly for a third period; the remaining two periods were not accessible to the infrared observations. Each of the periods can be identified with one of the four characteristic gravitational modes in accretion disks, i.e. Lense-Thirring precession, Kepler motion, vertical and radial epicyclic oscillation, in such a way that a common value for the black hole mass MBH and the angular momentum emerges, i.e., MBH = 2.72 106M⊙ and = 0.9939. The available data on MBH derived from studies of the orbital motion of the S0-2 star and the dark matter concentration in the center of the Milky Way are consistent with our result concerning MBH, which, by the way, is independent of the distance to the black hole. There are indications of a 100 s periodicity in the X-ray data, both in XMM-Newton and Chandra, but right now, we are reluctant to accept it as firmly established. For further progress in the X-ray domain a flare even brighter than the XMM-Newton flare is required, and in the infrared band the temporal resolution should be improved to 10 s. This is particularly important for simultaneous multi-wavelength observations.
Acknowledgements.
B.A. likes to thank Wolfgang Brinkmann, MPE Garching, for numerous inspiring discussions and Andreas Müller, LSW Heidelberg, for providing the relativistic boost factors. We are grateful to Andrea Merloni, MPA Garching, for pointing out to us the correct formula for the Lense-Thirring precession frequency. D.P. is supported by a MPE fellowship.References
- (1) Baganoff, F. K., Bautz M. W., Brandt W. N., et al. 2001, Nature, 413, 45
- (2) Baganoff, F. K., Maeda Y., Morris M., et al. 2003, ApJ, 591, 891
- (3) Baganoff, F. K 2003, American Astronomical Society, HEAD meeting, 3.02, 35
- (4) Genzel, R., Thatte, N., Krabbe, A., Kroker, H., Tacconi-Garman, L. E. 1996, ApJ, 472, 153
- (5) Genzel, R., Schödel, R., Ott. T., et al. 2003, Nature, 425, 934
- (6) Ghez, A. M., Duchêne, G., Matthews, K., et al. 2003, ApJ, 586, L127
- (7) Lind, K. R. & Blandford, R. D. 1985, ApJ, 295, 358
- (8) Liu, S. & Melia, F. 2002, ApJ, 566, L77
- (9) Markoff, S., Falcke H., Yuan F., et al. 2001, A&A, 379, L13
- (10) Melia, F. & Falcke, H. 2001, ARAA, 39, 309
- (11) Merloni, A., Vietri, M., Stella, L., Bini, D. 1999, MNRAS, 304, 155
- (12) Müller, A. & Camenzind, M. 2004, A&A, 413, 861
- (13) Muno, M. P., Baganoff, F. K., Bautz, M. W., et al. 2003, ApJ, 589, 225
- (14) Nayakshin, S. & Sunyaev R. 2003, MNRAS, 343, 15
- (15) Nowak, M. A. & Lehr, D. E. 1998, in Theory of Black Hole Accretion Discs, Cambridge University Press, eds. Abramowicz, M. A., Björnsson, G., Pringle, J. E., 233
- (16) Orosz, J.A. & Bailyn, C. D. 1997, ApJ, 477, 876
- (17) Porquet, D., Predehl, P., Aschenbach, B., et al. 2003, A&A, 407, L17
- (18) Remillard, R. A., Morgan, E. H., McClintock, J. E., Bailyn, C. D., Orosz, J.A. 1999, ApJ, 522, 397
- (19) Schödel, R., Ott, T., Genzel, R., et al. 2002, Nature, 419, 694
- (20) van der Klis, M. 1989, ’Timing Neutron Stars’, NATO ASI Series Vol. 262, eds. H. Ögelman & E. P. J. van der Heuvel, 27
- (21) van der Klis, M. 2000, ARAA, 38, 717
- (22) Yuan, F., Quataert, E., Narayan, R. 2003, ApJ, 598, 301