On the determination of age, and mass functions of stars in young open star clusters from the analysis of their luminosity functions
Abstract
Based on the CCD observations of remote young open clusters NGC 2383, NGC 2384, NGC 4103, NGC 4755, NGC 7510 and Hogg 15, we construct their observed luminosity functions (LFs). The observed LFs are corrected for field star contamination determined with the help of galactic star count model. In the case of Hogg 15 and NGC 2383 we also considered the additional contamination from neighboring clusters NGC 4609 and NGC 2384 respectively. These corrections provided the realistic pattern of cluster LF in the vicinity of the MS turn on point and at fainter magnitudes, revealed the so called H-feature arising due to transition of the Pre-MS phase to MS, which is dependent on the cluster age. The theoretical LFs were constructed representing a cluster population model with continuous star formation for a short time scale and a power law Initial Mass Function (IMF) and these were fitted to the observed LF. As a result we are able to determine for each cluster a set of parameters, describing cluster population (the age, duration of star formation, IMF slope, and percentage of field star contamination). It was found that in spite of the non-monotonic behavior of observed LFs, cluster IMFs can be described as the power law functions with slopes similar to Salpeter’s value. The present Main Sequence turn on cluster ages are several times lower than those derived from the fitting of theoretical isochrones to turn off region of the upper Main Sequences.
keywords:
keyword1: specification1 – keyword2: specification2 – … (see 4th issue of each volume)1 Introduction
Young clusters are natural laboratories for the study of various issues related to star formation processes, e.g., the initial mass function (IMF), duration of star formation etc. In recent years, some remote young clusters have been studied using CCD observations (e.g., see Sagar & Griffiths 1991, Phelps & Janes 1993, Sagar & Cannon 1995, Sagar & Cannon 1997, Sagar & Griffiths 1998, Sagar et al. 2001, Subramaniam & Sagar 1999, Sanner et al. 2001, Pandey et al. 2001, Piatti et al. 2002). These observations were used for the construction of color-color diagrams, color-magnitude diagrams (CMDs) and luminosity functions (LFs). These diagrams were used for the determination of cluster reddening, distance and age while the LFs were transformed to stellar mass spectrum, which can be identified with the IMF for young (age 100 Myr) star clusters. In these conventional studies of young star clusters, cluster age, LFs and MFs could not be determined accurately due to reasons discussed below.
Firstly, for reliable separation of cluster members from the foreground and background field stars present in the direction of distant ( kpc) clusters, accurate kinematic (proper motion and/or radial velocity) measurements are essential. Unfortunately, even present day most accurate Hipparcos proper motion data (available for brightest mag stars only) are not sufficient for this purpose. In such circumstances the field star contamination is removed statistically by observing comparison areas (blank fields) adjacent to the cluster field. It should be noted, however, that in most cases of the conventional general-purpose CCD photometry, which are not specially intended to e.g. the IMF study, such regions are not observed, and hence even statistical means of the data refining could not be used. This leads to a loss of information suitable otherwise for the LF construction.
The other problem in the CMDs of young star cluster is the precise determination of the Main Sequence (MS) turn off point, which is used for age determination, since for young clusters due to their small age, the upper MS is practically unevolved. Consequently, it becomes difficult to evaluate the accurate cluster age, and instead an upper estimate of the cluster age is provided. The difficulty is further increased by effects like stellar rotation and binarity, and by the morphology of the upper MS, which is practically vertical for early type stars in the colours , , or .
These problems can be avoided if the cluster age is estimated using the location of the MS turn on point, the place where Pre-MS stars join the MS in the cluster CMD. For a young coeval cluster this point resides about 7 mag fainter the brightest termination point of the MS. As a result of the deep CCD observations of the clusters, this region can be seen in the CMD, and hence is available for the analysis. Many of the above effects (except that of unresolved binaries) are much weaker in the turn-on point region, which makes the turn-on dating method to be more attractive than the turn off one. There are, however, practical problems in locating the turn-on point e.g., presence of strong field star contamination hides it more strongly than the brightest MS. The other limitation of the turn-on method is cluster age. As shown by evolutionary calculations, only for extremely young clusters with ages of order of a few Myr, the Pre-MS branch is raised sufficiently above the ZAMS and could be easily recognized in the CMD. For older clusters the Pre-MS branch deviation from the ZAMS diminishes with increasing age and could be seen better as a detail of the LF (as it is discussed in Sec. 2). At cluster ages exceeding that of the Pleiades, the Pre-MS branch could not be identified with confidence both in the CMD and in the LF and the turn on method cannot be applied (Belikov et al. 1998).
The other related issue is the fine structure of the stellar LF, located in the vicinity of the MS turn on point, which can mask the IMF shape if one does not take it into account. This feature can produce a false flattening or even depletion in the LF, which are frequently considered as an evidence of the flattening/turning over of the IMF (see Piskunov & Belikov 1996 for references). This in turn might have an important consequence with respect to the IMF universality and other similar issues. Since luminosity function of the turn on point depends on cluster age, the position of the LF detail also varies with time, and may be used as a kind of a standard candle for age determination from the LF analysis (Belikov & Piskunov, 1997).
Thus, the MS turn on region of young cluster CMDs is very important for cluster dating, or should be taken into account when one is analyzing the LF. It can be easily identified, however, only in the case of a few selected clusters. The well known examples of such clusters are NGC 2264, NGC 6530, ONC, and some others. Normally young and especially remote clusters, which are buried in rich foreground/background show, neither distinct turn ons nor PMS branches.
The aim of present study is to reveal the MS turn on point information hidden in the existing CCD observational data of 6 young open cluster using a new approach, which does not require observations of blank fields. It should be noted, that these clusters were subject of a conventional study, and many of them already have age and IMF determination. Unlike these studies, we will not convert observed LF to the IMF, but in order to avoid the above mentioned problems, we will construct theoretical LF, which should properly reflect the behavior of the observed ones in the vicinity of the MS turn on point. Wherever the field star contaminations could not be determined using the observations of an offset field region, they are estimated using galactic model for star counts for the surroundings of the cluster under study. Then the theoretical LF will be fitted to the observations by varying the star formation parameters describing actual stellar population (cluster age, star formation duration, IMF slope, a percentage of observed field stars). Considering its success, we hope that this approach can also be implemented to the other young open clusters having similar or more deep CCD data, which become presently available (see e.g. Kalirai et al. 2001).
In Section 2 we detail theoretical approach to LF of a young cluster and consider its fine structure in the context of current study. In the Sec. 3, we summarize the data used in the present work. Sec. 4 describes construction of the observed and theoretical LFs. We consider here the major effects which should be taken into consideration, define the model of cluster population and its parameters, and describe the fitting procedure. In Sec. 5 we discuss the derived results, and summarize them in Sec. 6.
2 Theoretical approach
Since stellar mass can be directly measured in very rare and specific cases, the IMF is not observed directly, but is converted from the observed distribution of stars over their absolute magnitudes , called LF . For a cluster of age (in years throughout the paper if not mentioned otherwise), the LF is related to the IMF via time-dependent mass-luminosity relation (MLR) as
| (1) |
Since cluster stars evolve off or approach to the MS with a rate which is dependent on their mass, apart from their stay on the MS, the cluster MLR should also evolve with time, being different at every moment from the standard one (usually adopted to be the MLR of the MS stars). This deviation is especially strong for red giant and Pre-MS stars. Besides, the ”instant” MLR has a definite fine structure due to presence of quasi-horizontal Post-MS and Pre-MS portions of corresponding isochrone. The structure itself is not too prominent to influence the LF, but it produces bumps and dips in the MLR derivative, and hence in the LF. The strongest fluctuation of the derivative occurs near the MS turn off point, but due to the small number of stars observed there they could not be easily distinguished from statistical fluctuations of the LF. In contrast, in the vicinity of MS turn on point, a sufficient number of stars coupled with strong MLR derivative bumping produce a feature, which can be observed in LFs of star clusters, which are young enough to display a branch of pre-MS stars. This detail was called by Piskunov & Belikov (1996) as H-feature, as it appears at the location, where the hydrogen burning starts in the cores of the pre-MS stars.
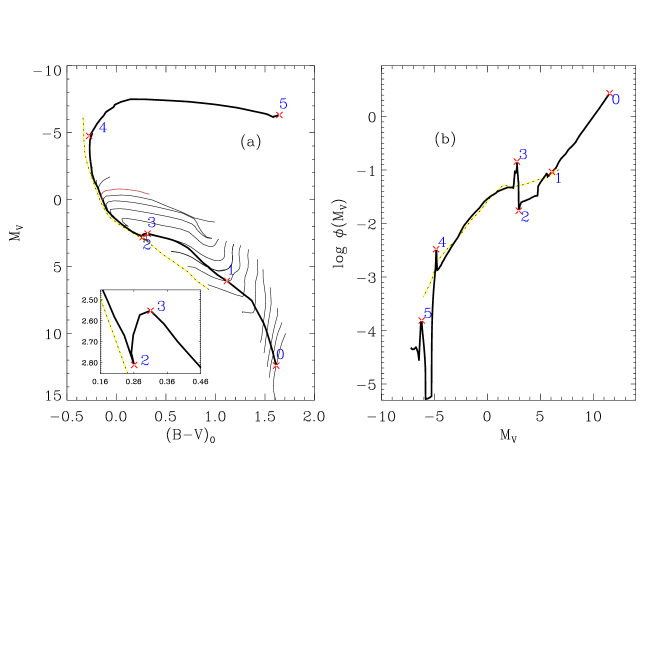
In order to get an idea on general structure of the LFs of young star clusters and their relation to main evolutionary stages of stars, we show in Fig.1 the CMD together with an isochrone of , and corresponding LF constructed according to eq. (1) with help of Salpeter IMF (). The isochrone was constructed from a set of stellar models described in Sec. 4.4. Our calculations show, that in general this behavior of the LF does not differ for various sets of models, but details (the size and amplitude of the LF fragments) may be somewhat different.
As one can see from Fig. 1 for young clusters the LF is non monotonic even for monotonic IMF, and consists of a number of monotonic portions related to different evolutionary stages. Comparison with evolutionary tracks shows that segment (0,1) of the LF corresponds to convective portion of a Pre-MS track, segment (1,2) to radiative one, (2,3) can be identified with MS turn on point in the CMD, and segment (3,4) belongs to the Main Sequence. Due to non-monotonic behavior of the isochrone near MS turn on point, the segment (2,3) is in fact a superposition of MS and Pre-MS stellar evolutionary stages and pure MS starts at somewhat brighter magnitudes. The last segment (4,5) corresponds to Post-MS stages of stellar evolution. We call hereafter for convenience purposes segment (1,2) as the LF H-dip, and segment (2,3) as LF H-maximum. For comparison in Fig. 1, we show position of ZAMS models of Tout et al. (1996), and ZAMS-LF constructed from these models. Good agreement between ZAMS- and LFs is observed between both turn-over points, but beyond MS both LFs differ considerably.
| Cluster | IAU | Area | Number | Refe- | ||||||
|---|---|---|---|---|---|---|---|---|---|---|
| number | () | of stars | (mag) | (mag) | (mag) | (mag) | rence | |||
| NGC 2383 | C0722–208 | 5 | 31.8 | 588 | 21.8 | 17.6 | 13.3 | 0.22 | 8.45–8.6 | [1] |
| NGC 2384 | C0722–209 | 5 | 27.8 | 256 | 20.9 | 18.9 | 13.2 | 0.22–0.28 | 7.1–7.3 | [1] |
| NGC 4103 | C1204–609 | 5 | 19.4 | 176 | 19.8 | 17.3 | 12.5 | 0.31 | 7.5 | [2] |
| Hogg 15 | C1240–628 | 2 | 6.9 | 337 | 21.7 | 19.6 | 16.5 | 1.15∗ | 6.78 | [3] |
| NGC 4755 | C1250–600 | 10 | 38.8 | 576 | 20.2 | 18.1 | 12.9 | 0.41∗ | 7.0 | [4] |
| NGC 7510 | C2309+603 | 6 | 38.4 | 423 | 21.1 | 16.8 | 16.0 | 1.12∗ | 7.0 | [5] |
∗ non uniform extinction
Since the absolute magnitude of a cluster MS turn on point evolves with time, the H-feature should move faint ward with increasing of cluster age. The feature not only moves to fainter magnitudes, but also degrades with time. As calculations of Belikov & Piskunov (1997) show it disappears completely for This puts a limit on the H-calibration applicability. Again the time scale of H-feature existence depends on specific models, and can be used for Pre-MS model verification. In principle this makes the LF of young clusters a good tool for cluster age determination.
An immediate conclusion, which could be drawn from the above analysis is that the existence of any bumps/gaps in the LF at or near the MS turn on point of young clusters should not be regarded as an evidence of non-monotonous behavior of the IMF. The existence of the Pre-MS detail in the LF may also result in the mis-interpretation of mass spectra of young open clusters. When the limiting magnitude of a survey falls within the radiative dip one could observe the LF turn-over, which can be wrongly interpreted as a consequence of data incompleteness or the IMF turnover. Similarly the steep slope of convective portion of the LF is not an evidence of the IMF steepening.
3 Observational data
We have used CCD photometric data of young (age several tens of Myr) remote and compact clusters presented in papers listed in Table 1 (hereafter referred as original papers). The small areas occupied by these clusters and their sufficiently deep photometry provide high degree of data completeness, which is very important for LF construction. However, their large distance coupled with lack of kinematic data prevent the separation of cluster members from the field stars and requires special approach to tackle this issue.
In Table 1 the parameters of the clusters under study are listed. Cluster designations are shown in columns 1 and 2, in column 3 we list values of cluster angular diameters taken from Lyngå (1987). The most of the other parameters are taken from the original papers mentioned in the last column. Columns 4 through 9 contain area covered by CCD frames, number of stars within the frames, limiting and completeness -magnitudes, apparent distance moduli and reddening values. Color excesses, marked with asterisks represent average values in variable extinction fields. In column 10 we show log(age) as it was determined in referred studies. We define limiting magnitudes of a survey as faintest magnitude of a star in cluster sample. Data completeness in magnitude are estimated following the procedure described in Sec. 4.3.
We compared original data of Table 1 with Lyngå (1987) catalogue and recent list of reddening values, distance moduli and ages, provided by Loktin111Loktin A.V., Gerasimenko T.P., Malysheva L.K., 2001, Homogeneous Catalogue of Open Cluster Parameters, Release 2.2. See also WEBDA database at URL http://obswww.unige.ch/webda/ (private communication, referred hereafter as LGM2.2). We find that the extinction values from Table 1 are in excellent agreement with the data of both catalogues and the average color excesses from different lists agree within a few hundredth of magnitude, except in the case of NGC 7510. In this case, the extinction data as in LGM2.2 differ from that of Table 1 by 0.26 mag. Original cluster ages also show reasonable agreement (with average spread of the order of a few tenths in ) for all clusters except NGC 2383, which according to both Lyngå (1987) and LGM2.2 has an age of a few tens of Myr.
Unfortunately such a good agreement is not observed in the case of cluster distances. Comparison with Lyngå (1987) referred distance estimations shows good agreement for all clusters, except NGC 2383 and NGC 2384, where data of Table 1 are overestimated by about 1 mag. The new scale of LGM2.2 indicates even stronger (up to 1.5 mag) disagreement for these and two more (Hogg 15, and NGC 7510) clusters. Though these disagreements are unpleasant, it is hardly avoidable as photometric distances of remote clusters are derived from a very steep upper MS. In present study we will use original distances, keeping above problems in mind.
The possible uncertainty in cluster age and the MF slope, which can be introduced by the data inaccuracy can be estimated from the following considerations. The most important for our LF-based analysis is accuracy in absolute magnitude . It depends on error in a distance modulus, reddening correction, and on a correction for metallicity effect. Since no metallicity measurements are published for clusters under study we can estimate this correction only indirectly. As the cluster galactocentric distances span over a range of 7–11 kpc (with the solar value assumed to be 8.5 kpc), the metallicity radial gradient in the galactic disk is absent according to data on Cepheids of Andrievsky et al. (2002). Thus we can accept solar heavy element abundance and avoid metallicity corrections. The spread of cluster metallicity can only be be due to galactic disk inhomogeneity, which according to Vereschagin & Piskunov (1992) is about . The corresponding absolute magnitude uncertainty due to metallicity effect is of order of mag. The standard accuracy of cluster apparent distance modulus is about 0.2 mag (Subramaniam & Sagar, 1999). The reddening uncertainty according to original papers is between 0.03 and 0.06 mag and only for NGC 7510 it exceeds ( mag) the upper limit. These cause the uncertainty to be typically about 0.1 – 0.2 mag and less than 0.3 mag for the complete sample. Thus we believe that aggregated uncertainty in absolute magnitude due to metallicity, interstellar extinction and distance modulus errors does not exceed 0.5 mag. This corresponds to a random error in of the order of 0.15 both for turn off and turn on dating methods. According to simulations of Belikov (1999) one can expect an error in the MF slope caused by mag is of order of 0.2.
The original CCD photometry was complemented with photoelectric magnitudes of brighter stars from the sources referred in original papers and/or from the WEBDA database. This extends the range of data completeness from a faint cluster-specific limit, discussed in Sec. 4.3 to the brightest in the observed field stars. Since the data in the -magnitude are the most complete we use in this study LFs constructed in only.
As one can see from Table 1, stellar fields covered by the frames are comparable with the cluster sizes provided in Lyngå (1987) catalogue. It should be noted however, that Lyngå (1987) provides only sizes of central parts of open clusters, which according to Kharchenko, Pakulyak & Piskunov (2003) are 2 to 3 times lower than their full size. Similar conclusions have also been drawn by Nilakshi et al. (2002) based on the spatial structure study of the open star clusters. Thus we should consider our samples only as inner population of the clusters, enhanced with massive stars (Kharchenko et al., 2003), and having flatter luminosity functions and mass spectra than outer population (de Grijs et al., 2002a, b, c).
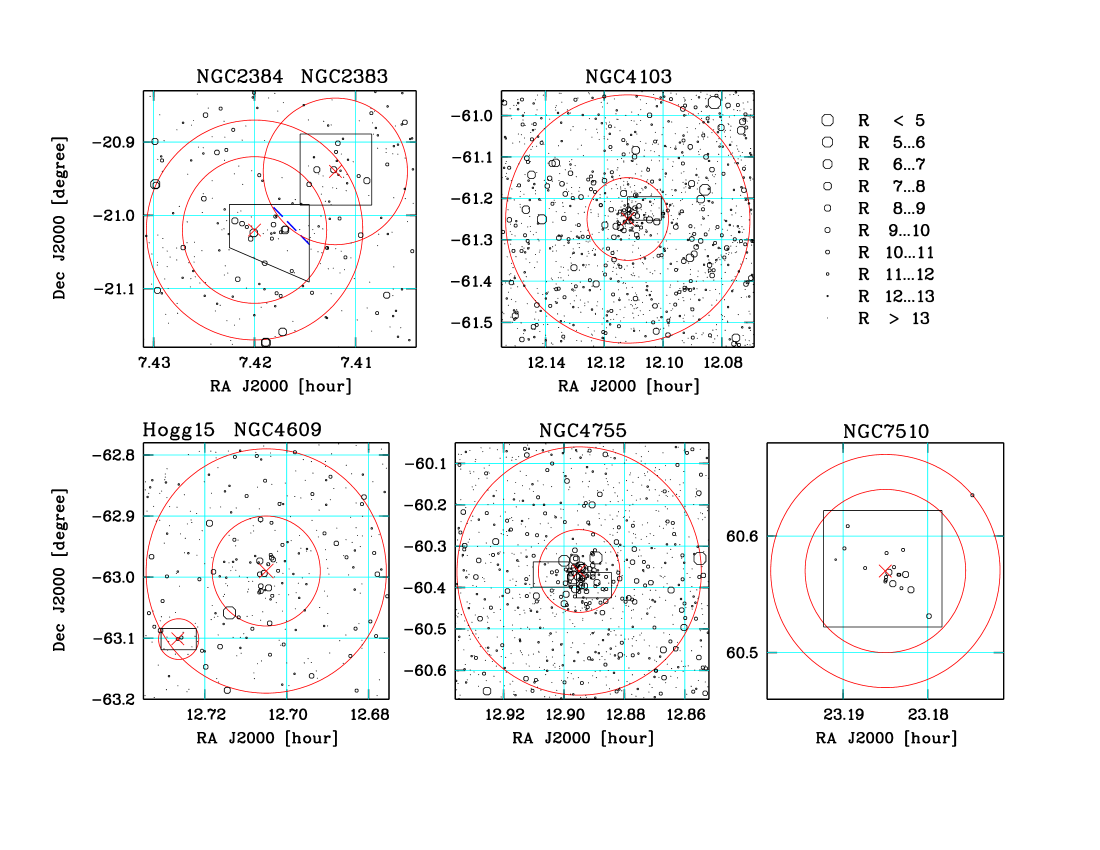
In Fig. 2 we show wide neighborhoods of the clusters under study. They are constructed with the help of all-sky catalogues ASCC-2.5222available at ftp://cdsarc.u-strasbg.fr/pub/cats/I/280A (Kharchenko, 2001) for brightest ( mag) stars, and UCAC1333available at ftp://cdsarc.u-strasbg.fr/pub/cats/I/268 (Zacharias et al., 2000) [FONAC444available at ftp://cdsarc.u-strasbg.fr/pub/cats/I/261 (Kislyuk et al., 1999) in NGC 7510 case] for fainter stars. In order to give a reader an idea on a relation of observed frames to cluster geometry we show in the maps, positions of cluster centers and borders of cluster cores and coronae, as determined by Kharchenko et al. (2003) from data on spatial distribution of cluster proper motion members from the ASCC-2.5. For NGC 2383 Kharchenko et al. (2003) failed to detect the core radius and the core is not shown in the cluster map. Since brightest stars of Hogg 15 are fainter than limiting magnitude of the ASCC-2.5, the data on the cluster center and radius were taken from Dias, Lépine & Alessi (2002) and Moffat (1974) respectively.
One can see from Fig. 2 that regions of two clusters (NGC 2383 and Hogg 15) are overlapped with their neighboring clusters. This should be regarded as a potential source of cluster sample contamination and should be kept in mind in further discussions. NGC 4755 is the only cluster, where observations are carried out in two separated frames located on both sides of the cluster center.
4 Observed and theoretical
luminosity
functions
Before comparing the empirical and theoretical LFs, it is necessary to correct observed LF for different biases mentioned earlier. Among the most serious effects influencing observed LFs are contamination of a cluster sample with non-members and data incompleteness. Generally the non-members are field stars projected onto the cluster area, but in some cases there would be stars from a neighboring cluster also. The data incompleteness has a strong dependence on the crowding/density of stars in the field and the stellar magnitude such that the data is less complete in crowded regions and towards fainter magnitudes (see e.g. Sagar & Richtler 1991). All these, as well as details of procedure for the construction of theoretical LF and fitting of theoretical and empirical LFs will be described below.
4.1 Field star de-contamination with galactic star
count model
Depending on cluster distance and on the properties of observed sample, one could apply different methods for the selection of cluster members. For nearby clusters, the kinematic method is the most common and reliable. For remote clusters the statistical selection with the help of adjacent stellar fields are used. Since there is no blank fields observed in the neighborhood of the most clusters under study, we use the Galactic star count models to estimate the field star contamination in their directions. Due to various perturbations (e.g. due to spiral arms) along line of sight, which can be hardly taken into account in details by the model, this approach appears to be crude at the first glance, especially for a study of the fine structure of the LF. A careful analysis indicates contrary to this apprehension however. It is well known that the leading role among a number effects influencing the predicted apparent stellar density, is played by interstellar extinction, as it is uneven over the galactic disk. For example the patchy behavior of the extinction is the major reason enabling observation of remote clusters in transparency windows. This is a basic point of our approach: since the extinction in a cluster direction could be derived with much more confidence when compared to an average extinction value in the disk, more realistic model predictions can be made in a cluster field than in an arbitrary stellar field. Below we describe the model components, discuss the degree of the model stability against the extinction and stellar density fluctuations, and compare the model predictions with data on selected test fields.
For each cluster, we compute a theoretical distribution of field stars with apparent magnitude , which is specific to the cluster parameters, including galactic coordinates, interstellar extinction towards the cluster, and normalized to the area of observed cluster region. We use the model described by Kharchenko & Schilbach (1996), and Kharchenko et al. (1997). The model treats the Galaxy as a system, which is symmetric both with respect to rotation axis, and to the equatorial plane, and consists of three populations (thin disk, the disk hereafter, thick disk and a spheroid). The population of thin disk consists of several sub-populations (MS stars, disk red giants, and super giants – stars of I and II luminosity classes). Each population group is described by its own stellar LF and spatial distribution. It is accepted that population LF does not depend on position within the Galaxy and is equal to its solar neighborhood counterpart. Density distributions of different populations are represented by Bahcall (1986) expressions for disk-like and spheroidal subsystems.
The LF for MS stars brighter than = 13 mag is taken from Scalo (1986) and Murray et al. (1997), while for fainter stars (19 mag) we used data given by Jahreiß & Wielen (1997) for nearby stars. The fraction of evolved stars, which have left MS phase (red giants and super giants) as a function of was taken from Scalo (1986). These values were modified at mag, mag according to the data of Holmberg, Flinn & Lindengren (1997) taking into account red giant clump, an equivalent of Population II horizontal branch for disk-population core helium burning stars. The LFs of the thick disk and spheroid and the star number density normalization {thin disk:thick disk:spheroid} are {1:0.02:0.00125} taken from Gilmore (1984). Additionally, results by Da Costa (1982) for globular clusters were used to model the influence of the horizontal branch on the spheroid LF.
| Cluster | |||
|---|---|---|---|
| (mag/kpc) | |||
| Hogg 15 | 302.0 | -0.2 | 1.00 |
| NGC 2383 | 235.3 | -2.4 | 0.38 |
| NGC 2384 | 235.4 | -2.4 | 0.41 |
| NGC 4103 | 297.6 | +1.2 | 0.59 |
| NGC 4755 | 303.2 | +2.5 | 0.92 |
| NGC 7510 | 111.0 | +0.1 | 1.13 |
We adopt the following general parameters of the model. The galacto-centric distance of the Sun is equal to 8.5 kpc; the ratio of axes of the spatial density distribution for the spheroid is equal to 0.85; the length scale of the disk subsystems and the height scale of the thick disk are equal to 4 kpc and 1.3 kpc respectively. We assume according to Schmidt (1963) and Scalo (1986) that the height scale of the disk for MS stars rises from 90 pc to 350 pc at interval [] mag, whereas for red giants, it changes from 250 pc to 400 pc at mag. The height scale of 90 pc was used for extremely young population of super giants.
Young open clusters are located in the galactic disk with irregular interstellar absorption and their extinction parameters differ from average Galactic values. This is a major reason for using in model calculations a cluster-specific absorption values , which were derived from Parenago (1940) formula
where is cluster distance from the Sun, is cluster galactic latitude, with taken from Table 1, and is height scale of the extinction layer assumed to be equal to 100 pc555See paper of Kilpio & Malkov (1997) for recent discussion of the extinction formula parameters.. Values of together with cluster galactic coordinates are shown in Table 2.
In order to illustrate the decisive role of the reddening effect in the model counts construction, we have confronted our results to calculations with a standard value of galactic specific extinction mag/kpc, adopted for the galactic disk. As shown by the comparison, for all clusters in the working magnitude range of mag, the overestimation of specific extinction leads to considerable underestimation of the model density. The corresponding model curves differ in working magnitude range for different clusters by = 0.3 – 0.8 (i.e. by 70 to 180 %). The model stability with respect of observed errors in the value of specific extinction was evaluated by variation of values of from Table 2 by 0.2 mag/kpc. According to Sec. 3 this value can be regarded as upper limit of error in specific extinction values in our sample. We have found that in this case the model counts variations are of order of for all clusters under study.
In order to estimate the effect of spatial density fluctuations, we consider galactic spiral arms as the most pronounced galactic disk sub-structures. We have carried out model calculations for cluster areas with and without the effects due to spiral arms. We considered three local arms (Sagittarius-Carina, Orion and Perseus ones) represented by logarithmic spirals with parameters taken from Marochnik & Suchkov (1984). It was assumed, that the density input from the spiral structure is equal to , where is regular density profile in the disk, and is a scaling factor, taken to be equal to 0.1, 0.2, and 0.3. The model calculations show that for all clusters in the working magnitude range, the influence of the spiral arms on the stellar density is negligible. The corresponding increase of is about 0.05 for , and less than 0.02 for . These values indicate that the effect of density fluctuation is much weaker than the extinction.
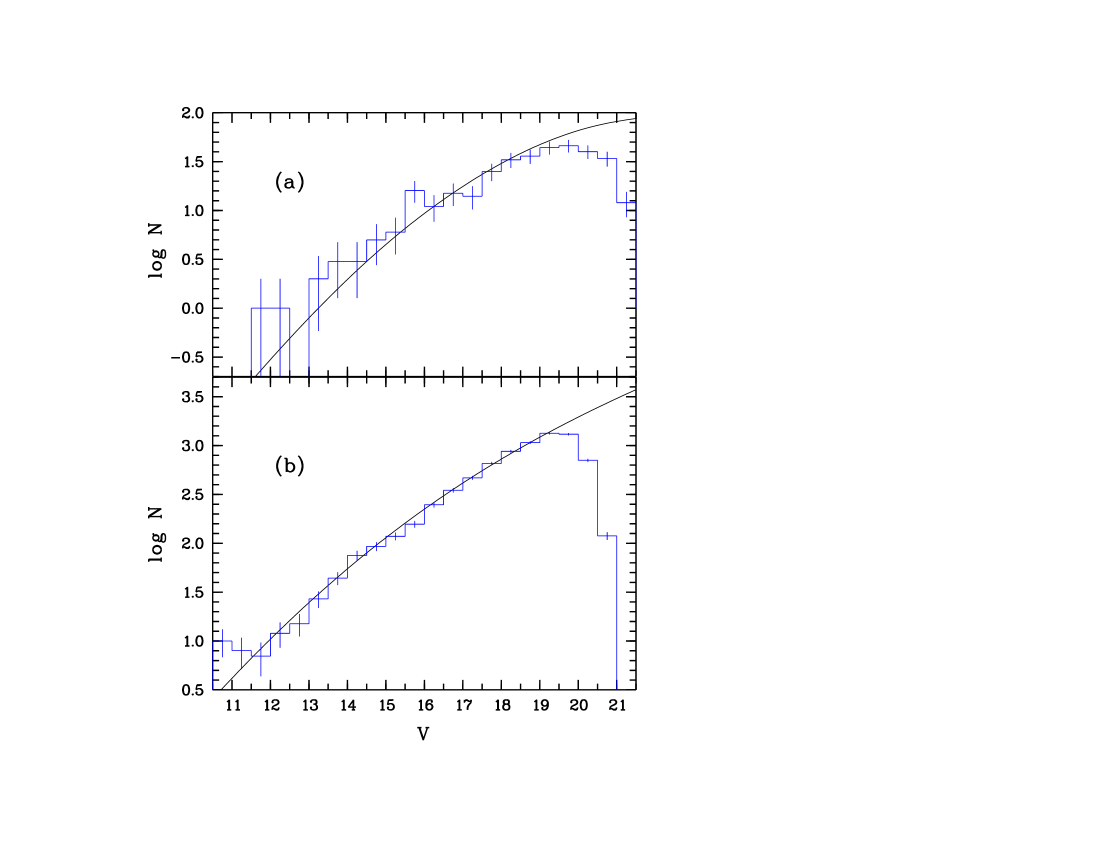
At last we compare our model calculations with observed stellar counts in selected stellar fields. Unfortunately among the clusters of our sample only observations of NGC 2383/4 are supplied with photometry in the blank field containing about 300 stars. The field is about 5 ′away from the clusters and thus is partly overlapped with NGC 2383/4 areas (cf. Fig. 2). For model calculations we used data for this cluster from Table 2. Corresponding distributions are compared in Fig. 3(a). One can observe reasonable qualitative agreement of empirical and model distributions. According to -test the both distributions agree at 80-percent significance level. Small and generally insignificant access of brighter stars ( mag) can be attributed to the admixture of NGC 2384 stars.
An excellent opportunity for verifying of our model provides wide-field CCD-photometry of more than 17 000 stars in the field of NGC 7654, published by Pandey et al. (2001). The photometry covers an area of 4040 arcmin2, centered at the cluster with a size of about 24 ′. This leaves a wide circular blank field area, enabling not only to confront the model counts and observations, but also to estimate the stochastic variations of circumcluster fields themselves. It is worth to note, that NGC 7654 is located only about 1 degree North of NGC 7510, a cluster of present sample.
In Fig. 3(b) we show observed and model distributions for NGC 7654 blank field area. Although Pandey et al. (2001) do not provide explicit value of the cluster radius, their density profiles show that there is no sufficient cluster population at . For construction of the observed distribution we use all stars located at , but the stars from the SE segment of the circumcluster area are not considered. This is where the neighboring cluster Czernik 43 having radius of about of 10 ′is located, according to Kharchenko & Piskunov (2003). The cluster-specific model parameters ( pc, and mag/kpc) were taken from data for NGC 7654 of Pandey et al. (2001). Since there are indications of outward increase of the cluster reddening, we used the upper limit provided by Pandey et al. (2001) values. As one can see from Fig. 3(b) the agreement between the model and observations is good. According to -test the both distributions agree at 90-percent significance level in the range 12–19.5 mag. In order to estimate the degree of stochastic variations of circumcluster population we arbitrarily divided the whole blank field into two equal parts and compared them to the united field separately. The -test has shown that their statistics is somewhat different: they are the same as the total distribution on 85-percent level. This indicates that the model counts approach to the member selection is at least not worse than the blank-field method based on an arbitrary sampled test area.
Theoretical differential distribution of stars with apparent magnitude , derived with help of this model were used for construction of reduced LFs as it is described in Sec. 4.5
4.2 Contamination by an overlapping cluster
The contamination by an overlapping cluster is studied using the projected density derived from stellar counts in recent all sky catalogues. The star counts in the USNO-A2666Monet D., Bird A., Canzian B. et al., USNO-A 2.0:A Catalog of Astrometric Standards (CD-ROM distribution). US Naval Obs., Washington, 1998. catalogue is strongly affected by crowding effect in the areas of Hogg 15 and NGC 2383/2384 clusters (which is not surprising for Schmidt camera based surveys in dense fields). To avoid crowding effect we used astrograph based catalogue UCAC1. This catalogue is a part of all-sky survey UCAC, covers Southern Hemisphere south to , and contains the fields under study.
NGC 2383/2384 lie at the very edge of the survey UCAC1 area, where only short exposures provide star counts homogeneity and completeness at mag. We constructed density profiles in a field centered at the NGC 2384. In order to estimate the proper stellar density in a cluster, we counted stars in four quadrants separately. The average observed star densities in the field and in NGC 2384 corona areas were determined from the counts in the first and forth quadrants of the corresponding areas located at and within and from the cluster center which are free from contamination of NGC 2383 members. As the values of and do not strongly vary over the studied area, the density of NGC 2383 cluster members can be calculated as ( is counted within NGC 2383 frame). The star density of the corona of NGC 2384 itself, then is . The results are shown in Table 3 and one can see that contamination of NGC 2383 member sample with stars of NGC 2384 cluster computed as is about 24%.
| Population | Projected density () | Designation | |
|---|---|---|---|
| NGC 2383 | Hogg 15 | ||
| Observed (total) | 2724 | 6077 | |
| Field stars | 932 | 1870 | |
| Neighbor+field | 1273 | 2401 | |
| Neighbor | 341 | 531 | |
| Cluster | 1451 | 3676 | |
We cannot estimate the contamination of NGC 2384 member sample with stars of NGC 2383 cluster as there are no stars with mag within NGC 2384 frame piece overlapping with NGC 2383 cluster. Moreover, this frame piece is small and we can assume insignificant number of NGC 2383 members there.
Similar procedure was applied to Hogg 15 cluster. The counts were performed down to mag. The average observed density in corona of NGC 4609, was computed from the stellar counts at distance , and average observed density of the field stars at from the center of NGC 4609. As one can see from Table 3, Hogg 15 is contaminated with NGC 4609 stars by about 14%. This fraction is smaller than in the NGC 2383 case, but is not negligible.
4.3 Incompleteness effects
It is well known, that completeness of a photometric survey is achieved only at about 2 mag brighter than (so called completeness limit ). Below the observed LF does not reflect behavior of a genuine LF, and this magnitude range should be excluded from the consideration. It is also important to be confident, that for clusters, having observations in two CCD frames both fields have the same completeness limit. Unfortunately, no determinations were made in original papers. This forced us to determine the within this study. Since no test fields were observed in original papers we are only able to estimate roughly the completeness limit as a position of apparent maximum in the distribution of stars with magnitude within observed frames. Since the incompleteness increases gradually, the above estimate should be considered as upper limit of .
The estimated values of are shown in Table 1. For NGC 4755 we find good agreement between in both observed frames. Note, however, that the frames do not include the central area of the cluster, containing the brightest cluster members. This causes another kind of incompleteness i.e. incompleteness for bright stars. One should keep this in mind when the final result for this cluster is discussed. In contrast the frames of other clusters are located in central regions and no bright star incompleteness is expected there.
The other kind of incompleteness, which should be considered is incompleteness due to overlapping of stellar images in the CCD frame, which we call here as ”crowding effect incompleteness” (see Sagar & Richtler 1991 for details). It arises due to finite size of stellar images which depend on stellar brightness. An image of a star of some brightness occupies certain area within the CCD frame, hides some neighboring stars of lower brightness, and excludes them from the statistics, affecting the brightness function , a distribution of stars with apparent magnitude. The relation between corrected for the crowding effect brightness function and observed one is expressed as
Here is the magnitude of the brightest star in the frame, is an area occupied in the frame by an image of a star of magnitude . Both and are expressed in units of the frame area. We have evaluated the crowding effect for each cluster of our sample. The functions were found empirically for every frame from the image statistics as , where is average minimum distance in the plane of a frame from stars of magnitude to remaining stars. As we found for the considered range of magnitudes this effect only negligibly (less than two percents) changes distribution . Thus we assume in our further discussions.
| Cluster | Fit parameters | Derived parameters | |||||
|---|---|---|---|---|---|---|---|
| range | |||||||
| (mag) | (mag) | ||||||
| NGC 2383 | 23.6 | 2.50 | |||||
| NGC 2383a | 37.2 | ||||||
| NGC 2384 | 39.6 | 2.00 | |||||
| NGC 2384b | 41.5 | 2.00 | |||||
| NGC 4103 | 24.1 | 1.25 | |||||
| Hogg 15 | 79.2 | 0.75 | |||||
| Hogg 15c | 17.0 | 0.75 | |||||
| NGC 4755 | 10.8 | 2.50 | |||||
| NGC 7510 | 13.8 | 0.75 | |||||
a corrected for contamination by NGC 2384 stars, is accepted from the upper MS isochrone fitting
b derived in the frame area free from NGC 2383 stars
c corrected for contamination by NGC 4609 stars
4.4 Theoretical luminosity functions
For construction of a theoretical LF , we have assumed a model of continuous stars formation. It is computed as
where and are minimum and maximum ages of the cluster stars, function , computed using equation (1), is the LF of stars with age (), is the star formation rate (SFR) at age . The value of , representing duration since formation of first stars, could be regarded as the cluster age.
The mass – absolute magnitude relation and its derivative were calculated along the isochrone of age using a cubic spline interpolation. For the IMF we considered a power-law representation , with to be normalizing factor, and the IMF slope to be determined within this study. We assumed a constant SFR in our model, . The resulting parameters for each cluster were drawn from the best fit of the theoretical and observed LFs.
In order to construct theoretical isochrones and LFs which include both Post-MS and Pre-MS stages for ages typical to clusters of our sample, we combined Population I Pre-MS evolutionary tracks of D’Antona & Mazitelli (1994) for masses 0.1 to 0.8 , and of Palla & Stahler (1993) for masses 0.8 to 6 , and Maeder’ group Post-MS calculations (Schaller et al., 1992) for . The grids were properly tuned to provide a continuous transition from Pre- to Post-MS ages and smooth and uniform mass – luminosity and mass – radius relations along the ZAMS. The isochrones were computed from the models corresponding to the Population I chemical abundance () =(0.30,0.02) using linear interpolation.
In order to convert the theoretical isochrones from plane to the observed plane, we used bolometric corrections and relations from Schmidt-Kaler (1982) tables for the luminosity classes I, III and V.
4.5 Fitting of theoretical and observed LFs
The following iterative steps are used in the fitting procedure:
-
1.
Apparent LF construction: Apparent LF (observed brightness distribution) was constructed from the data available for given frame(s) as smoothed density estimation with a rectangular one-magnitude wide window, and a step of 0.25 mag. The histogram form of smoothing kernel was selected to apply correction for field star contamination.
-
2.
Construction of a cluster LF: We assume that apparent LF is a composition of a distribution of cluster stars with apparent magnitude and field stars brightness function represented by galactic star count model distribution :
where free parameter denotes percentage of field stars, contaminating the sample. With help of apparent distance modulus the function is transformed to absolute magnitude scale, and is called hereafter as observed cluster LF .
-
3.
Luminosity function fitting: Theoretical LF smoothed in the same way as observed LF was fitted to empirical function within a cluster-specific range of magnitudes. The entropy
was constructed to find the best-fit parameters .
Steps (ii) and (iii) were repeated iteratively by varying until the best agreement (in terms of statistics) between theoretical and observed LFs is achieved. The parameter was varied between 0 and 1 in a step of 0.1.
Internal accuracy of , and was estimated on the basis of the kernel smoothing theory (Silverman 1986, Lapko et al. 1996) for selected histogram grid parameters (range and step). An accuracy of the field stars percentage was estimated from
assuming that is a second order central moment of a distribution function equal to that of .
5 Discussion
The results of the LF fitting are listed in Table 4. For each cluster we show fit parameters: the range of absolute magnitudes selected for the LFs fit, the best-fit value achieved in the iterations, and derived parameters: position of H-maximum in theoretical LF , indicating absolute magnitude of the turn on point, derived percentage of field star contamination , the IMF slope , adopted age of a cluster , and age spread parameter . Note, that parameter errors shown in Table 4 are in good agreement with the uncertainty estimations given in Sec. 3 on the basis of data accuracy analysis. The results are discussed below separately for clusters under study.
In Fig. 4, we show the CMDs of clusters under discussion. The reddening and distance parameters are taken from Table 1 and fine tuned by the variation of the tabular values within their accuracy to reach the best agreement of the cluster CMD, empirical ZAMS, and corresponding isochrones. Cluster proper motion members and non members are marked, if cluster stars are bright enough to be included in the ASCC-2.5. To give an idea how the adopted distances and reddening values agree with the photometry we show in the diagram a position of empirical ZAMS of Schmidt-Kaler (1982). In order to illustrate how ages derived from the LF analyses confirm with cluster CMDs, we show in Fig. 4, the isochrones corresponding to the ages, and .
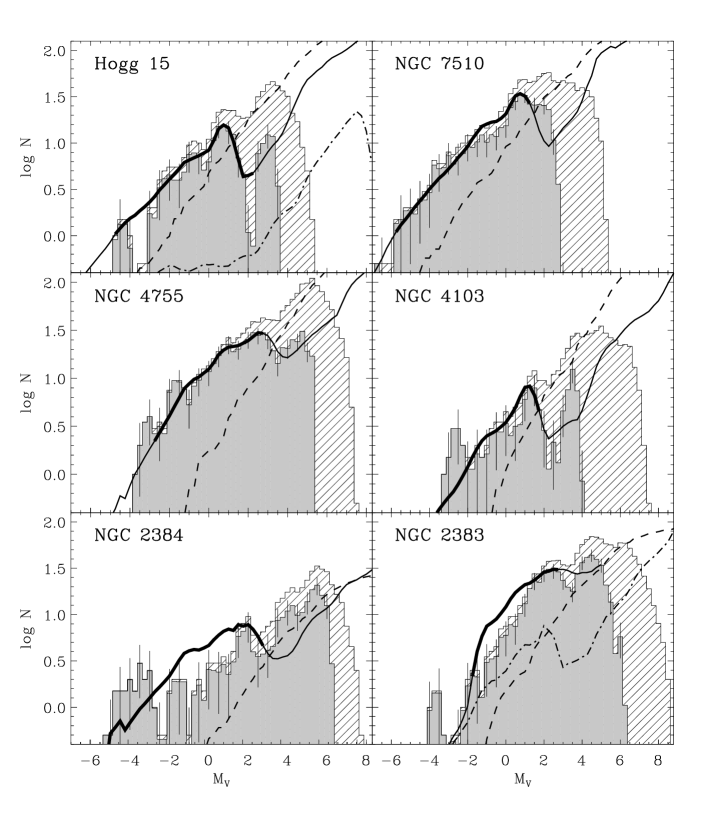
In Fig. 5, we display the LFs. Observed cluster LF , constructed as described in Sec. 4.5 is shown with filled histogram, and corresponding theoretical LF fitted to is shown with a curve (the fitted portion of is shown with heavy curve, while the rest is marked with thin curve). For comparison purposes we show also apparent LFs (thin histogram and hatched area), and contribution from field stars (dotted curve), both displaced by the value of . Below we discuss each cluster as per their appearance in figures 4 and 5.
5.1 Hogg 15
In the cluster CMD, one can indicate the MS turn on point at mag. Note, that the H-feature should be also found in the LF in the vicinity of , where apparent LF of Hogg 15 stars also shows a local maximum. The data incompleteness dominates after mag, where gradually decreases in agreement with Table 1, indicating that mag. The field star contamination for Hogg 15 is found to be highest amongst clusters considered here. This effect, as it is seen from the filled histogram in Fig 5, keeps the LF practically unchanged at the brighter portion ( mag), and hides substantially the H-feature region.
In order to take into account contamination from an overlapping cluster NGC 4609 theoretical LF was composed of two populations belonging to these clusters. Since the clusters reside at different distances from the Sun, the stars of NGC 4609 should be shifted with respect to that of Hogg 15 by the difference of cluster apparent distance moduli . Since of the NGC 4609 according to LGM2.2 is equal to mag the value of is taken to be equal to mag. Due to small fraction of NGC 4609 stars projected on the Hogg 15 area (about 15% of Hogg 15 population according to Sec. 4.2) the specific shape of the corresponding mass spectrum is not important and we assume that it follows Salpeter law. The age of NGC 4609 was taken from Mermilliod (1981) as . Composite LF is shown in Fig. 5 with solid curve, while the input from the NGC 4609 population is shown with the dot-dashed curve.
As one can see from Table 4, taking into account population of NGC 4609 does not strongly change cluster parameters (except the age spread), but considerably improves agreement between theoretical and observed parameters notably reducing parameter.

Fig. 4 shows that ages derived from the LF fitting are in good agreement with cluster CMD. The observed cluster LF also demonstrates a high degree of conformity with composite theoretical LF. A deep and narrow gap of at about mag shows that the derived input of field stars is somewhat overestimated. As shown in Table 4, Hogg 15 is one of the two clusters in our sample, where considerable (although quite uncertain) age spread of is detected. This value, however, is reduced to the insignificant value of , which is common to the whole sample, if one takes into account the contamination from NGC 4609. We therefore conclude that the age spread in Hogg 15 is introduced mainly due to admixture of field and overlapping neighbor’ stars, and consider the cluster parameters as derived for the Hogg 15c case.
Hogg 15 is the youngest cluster of our sample, with an age of 4 Myr. How does this value compare with the earlier published values? For the first time, the age of Hogg 15 was estimated by Moffat (1974) as 8 Myr. According to Lyngå (1987) the age is 10 Myr. Recent values come generally from isochrone fitting of the upper MS: LGM2.2 define it as Myr, Sagar et al. (2001) provide age estimate of Myr, Piatti & Clariá (2001), who found initially it as 300 Myr, later reduced this unusually high value to Myr (Piatti et al. 2002). Technique of matching integrated theoretical and observed spectra of the cluster lead Ahumada et al. (2000) to the age values Myr or 30 Myr. Since MS turn off ages are biased toward higher values, our age estimate, based on MS turn on point technique, is in fact the lowest one. Note, however, that the majority of the above mentioned values agree with the present one within their accuracy. The IMF slope was determined for Hogg 15 stars by Sagar et al. (2001), who find it to be equal , which again coincides with the present result.
5.2 NGC 7510
It can be seen from the CMD that the regular cluster sequences are embedded in a ”cloud” of presumably field stars. The astrometric members also show definite spread around the MS turn off point. It may be that some of them are co-moving field stars. The MS turn on point can be detected somewhere between and 1.5 mag. The apparent LF shows a broad plateau between and 3 mag, with weak maximum at mag. As indicated by galactic model star counts, it should be formed mostly by field stars. The sample demonstrates certain incompleteness below the maximum, where instead of steady increase slowly falls down. According to Table 1 the completeness limit of original data is mag. We select mag as faint limit of the LF fitting range based on the value of parameter. The agreement between observed cluster LF and theoretical LF is one of the best amongst the studied clusters.
As one can see from Fig. 4, the ages Myr and Myr, derived from the LF fitting are in good agreement with details of the cluster CMD. The lower pre-MS branch of the cluster coincides with isochrone. The isochrone fits the apparent sequence of stars deviating from the MS at mag. Stars forming this group do not show evident concentration to the cluster center. If, however, this group is not a random concentration of field stars, one can regard this as an evidence of the second star formation event in the cluster.
Excellent agreement between theoretical and observed LFs concerns only MS. We are unable to follow the H-feature over its full width, and are not certain if the descending portion of the is related to this detail or it is a consequence of the data incompleteness of the present survey. Note, however, that cluster age derived from the assumption that H-maximum is located at mag (just coinciding with the data completeness limit) is in agreement with the CMD arguments, which is independent of data incompleteness. In contrast, the mass spectrum slope, found from brighter portion of the LF should be regarded as a confident one.
MS turn off age of NGC 7510 can be found in Lyngå (1987) catalogue (10 Myr), and in LGM2.2 list (382 Myr), Sagar & Griffiths (1991) find the age 10 Myr. Again our age of 6 Myr is the lower estimate of these values. Mass function of stars of NGC 7510 was constructed by Sagar & Griffiths (1998). It was found, that in the mass range 1–14 the mass function slope is , which again fits present results well.
5.3 NGC 4755
NGC 4755 is the only cluster of our sample, which is observed in two frames, located on both sides of the dense cluster center (Fig. 2). We find that both the frames are similar with respect to photometric quality and the completeness issue. So we consider them together.
The cluster CMD shows well defined stellar sequences. The MS turn on point can be seen at mag, and correspondingly H-feature is expected to be located at mag and fainter. The uncorrected LF shows a step at mag, related to cluster H-feature. The data incompleteness dominates after (5.2 according to Table 1) mag, where gradually falls down. Correction for field stars for this cluster can be made with a certain confidence. By comparing with model brightness function , it can be seen that at brighter magnitudes the incompleteness can be regarded as negligible. Thus selecting mag as a faint limit for the LF fitting range, we are safe from the data incompleteness bias. Since the brightest stars, residing in the cluster center and shown in Fig. 5, are not present in original data (see Fig. 4), we select mag as the bright limit of fitting range. As it is seen from the filled histogram of Fig.5, we correctly identify the H-maximum position, and in spite of the fact that the fitting was made only for MS portion of the LFs, the theoretical LF reproduces well the pre-MS H-feature after LF reaches its minimum and turns over again. However, we are not able to reach the convective portion of the LF due to relatively brighter completeness limit of the present data.
It is seen that theoretical LF is in good agreement with the the observed one even outside the fitting range. The derived age spread of cluster stars, according to Table 4 is insignificant, and we conclude that no evidence of continuous star formation can be found from the LF analysis for this cluster. As one can see from Fig. 4, the age of 16 Myr as derived from the LF fitting technique is in good agreement with the cluster CMD. The IMF slope coincides within its accuracy with the Salpeter value.
MS turn off age of NGC 4755 can be found in Lyngå (1987) catalogue (7 or 24 Myr), and in LGM2.2 list ( Myr), Sagar & Cannon (1995) find that it is about 10 Myr, and most of pre-MS stars have ages between 3 and 10 Myr. Recent age estimation Myr, derived from the fitting of upper MS, is given by Sanner et al. (2001). For this cluster our age of 16 Myr is rather average than the lower estimate of published values. Mass function of the NGC 4755 stars was constructed by Sanner et al. (2001). It was found, that in the mass range 1–13 the slope is , which is significantly steeper than the value estimated here.
5.4 NGC 4103
The observed frame (see Fig. 2) covers only a minor part of the cluster center. One can therefore expect the results to be more uncertain in comparison with the majority of other clusters under study.
In the cluster CMD, the MS turn on point can be seen at mag, and the H-feature dip is expected at mag, seen as the CMD area of lower density. The apparent LF shows week local maximum at mag. The data incompleteness (see Table 1) dominates at mag, where gradually falls down. However, flattens after mag, which indicates existence of certain data incompleteness at brighter magnitudes. To be completely safe against this effect and taking into account, that the shape of at mag is very close to that of model field star brightness function, indicating high fraction of field stars in this magnitude range, we select mag, as a faint limit of the LF fitting range. The minimum of is achieved at , with the corresponding parameters shown in Table 4.
In spite of the cluster LF turning to increase after mag, we could not regard the H-feature with same confidence as in Hogg 15 or NGC 4755, due to poor statistics. It should be noted, however, that as in the case of NGC 4755, theoretical LF, being fitted to the MS observations, reproduces the empirical Pre-MS stage reasonably well. Cluster age, derived from the LF and MS turn on point analysis shows, that this cluster seems to be younger, than it was regarded before, generally from MS turn off dating technique (see below). It should be noted, however, that NGC 4103 is the case, where the MS turn off technique due to practically unevolved upper main sequence of the cluster is able to provide an upper age estimate only. In contrast the mass spectrum slope, found from brighter portion of the LF should be regarded as accurate enough. Note some excess of brightest stars ( mag), which can be however, a consequence of random placement of rare bright field stars over the cluster region.
All the authors provide NGC 4103 MS turn off age and are unanimous in its value. The age is 22–41 Myr according to Lyngå (1987), Myr according to LGM2.2, Sagar & Cannon (1997) find it to be about 30 Myr, Forbes (1996) estimated about 25 Myr and notes, that MS turn on age should not be much different, and according to Sanner et al. (2001) the age is Myr. Again we give the lowest value of the cluster age of about 6 Myr and believe, that both cluster CMD and LF support this value. Mass function of stars of NGC 4103 was constructed by Sanner et al. (2001). It was found that in the mass range 0.7–12 the slope is . Almost the same value is estimated here.
5.5 NGC 2383 and NGC 2384
In NGC 2383/2384 pair, the dominating role in the neighbor contamination is played by the extended and loose cluster NGC 2384 (see Sects. 4.1, 4.2). In contrast, the central part of NGC 2384 can be regarded as relatively free from the NGC 2383 influence. Therefore we start this section with discussion of NGC 2384 results.
The CMD of NGC 2384 in its lower part is very fuzzy, while the MS part of the diagram is well defined. Subramaniam & Sagar (1999) even assume that stars fainter than () mag are mainly field stars, as can be seen from the Fig. 4. Nevertheless, a certain fraction of cluster members is observed even at faintest magnitudes. These are pre-MS stars, forming the upper bound of the observed sequence at mag. In contrast to other clusters the CMD of NGC 2384 does not display an extended halo of field stars, where cluster MS- and Pre-MS sequences are embedded. Field stars (presumably giants and late type dwarfs) form a compact clump in the bottom of the diagram, with mag and mag, leaving Hertzsprung gap to be unoccupied. The MS turn on point in the CMD is less certain than for other clusters. If one correlates cluster CMD with the morphology of the observed LF one should detect it around mag, where cluster MS-stars certainly cease to appear, and simultaneously a local detail, resembling the H-feature appears in the observed LF. One can observe, however, that a few of the Pre-MS stars do appear in the CMD at brighter magnitudes ( mag). Their extension forms an upper bound of a broad Pre-MS branch, extending down to the limit of observations. The regularity of this feature implies, that it is not a random pattern of field stars. They would be rather unresolved Pre-MS binaries, or the youngest generation of NGC 2384 stars. Note, however, that this brighter position of the MS turn on point does not produce anything resembling the H-maximum, expected to be located near this point (see Sec. 2).
The LF of NGC 2384 demonstrates irregular behavior, and its agreement with theoretical LF is worse in comparison to the other clusters under study. This is confirmed statistically as the value is highest for this cluster (except Hogg 15 case with no correction for contamination by NGC 4609). One can mention an excess of observed number of massive stars ( mag), and a deficiency of medium-mass stars ( mag) with respect to theoretical LF . Also LF-detail, which we identify with the H-feature is poorly developed; the observed H-dip is narrower, than the theoretical one. This behavior is in conformity with mass segregation scenario in the case if the observed frame covers the central part of the cluster only. The derived slope of the mass function is similar to values found by de Grijs et al. (2002b) for central parts of rich LMC clusters NGC 1805 and NGC 1818. The LF irregularity could be attributed then to incomplete member statistics. The higher extent of the cluster comparing to the observed frame naturally explains other peculiarities of NGC 2383/4 pair like presence of early type stars in the NGC 2383 field and existence of underdeveloped H-feature in its LF (see below), or weak excess of bright stars in the neighboring blank field (see. Sec. 4.1).
The stability of NGC 2384 parameters against contaminating effect of NGC 2383 was checked using data from the part of NGC 2384 frame, located outside NGC 2383 area (see Fig. 2). As one can see from Table 4, there is no difference between derived parameters of NGC 2384 in both cases. Thus we can regard the influence of NGC 2383 member contamination on the derived parameters of NGC 2384 to be negligible.
Color magnitude diagram of NGC 2383 is more populated than that of the neighboring NGC 2384. There is a well defined evolved portion of the MS compatible with cluster age , which is in agreement with an estimate of by Subramaniam & Sagar (1999) and differs from the ages and 7.17 derived by Lyngå (1987) and LGM2.2 respectively. This contradiction arises due to the presence of bright ASCC-2.5 kinematic members with ages of a few tens of Myr. The MS turn on point, corresponding to this younger age can not be easily identified in the CMD. Nevertheless the LF indicates presence of the H-detail even in the apparent LF . The MS-band at fainter magnitudes ( mag) is widened and unlike the other clusters studied here, it is not due to field giants extending the MS from the side of fainter magnitudes, but it is due to bright stars forming the high luminosity envelope of the MS.
In the corrected LF , the H-feature becomes more pronounced, leaving the H-dip however to be somewhat underdeveloped (more shallow and narrow than in the corresponding theoretical LF). The cluster age derived from the LF fitting corresponds to lower age estimation coming from the brightest MS stars. The value of indicates that the LF fit is more reliable, than in the case of NGC 2384. Note the unusually steep value of the IMF slope = 2.2, estimated for this cluster. In spite of formally satisfactory results of the LF fitting there are several points, indicating that NGC 2383 carries signs of a dual nature, which were not taken into consideration. For example, evolved upper MS indicates that NGC 2383 is about 300 Myr old (see Fig. 4), while LF indicates its age close to that of NGC 2384. The relatively young age of NGC 2383 is also supported by the presence of bright MS kinematic members. Possibly this is the main reason for assigning younger age to the cluster by Lyngå (1987) and LGM2.2. This confusion can be removed with the help of a model of an overlapping neighbor, with the only difference from the case of Hogg 15, that in this case degree of contamination with NGC 2384 stars is higher (see Sec. 4.2). This is also supported by independent data of the ASCC-2.5, which indicates, that these clusters are located close not only in the sky, but also have similar proper motions (see Kharchenko et al. 2003). So a probable proper motion member of one cluster can also well belong to the other, and the brightest kinematic members of NGC 2383 could be actually projected members of NGC 2384. This can also be supported by the fact that numerous MS-stars of NGC 2383 forming upper envelope at mag, could be actually Pre-MS stars of NGC 2384. Apart from coincidence with positions of corresponding isochrones in the CMD this idea is also supported by spatial distribution of these stars. They tend to be located in NGC 2383 frame within circle of its neighbor. The number of these stars is compatible with the degree of contamination derived from stellar counts and they might be responsible for steeper IMF slope found for NGC 2383, when neglecting influence of NGC 2384.
In order to take into account contamination from the overlapping cluster theoretical LF of NGC 2383, was composed of two populations belonging to both clusters. Unlike to the case of Hogg 15, NGC 2383 and NGC 2384 reside at the same distance within the errors ( mag). So no correction is required for the LF magnitude scale while constructing the composed theoretical LF. We assume, that the mass spectrum of NGC 2384 stars does not vary with location and the case of NGC 2384b in Table 4 can be considered as its representative. The corresponding values of and were also taken from the Table 4. Since no developed H-feature exists in the LF at 300 Myr we were forced to use the LF of NGC 2383 in a customary, way i.e. for determination of and parameters. Cluster age was found from the MS turn off point and fine tuned to satisfy the -test. The lowest -value was achieved at , which is somewhat less than isochronic age of (Fig. 4), determined from the Post-MS isochrone fitting. Due to above mentioned reasons we regard this disagreement as insignificant and show in the Table 4 the turn-off age. The best-fit composite LF for the case NGC 2383a is shown in Fig. 5 with solid curve, while the contaminating model LF of the NGC 2384 is shown with the dash-dotted curve.
As one can see from the Table 4, the proposed model provides less accurate fit of theoretical LF to observed LF than the previous one. On the other hand, it harmonises the full observation scope (star counts, cluster CMDs and LFs). As a result, with the age determined from the MS turn off point calibration, the IMF slope has been reduced to the value close to the Salpeter’s one with the value of almost unchanged.
In the light of above discussions, it is not surprising that the cluster parameters derived in the present study are in good agreement with those derived in the original paper by Subramaniam & Sagar (1999). For example, our values of practically coincide with those of Subramaniam & Sagar (1999), who found for NGC 2383 and for NGC 2384. Similarly, in agreement with Subramaniam & Sagar (1999), we regard that NGC 2383 ages listed by Lyngå (1987) as 25–41 Myr or by LGM2.2 as 16 Myr are underestimated, while the NGC 2384 ages (1–10 Myr according to Lyngå 1987 and Myr according to LGM2.2) are in fair agreement with our result. However, again the age of NGC 2384 derived from LF-fitting is lower than that derived by Subramaniam & Sagar (1999) from the upper part of the MS.
Subramaniam & Sagar (1999) conclude that in spite of their spatial proximity clusters NGC 2383/2384 do not constitute a physical pair in the sense of common origin. Present study not only supports this point but makes it more stronger. In spite of the fact that both clusters do overlap in the plane of sky, reside approximately at the same distance from the Sun, and have similar proper motions, they are very different in all other respects e.g. cluster geometry, morphology, environment, stellar contents, and age and can not be regarded as twins.
6 Conclusions
The major aim of the present study was to elaborate tools, which provide comprehensive investigation of remote young open star clusters having accurate CCD-photometry. The effort was focused on revealing of the Main Sequence turn-on areas, important both from the point of young cluster dating and from the luminosity and mass function analysis. To enable the statistical selection of cluster members for vast set of open cluster CCD observations with no data on adjacent blank fields, and thus, to involve them to luminosity and mass functions studies we proposed a new approach to field star removing technique based on using of galactic disk star count model. As we found, due to high confidence in interstellar extinction determination, open clusters are especially suitable objects for this technique, providing selection results at least of the same quality level as the standard method of the blank field does. The proposed approach could be especially valuable for deep observations of young clusters, planned to be observed in the frame of present-day surveys (see e.g. Kalirai et al. 2001), which are able not only to reach turn-on regions of selected young clusters, but also reveal complete H-details down to convective portions of luminosity functions.
The main conclusion from the present study of the 6 such clusters residing at helio-centric distances of 2–4 kpc is that their CCD observations coupled with the Galaxy model star counts, wide area statistics provided by all sky catalogues, and theoretical LFs fitted to the observations are sufficient to study their population, construction of the detailed luminosity and mass functions, and age, provided the photometry is deep enough to reach the LF H-feature. The direct comparison of observed and theoretical LFs instead of converting them to stellar mass spectra is of principle importance in this approach. It provides a standard candle, which can be used for a reliable cluster dating. This is very difficult otherwise, since the upper MS of young clusters usually implemented for this aim, are too steep, and degree of stellar evolution is as a rule insignificant to provide reliable cluster ages. In fact it just provides an upper estimates for the cluster age. The main conclusions can be written as:
-
•
Contamination of cluster members with field stars is the most important factor influencing the lower part of cluster CMD and LF. For the clusters under study, field star contamination varies in the range of 20–50%.
-
•
The overlapping clusters may considerably distort the observed LFs. The ”neighbor” contamination, in addition to field stars, is equal to 14% in the case of Hogg 15 and to 24% in the case of NGC 2383.
-
•
The LF H-feature was found well beyond statistical noise in all the clusters under study. For most of the clusters its location agrees well with the theoretical prediction. We believe, that in the case of NGC 2384, where H-feature displays underdeveloped structure, this can be explained by complexity of the area, and spatial incompleteness of the data. The false H-feature observed in NGC 2383, which certainly is too old to demonstrate it, is due to contamination of the cluster field with NGC 2384 stars.
-
•
Cluster ages derived in the present study are as a rule several times lower than those determined from the fitting of the theoretical isochrones to the turn off parts of the MS. We believe, that our ages are more accurate, than those derived from the upper MS. Note that although we used continuous star formation model, the derived durations of star formation events are only insignificantly differ from zero.
-
•
Stellar mass spectra of studied clusters are well represented with a power law with slopes, which as a rule agree with Salpeter’ value, within errors. One should keep in mind however, that since the observed data concerns the central parts of clusters, the derived mass spectra might be different from the IMF due to mass segregation effect. The unusually flat mass function of NGC 2384 can be treated e.g. as an indirect evidence of higher extent of this cluster and of presence of mass segregation effect.
Acknowledgments
We thank the anonymous referee for useful comments. This work was partly supported by the RFBR grant No 01-02-16306. One of us (AEP) is thankful to the Indian National Science Academy, New Delhi for funding the visit to India in the fall of 2000, when this work was initiated. ANB acknowledges the financial support of the INTAS (grant INTAS YSF 00-152).
References
- Andrievsky et al. (2002) Andrievsky S. M., Bersier D., Kovtyukh V.V., Luck R.E., Maciel W.J., Lépine J.R., Beletsky Yu.V., 2002, A&A, 384, 140
- Ahumada et al. (2000) Ahumada A. V., Claria J. J., Bica E., Piatti, A. E., 2000, A&AS, 141, 79
- Bahcall (1986) Bahcall J.N., 1986, ARA&A, 24, 577
- Belikov (1999) Belikov A.N., 1999, Modeling of the Luminosity Functions of Young Stellar Groups. Ph.D. Thesis., MSU, Moscow
- Belikov & Piskunov (1997) Belikov A.N., Piskunov A.E., 1997, Astr. Rep., 41, 28
- Belikov et al. (1998) Belikov A.N., Hirte S., Meusinger H., Piskunov A.E., Schilbach E., 1998, Astron. Astrophys. 332, 575
- Da Costa (1982) Da Costa G.S., 1982, AJ, 87, 990
- D’Antona & Mazitelli (1994) D’Antona F.& Mazitelli I., 1994, ApJS, 90, 467
- de Grijs et al. (2002a) de Grijs R., Johnson R. A., Gilmore G. F., Frayn C. M., 2002a, MNRAS, 331, 228
- de Grijs et al. (2002b) de Grijs R., Gilmore G. F., Johnson R. A., Mackey A. D., 2002b, MNRAS, 331, 245
- de Grijs et al. (2002c) de Grijs R., Gilmore G. F., Mackey A. D., Wilkinson M. I., Beaulieu S. F., Johnson R. A., Santiago B. X., 2002c, MNRAS, 337, 597
- Dias et al. (2002) Dias W.S., Lépine J.R.D., Alessi B.S., 2002, A&A, 389, 871
- Forbes (1996) Forbes D., 1996, JRASC, 90Q, 329
- Gilmore (1984) Gilmore G., 1984, MNRAS, 207, 223
- Holmberg et al. (1997) Holmberg J., Flinn C., Lindengren L., 1997, in ESA Hipparcos Venice’97 Symp., p. 721
- Jahreiß & Wielen (1997) Jahreiß H., Wielen R., 1997, in ESA Hipparcos Venice’97 Symp., p. 675
- Kalirai et al. (2001) Kalirai J.S., Richer H.B., Fahlman G.G., Cuillandre J.-C., Ventura P., D’Antona F., Bertin E., Marconi G., Durrel P., 2001, AJ, 122, 257
- Kharchenko & Schilbach (1996) Kharchenko N., Schilbach E., 1996, Baltic Astron., 5, 337
- Kharchenko et al. (1997) Kharchenko N., Rybka S., Yatsenko A., Schilbach E., 1997, Astron. Nachr., 318, 163
- Kharchenko (2001) Kharchenko N.V., 2001, Kinematics & Phys. Celest. Bodies, 17, 409
- Kharchenko & Piskunov (2003) Kharchenko N.V., Piskunov A.E., 2003, in preparation
- Kharchenko et al. (2003) Kharchenko N.V., Pakulyak L.K., Piskunov A.E., 2003, Astron. Zhurn., 80, 291
- Kilpio & Malkov (1997) Kilpio E.Yu., Malkov O. Yu., 1997, Astron. Zhurn., 74, 15
- Kislyuk et al. (1999) Kislyuk V., Yatsenko A., Ivanov G., Pakulyak L., Sergeeva T., 1999, in Motion of Celestial Bodies, Astrometry and Astronomical Reference Frames, JOURNEES 1999 & IX Lohrman Kolloquim, Dresden, Germany, 13-15 September 1999, p. 61
- Lapko et al. (1996) Lapko A.V., Chentzov S.V., Krokhov S.I., Feldman L. A., 1996, Self-Leaning Systems of Data Processing and Decision-Making. Nonparametric Approach, Nauka, Novosibirsk
- Lyngå (1987) Lyngå G., 1987, Catalogue of Open Cluster Data, 5th edition, S7041, Centre de Données Stellaires, Strasbourg
- Marochnik & Suchkov (1984) Marochnik L.S., Suchkov A.A., 1984, The Milky Way Galaxy, Nauka Publ., Moscow
- Mermilliod (1981) Mermilliod J.-C., 1981, A&A, 97, 235
- Moffat (1974) Moffat A.F.J., 1974, A&A, 34, 29
- Nilakshi et al. (2002) Nilakshi, Sagar R., Pandey A.K., Mohan V., 2002, A&A, 383, 153
- Murray et al. (1997) Murray C.A., Penston M.J., Binney J.J., Houk N., 1997, in ESA Hipparcos Venice’97 Symp., p. 485
- Palla & Stahler (1993) Palla F., Stahler S.W., 1993, ApJ 418, 414
- Parenago (1940) Parenago P.P., 1940, Astron. Zhurn., 17, 3
- Pandey et al. (2001) Pandey A.K., Nilakshi, Ogura K., Sagar Ram, Tarusawa K., 2001, A&A, 374, 504
- Phelps & Janes (1993) Phelps R. L., Janes K. A., 1993, AJ, 106, 1870
- Piatti & Clariá (2001) Piatti A. E., Clariá J. J, 2001, A&A, 370, 931
- Piatti et al. (2002) Piatti A. E., Bica E., Santos J. F. C. Jr., Clariá J. J., 2002, A&A, 387, 108
- Piskunov & Belikov (1996) Piskunov A.E., Belikov A.N., 1996, Astr. Lett., 22, 466
- Sagar & Cannon (1995) Sagar R., Cannon R.D., 1995, A&AS, 111, 75
- Sagar & Cannon (1997) Sagar R., Cannon R.D., 1997, A&AS, 122, 9
- Sagar & Griffiths (1991) Sagar R., Griffiths W.K., 1991, MNRAS, 250, 683
- Sagar & Griffiths (1998) Sagar R., Griffiths W.K., 1998, MNRAS, 299, 777
- Sagar et al. (2001) Sagar R., Munari U., de Boer K.S., 2001, MNRAS, 327, 23
- Sagar & Richtler (1991) Sagar R., Richtler T., 1991, A&A, 250, 324
- Sanner et al. (2001) Sanner J., Bruzenderf J., Will J.-M., Geffert M., 2001, A&A, 369, 511
- Scalo (1986) Scalo J., 1986, Fund. Cosm. Phys., 11, 1
- Schaller et al. (1992) Schaller G., Schaerer D., Meynet G., Maeder A., 1992, A&AS, 96, 269
- Schmidt-Kaler (1982) Schmidt-Kaler Th., 1982, Landolt-Berstein Numerical Data and Functional Relationships in Science and Technology, New Series, Group IV, Berlin-Heidelberg, New York, Springer-Verlag Press, 2, p. 15
- Silverman (1986) Silverman B.W., 1986, Density Estimation for Statistics and Data Analysis, Chapman & Hall, London, New York
- Subramaniam & Sagar (1999) Subramaniam A., Sagar R., 1999, AJ, 117, 937
- Schmidt (1963) Schmidt M., 1963, ApJ, 137, 758
- Tout et al. (1996) Tout C.A., Pols O.R., Eggleton, P.P., Han Z., 1996, MNRAS, 281, 257
- Vereschagin & Piskunov (1992) Vereschagin S.V., Piskunov A.E., 1992, in Chemical evolution of stars and the Milky Way galaxy, ed. A.G.Massevich, Kosmoinform Publ., Moscow, p.5
- Zacharias et al. (2000) Zacharias N., Urban S.E., Zacharias M.I., Hall G.L.,Wycoff G.L., Rafferty T.J., Germain M.E., Holdenreid E.R., Pohlman J.W., Gauss F.S., Monet D.G., Winter L., 2000, AJ, 120, 2131