Three-dimensional dust radiative-transfer models:
The Pinwheel Nebula
of WR104
Abstract
We present radiative-transfer modelling of the dusty spiral Pinwheel Nebula observed around the Wolf-Rayet/OB-star binary WR104. The models are based on the three-dimensional radiative-transfer code torus, modified to include an adaptive mesh that allows us to adequately resolve both the inner spiral turns (sub-AU scales) and the outer regions of the nebula (distances of 104 AU from the central source). The spiral model provides a good fit to both the spectral energy distribution and Keck aperture masking interferometry, reproducing both the maximum entropy recovered images and the visibility curves. We deduce a dust creation rate of M⊙ yr-1, corresponding to approximately 2% by mass of the carbon produced by the Wolf-Rayet star. Simultaneous modelling of the imaging and spectral data enables us to constrain both the opening-angle of the wind-wind collision interface and the dust grain size. We conclude that the dust grains in the inner part of the Pinwheel nebula are small (Å), in agreement with theoretical predictions, although we cannot rule out the presence of larger grains (µm) further from the central binary. The opening angle of the wind-wind collision interface appears to be about , in broad agreement with the wind parameters estimated for the central binary. We discuss the success and deficiencies of the model, and the likely benefits of applying similar techniques to the more the more complex nebulae observed around other WR/O star binaries.
keywords:
Stars:individual:WR104 – stars:mass-loss – stars:early-type – infrared:stars – radiative transfer – dust, extinction1 Introduction
Wolf-Rayet stars are the descendants of massive O-stars whose spectra are characterized by broad emission lines that are formed in their dense, high-speed stellar winds. Wolf-Rayet (WR) stars may be classified, by their spectral features, into nitrogen-rich (WN) and carbon-rich (WC) sequences. The current status of research into WR stars in our own and starburst galaxies is reviewed by Conti (2000).
The coolest WC stars often have an excess of IR radiation, indicative of warm circumstellar dust (Allen, Harvey & Swings 1972; Cohen, Barlow & Kuhi 1975; Williams, van der Hucht & Thé 1987). Systems with a near-constant excess are termed persistent dust producers, while those that show periodic behaviour in their IR fluxes are designated ‘episodic’ (e.g. Williams 1995). The fact that dust can condense and survive in the harsh UV-radiation field close to a WR star is somewhat surprising, and is a challenging problem for astrochemistry. The presence of dust in a highly-ionized environment also has ramifications for those studying star formation rates (SFR), where the presence of dust hinders the accurate calibration of SFR diagnostics such as H luminosity (see, e.g, Dopita et al. 2003).
The link between binarity and dust formation in WC stars was forged with observations of WR140, which demonstrated that the dust production episodes coincided with periastron (see, e.g. Williams 1999). It appears that the higher density associated with the wind-wind collision region aids dust condensation, and this interpretation was strengthened by high-resolution imaging of the new dust produced during periastron (Monnier et al. 2002). Further links between the episodic dust production and binarity have been established for WR125 (Williams et al. 1994) and WR137 (Williams et al. 1985), while significant progress has been made in understanding the conditions in the innermost regions of colliding wind binaries by combining hydrodynamical modelling with radiative-transfer modelling in the radio regime (Dougherty et al. 2003).
Persistent dust makers may be associated with single stars. Zubko (1998) performed a sophisticated calculation of the formation of dust in WR stars, adopting a spherical dust shell composed of amorphous carbon grains. The dynamics and grain growth/destruction mechanisms were accounted for, and it was found that the grains grew to 100–200Å as a result of implantation of carbon ions. Approximately 1% of the carbon emitted by the WR star was found to condense into dust. The rate of grain seed production was determined for individual systems by fitting the observed spectral energy distributions (SEDs). Although the Zubko calculations indicate that grain growth can occur in single systems, Cherchneff et al. (2000) suggested that significantly higher densities than those found in a smooth wind were required to produce the dust precursors. In fact, it has long been suggested that the persistent dust makers are binary system whose separation is such that the critical density for dust production is always achieved in the wind-wind interface (Williams & van der Hucht 1992).
If the formation of dust in WC systems does occur in the wind-wind collision interface, then it appears unlikely that the dust will be spherically distributed, and high resolution IR imaging seems to support this. Marchenko, Moffat & Grosdidier (1999) used maximum entropy reconstruction of NICMOS-2 imaging of WR137 to reveal an elongated structure. High-resolution imaging of WR104 (Tuthill, Monnier & Danchi 1999), obtained using Keck aperture masking interferometry, revealed the presence of a spiral distribution of dust, viewed at low inclination (11∘). Multi-epoch observations demonstrated that the spiral rotates with a period of 245d. The linear archimedian nature of the spiral suggests that it is associated with a flow of material away from a binary. Lunar occultation observations in the -band confirm the spiral structure (Mondal & Chandrasekhar 2002). A second ‘pinwheel nebula’ has been observed in WR98a (Monnier, Tuthill & Danchi 1999), while a structured nebula, of larger extent, was observed in WR112 using imaging at 18.2µm by Marchenko et al. (2002), although its pinwheel shape is more poorly defined.
In order to understand the formation mechanism of dust in colliding wind systems we must obtain more information on the circumstellar environment such as its geometric properties, its temperature, and its dust grain size distribution. In this paper we describe three-dimensional radiative transfer models of the extended dusty nebula around WR104, using a state-of-the-art code. In the next section we introduce the modelling code, and present tests of the code against an established one-dimensional code and a two-dimensional benchmark. We then describe the adopted model parameters, including geometry, the SEDs of the binary components, and the grain composition and size distribution. In subsequent sections we compare the resulting images and optical/infrared SED with the WR104 observations, and discuss the constraints the models place on the dust formation mechanisms.
2 The torus radiative-transfer code
The radiative-transfer modelling was performed using the torus code (Harries 2000). Originally written to model line-transfer in a moving medium, the code is based on Monte-Carlo (MC) techniques and tracks photons in three-dimensions. Variance reduction techniques are used to minimize the sampling errors that are always associated with MC methods. Dust scattering physics had already been included in torus (see Harries, Babler, & Fox 1999), but to model the IR continuum it was necessary to introduce dust radiative equilibrium physics. We additionally incorporated an adaptive mesh gridding, which allows us to easily treat the large range of scales in the problem.
2.1 Radiative equilibrium
Traditional radiative-equilibrium calculations rely on finding a numerical solution of the equation of radiative transfer. This is a relatively straight-forward method, but is typically limited to geometries with spherical (1-d) or rotational (2-d) symmetry (although see Steinacker et al. 2003).
Lucy’s (1999) MC-based method allows one to perform a full radiative-equilibrium calculation on an arbitrary dust distribution. Photon ‘packets’ are produced at the stellar photosphere and followed through the grid, being scattered, or absorbed and re-emitted, until they eventually escape the computational domain or are re-absorbed by the stellar photosphere. An extensive description of the algorithm is given by Lucy (1999) and Kurosawa et al. (2004), and we note that we have adopted Lucy’s method without modification.
2.2 Adaptive mesh
Complex three-dimensional structures may not be properly spatially sampled using traditional Cartesian or spherical polar grids, which often do not make efficient use of the available computer memory. A better method of producing a spatial grid is to employ a mesh that has higher spatial resolution in the regions of interest (high density or high opacity gradient) and a lower resolution in others (e.g. Kurosawa & Hiller 2001; Steinacker et al. 2003).
In torus we have implemented an adaptive mesh consisting of nested cubes, with a factor two in linear scale between each nesting level. In other words, each parent cube may be split into 8 children, each of which may in turn have 8 children of their own and so on. The grid data are stored as on octal tree, which is manipulated via recursive algorithms. The grid refinement can occur according to a variety of different criteria. For example, if there is an analytical formula for the density, the cells can be recursively split until each cell has a mass no greater than a pre-defined limit, or until no cell has an optical depth greater than a certain value. (The latter algorithm was used for the 2-D benchmark model). The torus implementation of the adaptive mesh refinement algorithm is described in detail by Symington (2004).
For the case under consideration here we take a list of particle positions (produced by a ballistic particle model) and refine the grid until a cell contains no more than a certain number of particles. The relative density of the cell is then simply given by its volume and the number of particles it contains. The density of the computational domain is then integrated and rescaled to match the required envelope mass.
2.3 Code testing
Many tests were run to ensure that the new implementation of the algorithm reproduced known solutions. The simplest tests involved checking that energy is conserved by the model. We then benchmarked the code against the established 1-d dust transfer code dusty (Ivezic, Nenkova & Elitzur 1999).
For the test model we adopted a thick spherical shell () with , composed of amorphous carbon dust with an MRN (Mathis, Rumpl, & Nordsieck 1977) size distribution, and with the temperature of the inner edge of the shell fixed at 800 K. Three models were computed, corresponding to optical depths at 5500Å() of 1, 10, and 100. We found excellent agreement between the radial dust temperature run computed by torus and dusty, and the model SEDs show similarly excellent agreement (see Figure 1).

We subsequently extended our tests to two dimensions, using the dusty disc benchmark proposed by Pascucci et al. (2003), which in turn is based on the disc geometry of Shakura & Sunyaev (1973). Comparison between the radial and vertical temperature structure showed excellent agreement with the benchmark results, even for the most optically thick () case (Figure 2a). The SED computed using torus also shows good agreement with the benchmark results (Figure 2b).

3 WR104 observations
Previous models of dust formation in WR104 have relied solely on fitting the SED, and so inevitably have been based on the simplest plausible geometry, that of a thick spherical shell. In this paper we employ the additional observational constraint provided by ultra-high-resolution imaging.
3.1 The spectral energy distribution
The longest wavelengths in the SED of WR104 are defined by IRAS observations at 12, 25 and 60 microns (Cohen 1995). Overlapping with this photometry is an ISO-SWS spectrum covering the wavelength range 2.4–40 microns (spectral resolution 250–600) described by van der Hucht et al. (1996) and obtained from the ISO archive. Our JHK photometry is taken from Williams, van der Hucht & Thé (1987), along with their -band value and the -band spectrophotometry of Torres-Dodgen & Massey (1988).
We note that the short-wavelength region of the SED should be treated with caution, since WR104 shows significant () variability in the optical (Crowther 1997; Kato et al. 2002), and unfortunately the optical, near-IR, and mid-IR data are not contemporaneous.
3.2 High resolution imaging
Aperture masking interferometry is performed by placing aluminium masks in front of the Keck-I infrared secondary mirror. This technique converts the primary mirror into a VLA-style interferometric array, allowing the Fourier amplitudes and closure phases for a range of baselines to be recovered with minimal ‘redundancy’ noise e.g. Baldwin et al. (1986), Jennison (1958). The Maximum Entropy Method (MEM) (Skilling & Bryan 1984, Narayan & Nityananda 1986) has been used to reconstruct diffraction-limited images from the interferometric data, as implemented in the VLBMEM package by Sivia (1987). In order to check the reliability of the reconstructions, the MEM results have been compared with those from the CLEAN reconstruction algorithm (Högbom 1974, Cornwell & Wilkinson 1981, Pearson & Readhead 1984). Further engineering and performance details may be found in Tuthill et al. (2000) and Monnier (1999).
WR 104 was observed on U.T. 1999 April 15 and 1999 June 5 Keck-I using the Near Infrared-Camera (Matthews & Soifer 1994, Matthews et al. 1996) in speckle mode with an integration time of 0.137 s per frame, employing a circular ‘annulus’ mask. We present here imaging results using two bandpasses: H filter ( m, m) and the CH4 filter ( m, m). The observations of WR 104 modelled in this paper were first published in Tuthill et al. (1999) and additional details can be found there.
4 Model parameters
The parameters of our model may be divided into ‘geometrical’ and ‘physical’. The geometrical parameters describe the distribution of dust around the binary in three dimensions. The physical parameters describe the properties of the stars themselves, as well as the dust grain size and chemistry.
4.1 Physical parameters
It appears that the binary system is composed of a WC9 star and an late-O or early-B dwarf companion, with a luminosity ratio (WC:OB) of 1:2 (Crowther 1997). Using for the WC component (Crowther 1997), and adopting an effective temperature of 30 kK for the OB star, we used the luminosity ratio to determine the radius of the OB component of 10 R⊙. The input SED is a Kurucz Atlas9 model atmosphere () for the OB star, and a CMFGEN (Hillier & Lanz 2001) model for the WC star (Crowther, priv. comm.).
We take our dust parameters from Zubko (1998), who found that amorphous carbon dust grains may form rapidly from small (5Å) seeds to small grains (100Å) by the implantation of impinging carbon ions. Since the grain growth occurs relatively quickly, we adopt a uniform grain radius of 100Å (alternative grain size distributions are considered in Section 5.2.2). The optical constants for the grains were taken from the pure amorphous carbon sample from Zubko et al. (1996), and the opacity and albedo of the grains are shown as a function of wavelength in Figure 3.

4.2 Geometrical parameters
The geometrical parameters of our model are determined from the interferometric imaging. The simplest model that fits the data is that of a linear spiral, viewed at an inclination of 11∘ (Tuthill et al. 1999). The radial motion of the spiral, determined from the 245 d period is 0.303 mas/yr (Tuthill et al. 1999). The fact that we measure the angular speed of the outflow leads to a degeneracy between outflow speed and the systemic distance. For our reference model we adopt the canonical distance of 1.6 kpc (e.g. Lundstrom & Stenholm 1984), which implies an outflow speed of 845 km s-1. We note that this is the reverse approach to that adopted by Tuthill et al. (1999), who used the WR terminal velocity (1220 km s-1, Howarth & Schmutz 1992) to constrain the distance. A possible problem the latter method is that the WR terminal velocity is obtained from the emission line morphology, which is formed in the wind before the wind-wind collision shock. This velocity may not necessarily be representive of the post-shock flow, if for example the WR wind is subjected to radiative braking (e.g. Gayley, Owocki & Cranmer 1997) near the O star.
The three dimensional structure of the dusty spiral is thought to stem from a conic ejection of material from the wind-wind collision interface. The precise geometry of this surface is unknown, although analytical approximations to its shape may be determined from momentum-balance arguments. Eichler & Usov (1993) give the following formula for the semi-opening angle (, in radians)
| (1) |
where
| (2) |
For the WR component we use a mass-loss rate of M⊙ yr-1 (Crowther 1997) and a (pre-shock) terminal velocity of 1220 km s-1(Howarth & Schmutz 1992). For the O-star component we use the empirical mass-loss rate/luminosity relation of Howarth & Prinja (1989), which gives M⊙ yr-1, and adopt a plausible value of 2000 km s-1 for the terminal velocity. These quantities give , and for our reference model we assume that the outflow is spread over small range of semi-opening angles of 17.5–22.5∘. We investigate the effect of changing the cone angle in Section 5.2.1.

We constructed the dust density distribution using a simple ballistic particle model in which mass packets are ejected from the conical surface at the wind speed, and then follow linear trajectories (see Figure 4). The conical surface is rotated according to the 245 d period. This process leads to a spiral density structure. The ensemble of particles is then read into torus, and the adaptive mesh is constructed.

4.3 Free parameters
We have fixed the binary parameters and distance, as well as the dust geometry, chemistry and size distribution. We are then left with effectively three free parameters:
-
•
The dust mass. We compute spiral structure out to 100 binary revolutions (the level of the IR excess at 60µm indicates that their is a significant amount of cool dust). The dust mass is then taken as the total mass in the spiral structure, and can be simply converted to a dust formation rate.
The dust mass is constrained by the mid-to-far infrared (optically thin) parts of the SED. Furthermore, the mass must be great enough to ensure that optical depth in the first spiral revolution is sufficient to shield the outer turns from strong heating by the binary (constrained by the images).
-
•
The dust sublimation temperature. When the radiative equilibrium is calculated, some regions of the spiral will have a temperature greater than that at which dust can survive (). After calculating the radiative equilibrium, cells whose temperature exceeds have their densities set to zero, and are excluded from the rest of the calculation. The density of the dust nebula is then rescaled to ensure that the input dust mass is conserved. A further radiative equilibrium iteration is then necessary (as parts of the spiral which were previously shielded from stellar radiation are now heated). This cycle of radiative equilibrium and cell rejection is repeated until no cells are rejected and temperature convergence is achieved. This process typically requires three or four iterations.
The sublimation temperature is constrained by the near-to-mid IR section of the SED, since the peak of the SED is a measure of the dust temperature close to the central object. If this value is too low, the dust in the inner spiral turn is destroyed, and the outer spiral becomes directly heated by the central binary, in contradiction with the images.
-
•
The foreground extinction. WR104 (along with WR105) is situated behind a strongly obscuring cloud (Lundstrom & Stenholm 1984), and shows a total line-of-sight extinction of (e.g. Williams et al. 1987; Pendleton et al. 1994). It is also apparent that a significant amount of extinction is local to the system. Kato et al. (2002) showed that WR104 varies by over in the optical, with marginal evidence for a periodicity of 245 d in the light curve. Crowther (1997) argued that the variable obscuration arises from dust formation very close to the binary system.
The face-on spiral geometry employed here does not provide a mechanism for variable line-of-sight extinction. It is possible that the variability results from the binary motion behind a sharp density gradient produced during a previous dust-producing episode prior to the current evolutionary phase. We therefore assume that all the extinction is occurring in a region external to the dusty spiral. We find that the 9.7µm silicate feature seen in the ISO spectrum, which must be formed by interstellar grains, requires an optical depth of 0.3 of astronomical silicate (Draine & Lee 1984) to reproduce, and we fix this component of the optical depth in our reference model. The bulk of the extinction we ascribe to local material surrounding the system, but not associated with the current phase of dust production. Given the uncertain nature of the carbonaceous grains in the nebula, we adopt an MRN size distribution for the obscuring dust. We quantify the extinction by the optical depth of this dust at 5500Å ().
We emphasize that the nature of the foreground extinction has little impact on the SED beyond µm, and therefore does not strongly affect the other free parameters of our model, which are well constrained by the peak and long-wavelength tail of the SED.
In addition to the three parameters above, we also investigate the changes to the SED and images from changing the opening-angle of the conical wind-wind collision interface.

5 The reference model
A small grid of SEDs and images was constructed, varying the dust formation rate, the dust sublimation temperature () and the foreground optical depth. It was found that the best fit to the SED had a dust formation rate of M⊙ yr-1, K, and , and this set of parameters was adopted as our reference model (see Table 1).
| Parameter | Value | Adopted/Fitted |
| Period (d) | 245 | Adopted |
| Inclination (∘) | 11 | Adopted |
| .MWR (M⊙ yr-1) | Adopted | |
| .MO (M⊙ yr-1)y | Adopted | |
| (km s-1) | 1220 | Adopted |
| (km s-1) | 2000 | Adopted |
| Cone angle (∘) | 40 | Adopted |
| (K) | 1200 | Fitted |
| Dust speed (km s-1) | 845 | Adopted |
| .Mdust (M⊙ yr-1) | Fitted | |
| Distance (kpc) | 1.6 | Adopted |
The outer turns of the spiral are optically thin, and the temperature structure in this region is expected to be
| (3) |
where . The small grains have an opacity distribution that goes as , and we therefore expect at large distances (Spitzer 1978).
In Figure 6 we plot the azimuthally-averaged radial temperature distribution of the reference model, and the outer turns of the spiral do indeed approximately follow a relation. There is a low temperature gradient along the first turn of the spiral, since much of the dust is very close to . The subsequent turn of the spiral, however, shows a significant temperature drop, since it is effectively shielded from the binary radiation. A transition between the optically thick and optically thin temperature gradients occurs at approximately the third spiral turn, and beyond here the applies.
The model SED (Figure 5) shows reasonable agreement with the data, but once again we stress that the observations in the various wavelength regimes are not contemporaneous. The radiation from the spiral is dominated by thermal dust emission, with a negligible scattered component due to the small grain albedo and the fact that the emission occurs far into the Rayleigh-Jeans tail of the combined WR+O SED.
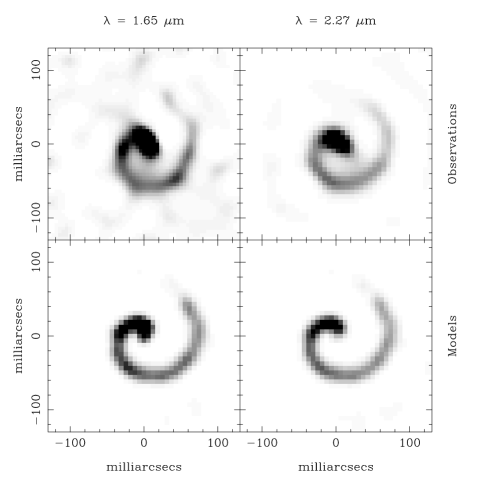
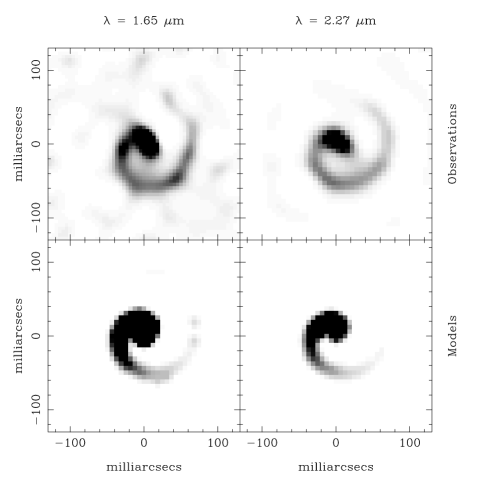
In Figure 7 we show greyscale images of the 1.65µm and 2.27µm models and the data. In order to make a direct comparison we have used the same pixel scale of the observations for our model images, and have smoothed them by a 2-pixel (12 mas) FWHM Gaussian to simulate the finite resolution of the Keck masking interferometry. We have scaled the images in order that the greyscales match in the southernmost part of the spiral, since the peak intensity of the observation is compromised by artifacts introduced by maximum entropy image construction. Qualitatively the model images show reasonable agreement with the interferometry, in particular the extent of the spiral is well-matched, and the increase in flux towards the centre of the spiral. It is interesting to note that the ‘head’ of the spiral 1.65µm is slightly more inclined than that of the 2.27µm image, a pattern that is reproduced in the models, since there is significant photospheric flux at 1.65µm.
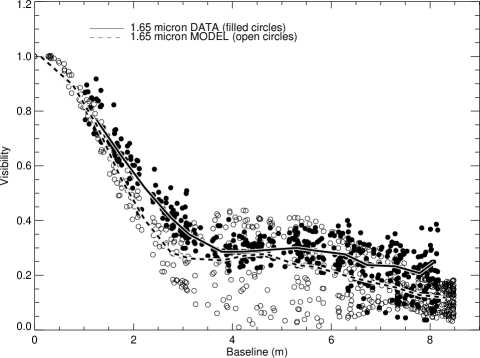
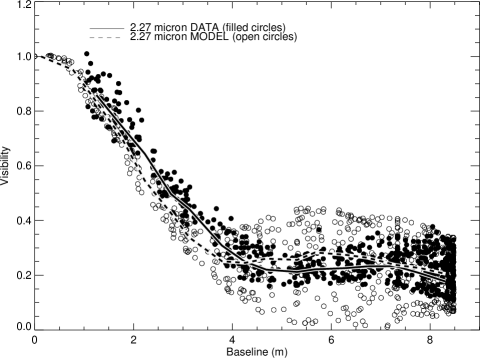
Figure 8 shows a more quantitative comparison between the 1998 April model images and the measured visibility data from aperture masking. In creating this figure, we sampled the model images at the same points as were measured by the aperture mask. The large number of points arises because we sample the visibility data using a 36-hole ‘pseudo’-array (630 baselines) which approximates the continuous Fourier coverage afforded by the ‘annulus’ aperture mask. Note that data points below 1-m baselines were omitted due to poor calibration within the ‘seeing spike’ (see Monnier et al. 2004 for an extensive discussion of calibration issues of Keck aperture masking).
Given the strong resemblance of the model images and the MEM reconstructions in Figure 7, the overall good agreement of the visibility data with the model comes as no surprise. In particular, the 1.65 and 2.27 micron visibility data agree well with model when we consider the azimuthally-averaged behavior (especially in light that the model parameters were not optimized to fit this depiction of the data). That is to say that the model has the correct characteristic sizes at these wavelengths and the right balance of compact features (unresolved on the longest baselines) and diffuse structure (resolved on the longest baselines). However, the model visibilities show much larger variation as a function of position angle for a given baseline length (especially at intermediate baselines between 4–7 m). Simple changes of scale or spiral width do not change this discrepancy, and we hypothesize that this difference arises due to the difficulties in modelling the shape and relative brightness of the central dust condensation.
5.1 Deviations from the reference model
In this section we attempt to quantify the changes in the model that occur if we alter the parameters of the reference model.
5.2 Inclination
We fixed the inclination at 11∘ in the reference model, a value that was determined by Tuthill et al. (1999) by fitting a linear spiral model to the Keck data. We have investigated the effect on the projected images of changing this value, computing images at inclinations of 0, 30, 60 and 90∘ (Figure 9). The spiral nature of the spiral is easily discernible in the image, although such a high inclination is ruled out by the interferometry.
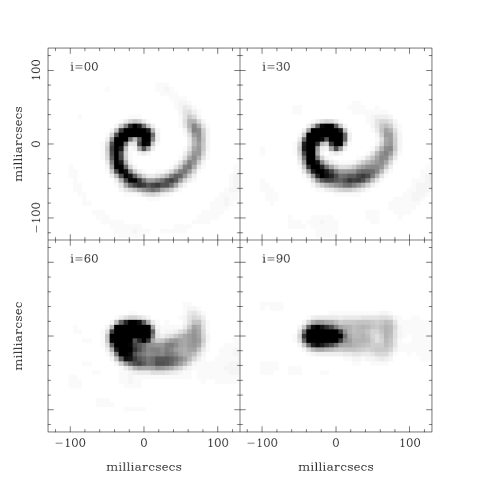
Inevitably the higher () inclination images show much less evidence for the spiral nature of the nebula, although such images will be useful for testing the spiral model against systems that are seen closer to edge on, such as WR137 (Marchenko et al. 1999) and WR140 (Monnier et al. 2002).
5.2.1 Cone angle
The cone angle of the wind-wind collision surface depends on the ratio of the wind momenta of the binary components (equation 1). Since the imaging data may provide a constraint on this quantity we have computed further models, based on the reference parameters but with a semi-opening angle of 80∘ and (we retain the 5∘ spread in the flow).
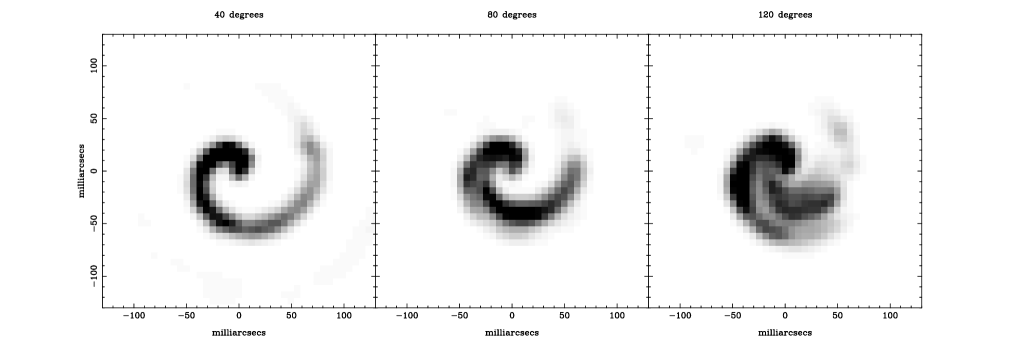
Figure 10 illustrates the effect of varying the cone angle while holding the dust production rate constant leads to a lower-density structure, although the inner turn of the spiral remains optically thick. A larger surface of the inner spiral is heated, and as such the 1–10µm flux from the model increases (the long wavelength flux, where the dust is optically thin, is unaffected by the change in geometry). Increasing the cone angle to 120∘ leads to a pronounced change in the near-IR image (Figure 10), and such a wide angle is clearly ruled out by the interferometry. The visibility curves for the model show that the nebula is too resolved (the visibility drops too fast at short baselines), and that the visibility is too low at long baselines, indicating that the model lacks a central concentration.
5.2.2 Grain size
A uniform grain size of 0.01µm was used for the reference model, based on the theoretic predictions of Zubko (1998). However, there is evidence that some of the grains in the nebula might be considerably larger than this: Chiar & Tielens (2001) found that a grain size of 1µm was required to fit the 6.2µm absorption profile in ISO spectra of WC stars (including WR104), and Marchenko et al. (2002) argued that similarly large (0.5µm) grains were necessary to match the extended dust emission from WR112.
In order to investigate the effect of grain size on our models we computed images and SEDs for a model with a uniform grain size of 1µm. The opacity distribution for these grains is shown in Figure 3. It can be seen that in the long wavelength (Rayleigh) regime the opacity is independent of grain size (and so changes in the dust production rate affect both the small and large grain models equally). The large grains are effectively grey shortwards of 10µm, and the albedo of the dust is much higher () than the 100Å grains for µm. However the opacity of the large grains is two orders of magntiude lower than the small grains near the peak of the binary flux distribution.
The temperature structure of the large grain model is flatter than that of the reference model, with an dependence across virtually the entire computational domain (see Figure 6). Close to the central stars the temperature gradient is marginally steeper, corresponding to a regime where the spiral turns are getting optically thick.
The model images are significantly different to those of the reference model (see Figure 11). For the same dust sublimation temperature the large-grain dust may exist much closer to the central stars, and therefore the emission is much more centrally condensed. The more rapid decline in temperature along the first spiral manifests itself as a sharp intensity gradient along the innermost spiral in both synthetic images. Naturally the SED of the large grain model shows good agreement with the reference model at short wavelengths (where photospheric emission is dominant) and at long wavelengths (where the grain opacity is the same and the dust optically thin). The SEDs deviate in the near-to-mid IR (–10µm), with the large grain model showing reduced emission in this region (Figure 5). This discrepancy is due to the smaller mass of dust near the dust sublimation temperature in the large grain model. Increasing the dust sublimation temperature does not sufficiently increase the flux in this part of the SED, while increasing the dust production rate degrades the agreement with the observations at long wavelengths.
6 Discussion and conclusions
The reference model has a dust production rate of M⊙ yr-1, which compares reasonably well with that derived by Zubko (1998), who used a spherical shell model and found M⊙ yr-1. Similarly, we find a dust sublimation temperature of 1200 K, which is within 20 K of Zubko’s value. The agreement is perhaps unsurprising – the leverage on both quantities comes from the SED, and the mass-loss rate itself is relatively insensitive to the adopted geometry. However, Zubko also noted that the dust in his WR104 model was optically thick in the UV, which rendered his model ‘an approximation’. We also find an optically thick geometry, with , across the densest part of the spiral, although our radiative equilibrium method properly treats these dense regions. If we take a mass-loss rate of M⊙ yr-1 for the WR star (Crowther 1997), and a carbon mass-fraction of 0.5 (Crowther 1997), we find that approximately 2% of the available carbon in the wind condenses into dust.
The dust production rate derived from the reference model is insensitive to the dust grain size distribution, since it is primarily constrained by the long wavelength parts of the SED, where the the dust opacity is independent of size. However the combination of spectral and imaging data allow us to constrain the dust grain size using the near-to-mid IR region of the SED. We find that for the small dust model the high opacity to UV radiation, and the proximity of the dust to the central object determined from the imaging, means that the inner-edge of the first turn of the spiral is heated to close to the dust sublimation temperature. Since the opacity of the large grain model is much (two orders of magnitude) lower in the UV, the heating correspondingly less and we see a smooth temperature gradient along the inner spiral turn, with only the tip of the spiral at the dust sublimation temperature. We therefore prefer the small grain model, although we cannot rule out larger grains further out in the nebula. It is interesting to note that Marchenko et al. (2003) found that small grains (Å) were required to explain the optical extinction to WR140 during periastron passage. The inescapable conclusion is that the dust nebulae around WC binaries contain a range of dust sizes from 0.01–1µm. The presence of such large grains would require modification to grain condensation models, which predict rather slow growth once the grains reach 100Å (Zubko 1998). It is possible that incorporating a more realistic geometry in the dust chemistry calculations, such as the spiral presented here, will allow significant grain growth since large parts of the nebula are shielded from direct stellar radiation and yet still have a relatively high density.
The interferometric imaging appears to rule out opening angles for the wind-wind collision interface of , and the opening angle () adopted in the reference model provides a good fit to both the SED and the images, which lends further support to the binary component parameters estimated by Crowther (1997). Our estimate for the cone angle is similar to that found for WR137 (–; Marchenko et al. 1999) and is slightly smaller than that of WR140, which has estimates of (Monnier, Tuthill & Danchi 2002) and (Marchenko et al. 2003).
Overall the models seem to support the basic paradigm for WR104 of a linear archimedean spiral produced by the rotation of a conical wind-wind collision interface. There are still deficiencies in the model, in particular regarding the structure and opacity of the material very close to the binary, where a more sophisticated description of the geometry may be necessary. For example, we have so far only considered dust opacity, but there will be significant gas opacity in the intra-binary region, which will play a role in reprocessing the direct stellar radiation in the innermost parts of the nebula. Despite these shortcomings, the model is very successful in predicting the gross observational properties of WR104, and also enables us to constrain the dust properties.
WR104 represents perhaps the simplest of the resolved WC+O dust nebulae to interpret due to its face-on orientation and the apparent circularity of its orbit. Nebulae with much more complicated structures occur when the binary is viewed at a higher inclination or if the orbit is eccentric (for example WR98a, WR112, WR137 and WR140). Three-dimensional radiative-transfer modelling represents the only route to deconvolving the true nebula geometry from the projected images in these more complex cases, and further modelling of other colliding wind systems with resolved dust nebulae should provide detailed insights into dust formation in the harsh environments of massive binary systems.
Acknowledgements
We are grateful to Leon Lucy for advice on implementing his radiative equilibrium method. Ilaria Pascucci is warmly thanked for providing the 2-D benchmark SEDs and temperature runs. Paul Crowther is thanked for providing the CMFGEN model SED of WR104. We thank the authors for providing the radiative-transfer code dusty, which is available from http://www.pa.uky.edu/moshe/dusty/. This research made use of the ISO Data Archive, the SIMBAD database, and the ADS abstract service. RK is funded by PPARC standard grant PPA/G/S/2001/00081. Some of the data herein were obtained at the W.M. Keck Observatory, made possible by the support of the W.M. Keck Foundation.
References
- [1] Allen, D.A., Harvey, P.M., Swings, J.P., 1972, A&A, 20, 333
- [Baldwin et al.(1986)Baldwin, Haniff, Mackay, & Warner] Baldwin, J. E., Haniff, C. A., Mackay, C. D., & Warner, P. J. 1986, Nature, 320, 595
- [2] Cherchneff, I., Le Teuff, Y.H., Williams, PO.M., Tielens, A.G.G.M., 2000, A&A, 357, 572
- [3] Chiar, J.E., Tielens, A.G.G.M., 2001, ApJ, 550, L207
- [4] Cohen, M., Barlow, M.J., Kuhi, L.V., 1975, A&A, 40, 291
- [5] Cohen, M., 1995, ApJS, 100, 413
- [6] Conti, P.S., 2000, PASP, 112, 1413
- [Cornwell & Wilkinson(1981)] Cornwell, T. J. & Wilkinson, P. N. 1981, MNRAS, 196, 1067
- [7] Crowther, P.A., 1997, MNRAS, 290, 59
- [8] Dopita, M.A., Groves, B.A., Sutherland, R.S., Kewley, L.J., 2003, ApJ, 583, 727
- [9] Dougherty, S.M., Pittard, J.M., Kasian, L., Coker, R.F., Williams, P.M., Lloyd, H.M., 2003, A&A, 217, 233
- [10] Draine, B.T., Lee, H.M., 1984, ApJ, 285, 89
- [11] Eichler, D., Usov, V., 1993, ApJ, 402, 271
- [12] Gayley, K.G., Owocki, S.P., Cranmer, S.R., 1997, ApJ, 945, 786
- [13] Harries, T.J., 2000, MNRAS, 315, 722
- [14] Harries, T.J., Babler, B.L., Fox, G.K., A&A, 361, 273
- [15] Hillier, J.D., Lanz, T., 2001, in Spectroscopic Challenges of Photoionized Plasmas, ASP Conference Series Vol. 247, G. Ferland and D. Wolf Savin (eds), ASP (San Fransisco), p. 343
- [16] Högbom, J.A., 1974, A&AS, 15, 417
- [17] Howarth, I.D., Prinja, R.K., 1989, ApJS, 69, 527
- [18] Howarth, I.D., Schmutz, W., 1992, A&A, 261, 503
- [19] Ivezic, Z., Nenkova, M., Elitzur, M., 1999, User Manual for dusty, University of Kentucky Internal Report
- [Jennison(1958)] Jennison, R. C. 1958, MNRAS, 118, 276
- [20] Kato, T., Haseda, K., Yamaoka, H., Takamizawa, K., 2002, PASJ, 54, L51
- [21] Kurosawa, R., Hillier, D.J., 2001, A&A, 379, 336
- [22] Kurosawa, R., Harries, T.J., Bate, M.R., Symington, N.H., 2004, MNRAS (in prep)
- [23] Lucy, L., 1999, A&A, 344, 282
- [24] Lundstrom, I., Stenholm, N., 1984, AASup, 58, 163
- [25] Marchenko, S.V., Moffat, A.F.J., Grosdidier, Y., 1999, ApJ, 522, 433
- [26] Marchenko, S.V., Moffat, A.F.J., Vacca, W.D., Côté, S., Doyon, R., 2002, ApJ, 565, L59
- [27] Marchenko, S.V., Moffat, A.F.J., Ballereau, D., et al., 2003, ApJ, 596, 1295
- [28] Mathis, J.S., Rumpl, W., Nordsieck, K.H., 1977, ApJ, 217, 425
- [Matthews & Soifer(1994)] Matthews, K. & Soifer, B. T. 1994, Infrared Astronomy with Arrays: the Next Generation, I. (Dordrecht: Kluwer Academic Publishers), 239
- [Matthews et al.(1996)Matthews, Ghez, Weinberger, & Neugebauer] Matthews, K., Ghez, A. M., Weinberger, A. J., & Neugebauer, G. 1996, PASP, 108, 615
- [Monnier(1999)] Monnier, J. D. 1999, PhD thesis, University of California at Berkeley
- [29] Monnier, J.D., Tuthill, P.G., Danchi, W.C., 1999, ApJ, 525, L97
- [30] Mondal, S., Chandrasekhar, T., 2002, MNRAS, 334, 143
- [31] Monnier, J.D., Tuthill, P.G., Danchi, W.C., 2002, ApJ, 567, L137
- [32] Monnier, J.D., et al., 2004, ApJ (submitted)
- [Narayan & Nityananda(1986)] Narayan, R. & Nityananda, R. 1986, ARAA, 24, 127
- [33] Pascucci, I., Wolf, S., Steinacker, J., Dullemond, C.P., Henning, T., Niccolini, G., Woitke, P., Lopez, B., 2003, A&A, (in press)
- [Pearson & Readhead(1984)] Pearson, T. J. & Readhead, A. C. S. 1984, ARAA, 22, 97
- [34] Pendleton, Y.J., Sandford, S.A., Allamandola, L.J., Tielen, A.G.G.M., Sellgren, K., 1994, ApJ, 437, 683
- [Sivia(1987)] Sivia, D. 1987, PhD thesis, Cambridge University
- [Skilling & Bryan(1984)] Skilling, J. & Bryan, R. K. 1984, MNRAS, 211, 111
- [35] Shakura, N.I., Sunaev, R.A., 1973, A&A, 24, 337
- [36] Steinacker, J., Henning, Th., Bacmann, A., Semenov, D., 2003, A&A, 401, 405
- [37] Spitzer, L., 1978, Physical Processs in the Interstellar Medium, Wiley (New York), p. 194
- [38] Symington, N.H., 2004, PhD Thesis, University of Exeter (in prep)
- [39] Torres-Dodgen, A.V., Massey, P., 1988, AJ, 96. 1076
- [40] Tuthill, P.G., Monnier, J.D., Danchi, W.C., 1999, Nature, 398, 487
- [Tuthill et al.(2000)Tuthill, Monnier, Danchi, Wishnow, & Haniff] Tuthill, P. G., Monnier, J. D., Danchi, W. C., Wishnow, E. H., & Haniff, C. A. 2000, PASP, 112, 555
- [41] van der Hucht, K.A., Morris, P.W., Williams, P.M., et al., 1996, A&A, 315, L193
- [42] Williams, P.M., 1995, in van der Hucht K.A., Williams P.M., eds, Proc. IAU Symp. 163, Wolf-Rayet Stars, Binaries, Colliding Winds, Evolution, Kluwer, Dordrecht, p. 335
- [43] Williams, P.M., 1999, in van der Hucht K.A., Koenigsberger, G., Eenens P.R.J., eds. Proc. IAU Symp. 193, Wolf-Rayet Phenomena in Massive Stars and Galaxies, Astron. Soc. Pac., San Fransisco, p. 267
- [44] Williams, P.M., Longmore, A.J., van der Hucht, K.A., Talevera, A., Wamsteker, W.M., Abbott, D.C., Telesco, B.M., 1985, MNRAS, 215, 23P
- [45] Williams, P.M., van der Hucht, K.A., 1992, in Drissen L., Leitherer C., Nota A., eds, ASP Conf. Ser. Vol. 22, Non-isotropic and Variable Outflows from Stars. Astron. Soc. Pac., San Fransisco, p. 269
- [46] Williams, P.M., van der Hucht, K.A., Kidger, M.R., Geballe, T.R., Bouchet, P., 1994, MNRAS, 266, 247
- [47] Williams, P.M., van der Hucht, K.A., Thé, P.S., 1987, A&A, 182, 91
- [48] Zubko, V.G., Mennella, V., Colangeli, L., Bussoletti, E., 1996, MNRAS, 282, 1321
- [49] Zubko, V.G., 1998, MNRAS, 295, 109