The X-Ray Binary X2127+119 in M15: Evidence for a Very-Low-Mass, Stripped-Giant Companion
Abstract
We present integral field spectroscopy of X2127+119, the luminous X-ray binary in the globular cluster M15, obtained with INTEGRAL/WYFFOS on the William Herschel Telescope. We find that tomograms of He ii 4686 line profiles appear to be incompatible with the previously-assumed view of X2127+119, in which the binary consists of a 1.4- neutron star and a 0.8- sub-giant companion near the main-sequence turn-off for M15. Our data imply a much smaller mass ratio of 0.1. We find that models of X2127+119 with black-hole compact objects give a poor fit to our data, while a neutron-star compact object is consistent with the data, implying that X2127+119’s companion may have a much lower mass (0.1 ) than previously assumed. As an 0.1- main-sequence star would be unable to fill its Roche lobe in a binary with X2127+119’s orbital period (17.1 hours), the companion is likely to be the remnant of a significantly more massive star which has had most of its envelope stripped away.
keywords:
Accretion – Stars: X-ray binaries – Stars: individual: X2127+119, AC2111 Introduction
The X-ray binary X2127+119 (AC211) in the globular cluster M15 is a very enigmatic object: despite being optically the brightest of the globular cluster XRBs, and despite almost 20 years of observations (e.g. Auriére et al. 1984; Ilovaisky et al. 1987; Naylor et al. 1988; Ilovaisky 1989; Ilovaisky et al. 1993), very little is known about the system, due to the extreme difficulties associated with observing sources in the cores of globular clusters. Spectra of AC211 show blue-shifted Balmer and H i absorption, each line often consisting of several blue-shifted absorption components at different velocities (e.g. Ilovaisky 1989), indicating a complex, structured mass outflow from the system. However, the spectra have never had the signal-to-noise, nor the orbital phase coverage, necessary to enable an understanding of the nature of AC211’s mass outflows.

AC211 is an accretion disc corona (ADC) source: a high inclination system in which the compact object is permanently obscured behind the accretion disc rim, and from which we therefore detect only a small fraction of the intrinsic X-ray flux. Little is known about AC211’s compact object, or about its donor star. It is assumed that the former is a neutron star rather than a black hole, on the grounds that all the other globular cluster low-mass X-ray binaries (LMXBs) contain neutron stars. Observed X-ray bursts previously assumed to have come from AC211 (e.g. Dotani et al. 1990) are now believed to have been produced by a newly-discovered second LMXB in the core of M15, 3 arcsec from AC211 (White & Angelini 2001), so AC211’s status as a neutron-star system is no longer as certain as previously believed. From its high optical luminosity and inferred intrinsic X-ray flux, it is believed that AC211 has a high mass transfer rate (e.g. Charles, Jones & Naylor 1986). Together with its long orbital period (17.1 hours), this has led to the assumption that the donor star must be a sub-giant which has relatively recently begun to evolve off the main sequence. The main sequence turn-off point for M15 corresponds to 0.8 (Fahlman et al. 1985), which has therefore been assumed to be the mass of AC211’s donor.
AC211 lies within an exceptionally crowded stellar field, dominated by giants significantly more luminous in the optical wave-band. As a result, ground-based spectroscopy of AC211 has been heavily contaminated by the cluster background (e.g. Naylor et al. 1988; Ilovaisky 1989). The HST/STIS is able to resolve AC211 and provide spectra free from cluster background light (Ioannou et al. 2003), but temporal coverage with the HST is poor: four to five orbits of HST spectroscopy (a typical allocation) covers only 15-20 % of AC211’s 17.1-h orbital cycle.
The background-subtraction problems endemic to ground-based spectroscopy of AC211, and the impossibility of obtaining long, uninterrupted observing runs with the HST, therefore led to a desire for high-spatial-resolution two-dimensional spectroscopy of the cluster core. We believed that ground-based integral field spectroscopy would enable us to remove the cluster-core contamination from AC211’s spectra, and at the same time give us much longer observing runs and greatly improved temporal coverage.
2 Observations
We conducted two observing runs on AC211 (3 nights in August 1999, 5 nights in July 2001) using the INTEGRAL/WYFFOS integral field spectrograph (Arribas et al. 1998; Bingham et al. 1994) on the William Herschel Telescope (WHT) on La Palma. We used a grating of 1200 g/mm and the fibre bundle SB1 which gave a 7.8 6.4-arcsec field of view, each fibre having a 0.45-arcsec core diameter. This set-up gave us a spectral resolution of 1.4 Å. Table 1 gives the log of observations. Each INTEGRAL exposure produces typically 200 individual spectra, which can be reconstructed to form wavelength-resolved images.
The data were reduced using tasks in the multi-fibre spectroscopy analysis package noao.twodspec.apextract in iraf, which extracts 205 spectra from each exposure and corrects them for fibre-throughput variations, removes scattered light, and performs wavelength calibration. The spectra were not flux-calibrated, but were normalized to the continuum. The resulting sets of spectra could then be used to construct surface maps of the cluster core at any wavelength in the spectral range. To remove the cluster-core contamination from AC211’s spectra we used the spectra from the fibres surrounding AC211’s location to interpolate and subtract the cluster-core background, essentially performing ‘aperture photometry’ for each interval of each spectrum. A discussion of background-subtraction with INTEGRAL spectra is given in Arribas, Mediavilla & Fuensalida (1998) and references therein.
| Date | Spec. Range | Dispersion | No. | Texp/Exp. |
|---|---|---|---|---|
| (Å) | (Å) | Exps | (s) | |
| 19/8/99 | 4310 - 4920 | 0.65 | 21 | 900 |
| 20/8/99 | 4310 - 4920 | 0.65 | 27 | 900 |
| 21/8/99 | 4310 - 4920 | 0.65 | 27 | 900 |
| 07/7/01 | 4310 - 4920 | 0.65 | 04 | 1500 |
| 08/7/01 | 4310 - 4920 | 0.65 | 07 | 1500 |
| 09/7/01 | 4310 - 4920 | 0.65 | 12 | 1500 |
| 10/7/01 | 4310 - 4920 | 0.65 | 07 | 1500 |
| 11/7/01 | 4310 - 4920 | 0.65 | 11 | 1500 |
| H | H | He i 4388 | He i 4471 | He i 4713 | |
|---|---|---|---|---|---|
| km s-1 | km s-1 | km s-1 | km s-1 | km s-1 | |
| 1999 | –306 7 (a) | –317 10 (a) | –161 29 | –327 14 | –70 21 |
| –46 15 (e) | –107 17 (e) | –76 11 | |||
| 2001 | –209 9 (a) | –242 13 (a) | –36 42 | –108 11 | –102 16 |
| –70 17 (e) | –26 17 (e) |
a = absorption component, e = emission component
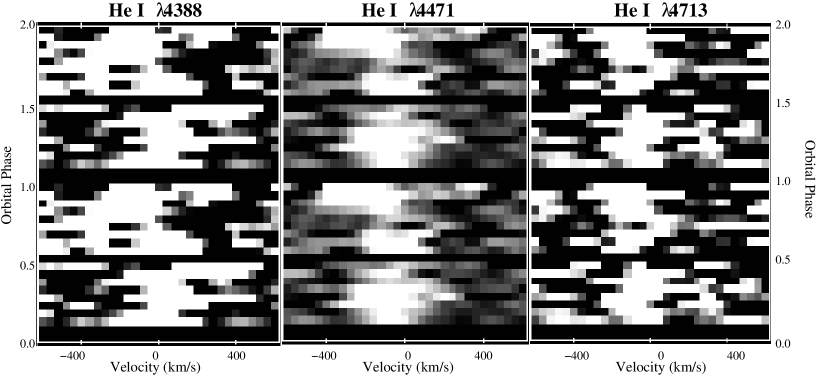
Fig. 1 shows the mean AC211 and cluster background spectra from the August 2001 observing run. The top spectrum is the background-subtracted mean spectrum for AC211. The bump near 4680 Å in the cluster background spectrum is an artefact of the continuum-flattening routine we used, which was chosen in such a way as to preserve any structure in the He ii 4686 wings. The same continuum-fitting parameters are used for all the background and target fibres of individual exposures, and therefore the artefact is completely removed when the background spectra are subtracted from the AC211 spectra.
The quality of the 1999 dataset is poorer compared to that of 2001. There are three reasons for this: (i) in 2001 we used longer integration times for each exposure (1500 s as opposed to 900 s), (ii) in 1999 the seeing was poor (2 arcsec), while in 2001 it was excellent (0.5-1 arcsec), and (iii) in 1999 the spectrograph’s CCD detector was not properly earthed, so that an oscillating signal from the power supply was injected into each exposure as the CCD was read out, with the result that a prominent pseudo-sinusoidal pattern was incorporated into each extracted spectrum. Fortunately, the oscillation patterns in each of the 205 spectra within an individual exposure had approximately similar frequencies, amplitudes and phases, and therefore these superimposed signals could be removed reasonably successfully simply by subtracting the cluster background.
3 Results and Discussion
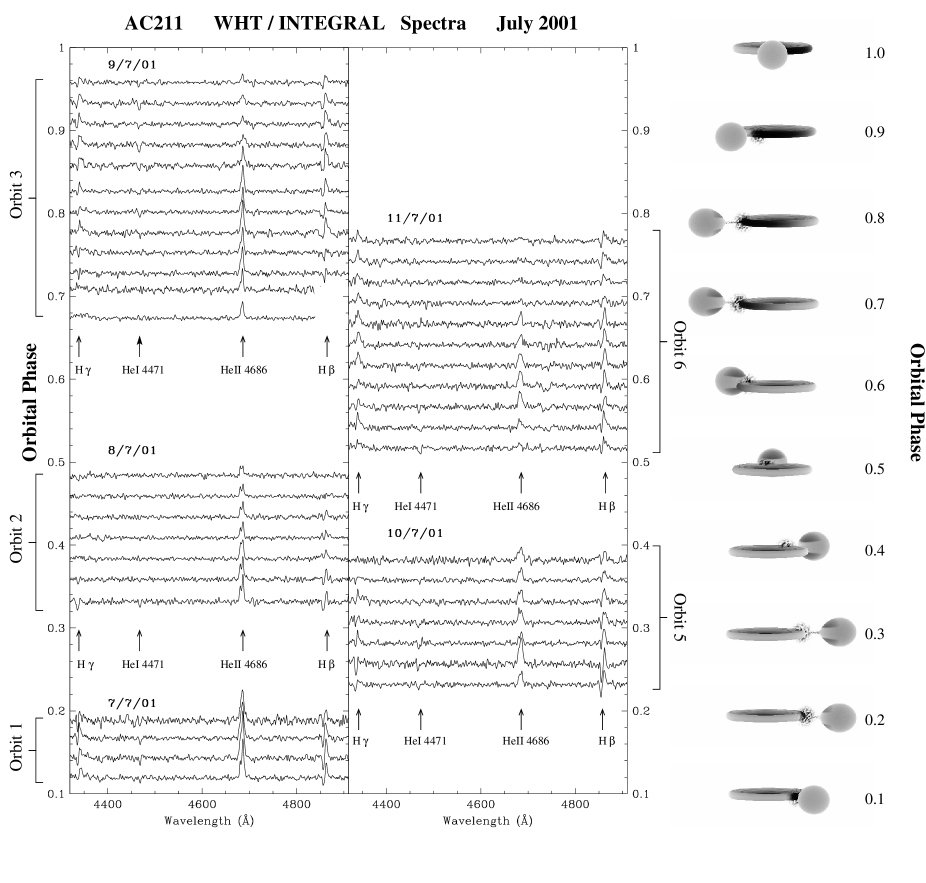
Fig. 1 shows that the background-subtraction technique discussed above is successful. Subtraction removes all spectral lines except those unique to AC211. The clear P Cyg profiles of AC211’s H and H lines (first noted by Ilovaisky et al. 1989) are revealed, and He i 4388, He i 4471 and He i 4713 appear in absorption. Further evidence for the P Cyg profiles in the background-subtracted spectra being real rather than artefacts of the subtraction process is the clear asymmetry in the mean unsubtracted AC211 Balmer lines in Fig. 1. Because of the poorer quality of the 1999 spectra, we were unable to remove the background from the Balmer lines as successfully. However, the 1999 spectra show clear, clean He ii 4686 emission, since the background is flat in this wavelength region.
In Table 2 we list the line velocities (obtained by fitting Gaussians – double Gaussians in the case of P Cyg profiles – to the lines) with respect to the cluster (which has a radial velocity of km s-1; Peterson, Olszewski & Aaronson 1986) for the 1999 and 2001 mean spectra. The short vertical bars in Fig. 1 indicate the rest wavelengths (relative to the cluster) of the relevant lines; AC211’s absorption lines are clearly blue-shifted with respect to the cluster velocity. These observations are consistent with results from previous observations (e.g. Naylor et al. 1988, 1989; Ilovaisky et al. 1989).
In Fig. 2 we plot trailed spectrograms of the He i lines in the 2001 dataset. In all the spectrograms and Doppler maps in this paper, the individual spectra have been normalized to the continuum and and the sense of the grayscales is such that absorption features appear light and emission features appear dark. The flux scales used are arbitrary and have been chosen to maximize the contrast between the absorption features and the continuum. In the 1999 dataset, only the He ii 4686 profiles have sufficient signal-to-noise to warrant trailing (see Fig. 5), while in the 2001 dataset, the extreme variability of the He ii 4686 emission renders trailing meaningless. The trailed spectra in Fig. 2 are phase-binned and folded on AC211’s orbital period. Conclusions drawn from the spectrograms should be treated with caution: the spectra are obtained from different orbital cycles, and in Fig. 3 we show that spectra of similar orbital phase but from different orbital cycles can be remarkably different.
In Fig. 3 we have stacked the individual spectra from the July 2001 observations with respect to orbital phase. Alongside the spectra we have plotted simple cartoons of an X-ray binary, in order to highlight any relationships between spectral features and components of the binary system. The cartoons do not, however, show the structure of the accretion disc rim. X-ray observations (Ioannou et al. 2002) indicate that AC211’s disc has a very large disc bulge which extends 90∘ along the disc rim from the stream impact point along the direction of rotation. The location (but not the vertical extent) of the bulge is indicated by the darker shading on the disc edges in the cartoons. The X-ray observations also indicate that the structure of the disc bulge can vary dramatically from orbit to orbit.
3.1 The He i lines
Although the He i lines in Fig. 2 are very weak, they show a clear orbital-phase dependence and a net blue-shift, which is consistent with previous observations (Naylor et al. 1988; Ilovaisky 1989). He i 4388 appears to have a maximum blue-shift near phase 0.75; a motion normally associated with the companion star. Alternatively, He i 4388 absorption with this motion may occur in material splashing off the stream-disc impact site (the bright spot). It should be noted, however, that the He i 4388 line is very weak, and the apparent phase-0.75 maximum blue-shift may not be real. In fact, apart from this feature, this line appears much the same as the other He i lines. He i 4471 and He i 4713 have motions with maximum blue shifts occurring near phase 0.0. No obvious component within the binary’s geometry moves with this motion.
In Fig. 3 He i 4471, the strongest of the He i lines, appears strong between phases in orbital cycles 1 and 5, phases between which there is no disc-bulge obscuration and therefore where the thickness of the outer accretion disc is lowest, allowing us to see into the disc’s hot inner regions. However, He i 4471 is also strong between phases in orbit 3 and between phases 0.5 and 0.6 in orbit 6, phases at which the disc bulge obscures our view of the inner disc, indicating that the disc/stream impact region may be a source of the 30 000 K continuum required for He i 4471 absorption. However, it is not clear why He i 4471 should be so weak between phases in orbit 2; phases at which disc-bulge obscuration should be insignificant. From this figure it is clear that He ii 4686 can vary dramatically in strength from orbit to orbit; perhaps so too can He i 4471.
3.2 The Balmer lines
The H and H radial velocities in Table 2 seem to imply that AC211’s Balmer lines are produced in an outflow more complex than a simple spherically-expanding wind: both the emission and absorption components of their P-Cyg profiles are blue shifted. This may imply that the outflow in which the Balmer lines are formed is not spherically symmetric, and that we observe more material approaching than receding. HST observations of AC211’s He ii 1640 (Ioannou et al. 2003) indicate that the outflowing line-producing material exists predominantly above and below the accretion disc, with very little emitting material flowing along the orbital plane.
In Fig. 3 the H and H P Cyg components exhibit significant changes in line depth/height and velocity. However, it is not possible to tell whether these effects are intrinsic to the line profiles, or whether they are artefacts due to over- or under-subtraction of the cluster-background Balmer profiles.
3.3 The He ii 4686 line
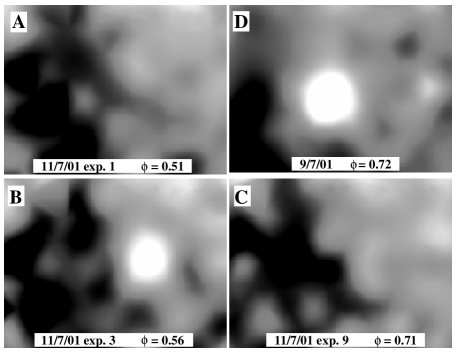
The most prominent feature of the AC211 INTEGRAL spectra, the He ii 4686 emission line, is also the most unstable (Fig. 3), most notably in the 2001 data. Its flux and profile changes dramatically from orbit to orbit, and even from exposure to exposure. Fig. 4 illustrates this variability with 4.53.5-arcsec images of the core of M15 reconstructed from continuum-divided He ii 4686 light. In the first exposure (Fig. 4 A) AC211 has no detectable He ii flux above the continuum level; by the third (Fig. 4 B), the He ii flux is strong, but by the 9th exposure (Fig. 4 C), it has switched off again. In the final panel (Fig. 4 D), an image at the same orbital phase obtained two nights (and three orbital cycles) previously, in which the He ii flux is extremely strong and steady, is plotted for comparison.
It is interesting to note that in the exposures in which He ii 4686 is ‘off’, the Balmer lines still show P Cyg profiles (Fig. 3), indicating that the Balmer- and He ii-emitting regions do not coincide. Even more intriguingly, He i 4471 remains present in absorption, indicating that despite significant obscuration, an extremely hot (30,000 K) source of continuum radiation remains visible.
The orbital phases at which the He ii 4686 flux occasionally but dramatically ‘switches off’, 0.5 to 0.7, correspond to the phases during which the region around the compact object would be obscured from our line-of-sight by the bulge in the inner part of the accretion disc created by the re-impact of an accretion stream overflowing the disc rim (see Ioannou et al. [2003] for the evidence for and a discussion of this feature in AC211’s disc). It is possible that this strongly variable He ii 4686 flux is the result of ‘blobbiness’: variations in the height or thickness of the obscuring material. Obscuration by structure in the disc seems the only plausible explanation: it may perhaps be possible to turn the He ii flux on and off by modulating the mass-transfer rate onto the compact object, but this is unlikely to produce the rapid and sharp variations in the He ii 4686 flux that we observe. In addition, the most dramatic variability occurs at phases associated either with the disc bulge resulting from the stream impact site on the disc edge or with the inner disc bulge associated with stream overflow and re-impact (however, without more extensive observations, it is not possible to know whether the variability always occurs at these phases).
In addition to disc-rim obscuration of the region around the compact object with respect to our line-of-sight, another possible explanation for the He ii 4686 variability may be disc-rim obscuration of the inner disc with respect to the companion star. Doppler tomograms (Figs. 5 and 6) indicate that some of the He ii 4686 emission may be the result of X-ray reprocessing off the face of the companion star, and in § 4 we argue that there may be evidence that AC211 has an extreme mass ratio. If the latter is true, and if the height of the disc bulge varies from orbit to orbit, it is possible that the bulge may sometimes subtend a larger angle, as seen from the compact object, than the companion star, thereby shielding the latter from irradiation. This could account for the absence of some, but not all, of the He ii 4686 emission (provided that X-ray irradiation of the companion from the ADC can be ignored).
If the variation in He ii 4686 flux is a result of disc rim or disc bulge obscuration, the rapidity of the flux variations implies that the disc rim or bulge has an unstable structure, or that the accretion stream impacting the disc bulge contains blobs of different density (not unlikely, given the evidence for ‘blobby’ accretion stream flows in AM Her stars; e.g. Warner 1995), some causing larger increases in disc-bulge height on impact, or producing more splash, than others.
The orbit-to-orbit variation in He ii 4686 flux may also imply that the accretion disc is tilted and precesses. However, AC211’s long-term X-ray light curve shows no sign of the modulations characteristic of precessing, tilted discs (Charles, Clarkson & van Zyl 2002). In addition, we observe evidence for variable bulge obscuration in X-ray observations of AC211 (Ioannou et al. 2002), making this, rather than a tilted disc, the more likely reason for the He ii 4686 flickering.
This strong He ii 4686 variability is difficult to reconcile with what we know about AC211 from previous observations. He ii emission is understood to come from an accretion disc corona (ADC; e.g. Fabian, Guilbert & Callanan 1987; Naylor et al. 1988), an extended region of low-density, X-ray irradiated material above and below the accretion disc. X-ray and UV observations of AC211 (Ioannou et al. 2002, 2003) show that the ADC is substantially larger than the size of the companion star; for example, in the UV the He ii 1640 line is not eclipsed (Ioannou et al. 2003).
These results indicate that the He ii emission region lies well above the accretion disc, unobscured by the companion or disc bulge throughout the orbit. The ADC is exposed to an intense X-ray flux from the compact object and inner disc; we would therefore expect He ii recombination to occur predominantly in the outer, cooler regions of the ADC, unobscured by the disc bulge, which is how the He ii 1640 emission behaves. Our He ii 4686 data indicate that either He ii 4686 recombination somehow occurs in regions of the ADC closer to the accretion disc than the He ii 1640 recombination region (assumed to be in the outer regions of the ADC), or that at the time of the 2001 INTEGRAL observations, the mass-transfer rate onto the compact object – and therefore the accretion luminosity – was lower. However, the XTE ASM shows no change in AC211’s X-ray flux during this period.
3.4 Trailed spectrograms, Doppler tomograms and the mass ratio of AC211
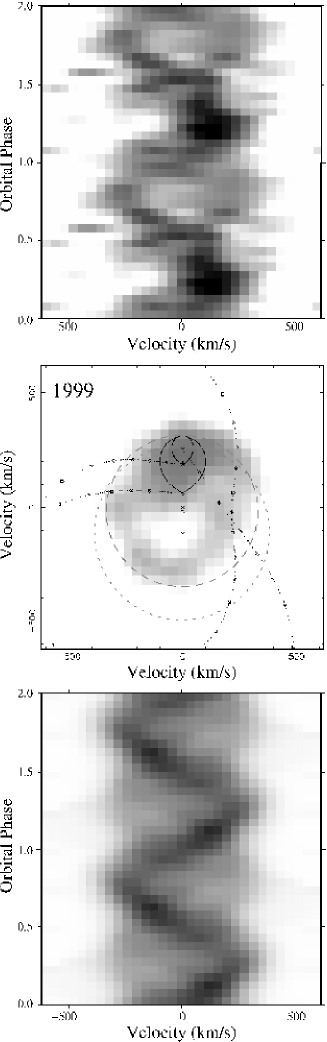
In Fig. 5 we plot He ii 4686 spectrograms, folded on orbital phase, from our 1999 dataset. This shows evidence for an S-wave feature which is at greatest blue-shift near phase 0.8. The 2001 data shows strong variability that doesn’t repeat with the orbital cycle, and does not have complete phase coverage, and thus is less useful for creating a phase-resolved trail.
Doppler tomography can be a helpful tool in interpreting trailed spectra, thus Fig. 5 also contains a Doppler tomogram obtained using the maximum-entropy method (Marsh & Horne 1988). Again, we only show this for the 1999 data, where the trail shows similar flux levels over the orbital cycle. The strong variability of the 2001 data violates an assumption of Doppler tomography, that there are no changes in visibility over the cycle.
The S-wave feature maps to a bright region in the tomogram near velocity coordinates (0, 200) km s-1. Underlying this is a diffuse ring of emission with a radius of 300 km -1.
The reconstructed trail (Fig. 5, bottom panel) compares well with the observed trail, suggesting the Doppler map is a reasonable representation of the orbital average He ii 4686 emission distribution.
The diffuse ring in the Doppler map can be associated with accretion disc emission. Another possibility would be emission from a wind, which, owing to its out-of-plane velocity, would appear ‘defocussed’ in the tomogram. However, if this were the case, the trail spectrogram would show a strong asymmetry, equal to the velocity of the ring, which is not seen.
If the ring feature results from a disc, the ring radius corresponds to the velocity of the outer disc edge, and the ring centroid should be located at the orbital velocity of the compact object. Also, an S-wave feature normally results from emission either from the irradiated secondary star, or from the disc edge where it is struck by the accretion stream.
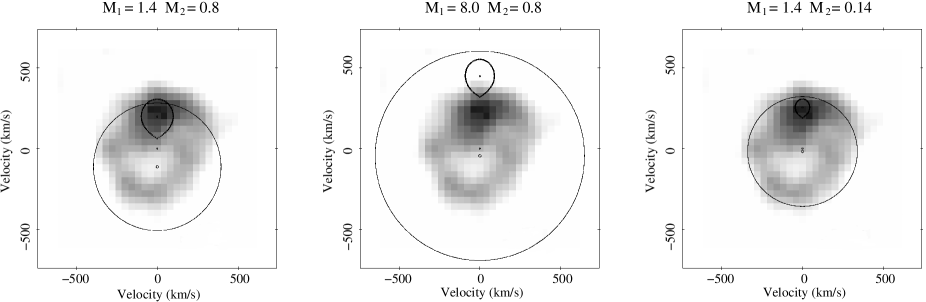
We have overplotted on the tomogram the Keplerian disc velocities and secondary Roche lobes for the two mass ratios and , and assuming that the compact-star is a neutron star with a canonical mass of 1.4 . The value then corresponds to a companion mass of 0.8 , which is M15’s main sequence turn-off mass. The second value, is then chosen as a much-smaller value, appropriate to a 0.1 companion.
The tomogram argues against the larger mass ratio of since the observed ring feature is clearly offset from the expected location, and is not concentric with the Roche lobe of the primary (see Fig. 6, left panel).
On the other hand, the observed feature is concentric with the primary’s Roche lobe for a significantly smaller mass ratio near (see Fig. 6, middle panel and right panel, which have but different primary masses).
With the small mass ratio but high primary mass ( = 8 ; Fig. 6, middle panel) the ring velocities are much lower than would be expected for disc emission. In particular, the S-wave feature is at too low a velocity to be associated with the secondary.
However, with the small mass ratio and a smaller primary mass of (Fig. 6, right panel), the S-wave is then coincident with the secondary star, and so is compatible with an origin on the irradiated secondary. Further, the velocities of the ring are closer to the expected Keplerian velocities of a disc. In fact, the ring velocity is somewhat lower than the expected Keplerian velocity. However, sub-Keplerian outer disc velocities (whether real or a consequence of an incomplete understanding of how lines form in discs) are not uncommon: the phenomenon has been observed in several systems, for example Z Cha, whose outer disc velocity is sub-Keplerian by 30% (Wade & Horne 1988), and X1822–371 (Harlaftis, Charles & Horne 1997).
Thus, despite the limitations of Doppler tomography in data of limited quality, the tomograms suggest that the mass ratio of AC211 is low () and that the compact-star mass is nearer that of a neutron star (1.4 ) than a typical black-hole mass (8 ).
4 The evolutionary status of AC211
The tomography presented in Fig. 6 argues against the companion mass being near the 0.8 turn-off mass of M15, instead suggesting that the compact object is a neutron star, and the companion mass as low as 0.1 .
It has in the past been assumed (e.g. Naylor et al. 1988; Bailyn, Garcia & Grindlay 1989) that AC211’s high luminosity, and by implication high mass transfer rate, has been fuelled by the expanding envelope of a companion evolving off the main sequence. A companion with a mass much lower than the main-sequence turn-off mass therefore leads to two difficulties: (i) a lower-mass star would not yet have started evolving off the main sequence and would therefore be unable to fill its Roche-lobe in a binary with a 17.1-h orbital period, and (ii) a low-mass companion would give a mass-transfer rate too low (e.g. Pringle 1985; Edwards & Pringle 1987; Podsiadlowski, Rappaport & Pfahl 2002) to account for AC211’s luminosity.
Both these difficulties could be solved if the companion was once a much more massive star which has had most of its envelope stripped off. Evolved companion models, in which nuclear evolution drives the mass transfer, have been developed by Taam (1983) and Webbink, Rappaport & Savonije (1983). All the properties of the companion star depend on the mass of its helium core, and not on its total mass . Hydrogen shell burning increases , which in turn increases the radius of the companion’s envelope, which drives the mass transfer. will increase, and the companion’s envelope will be stripped away through Roche lobe overflow, until , at which point the companion loses its envelope and detaches from its Roche-lobe, becoming a low mass helium white dwarf.
King (1993) has shown that the companion star in the black hole candidate system V404 Cyg conforms to a stripped-giant model. By inserting AC211’s orbital period into King’s equations, we obtain minimum-mass and maximum-mass solutions of 0.15 and 0.98 respectively for , and 0.15 and 0.17 respectively for . (The minimum-mass solution is found by assuming that , i.e. that the companion has had its envelope removed, while the maximum-mass solution is found by assuming the Schönberg-Chandrasekhar limiting mass for of 0.17 , below which the companion would not have left the main sequence.) The results from our Doppler maps appear to be consistent with the lower end of this range, where is close to , which would imply that the companion has had most of its envelope stripped away.
There is no reason why a very low mass, stripped-giant companion could not provide an accretion rate sufficient to power AC211’s luminosity. The luminosity intercepted by the companion star may be several orders of magnitude greater than its internal luminosity (Phillips & Podsiadlowski 2002), and the change in the entropy in the layer where the irradiation flux is thermalized may drastically change the equilibrium structure of the star, which may lead to significant expansion (Podsiadlowski 1991). A mass ratio of 0.1 would mean that the companion is shielded from the compact object by the disc rim; however, it would still be exposed to X-ray irradiation from the ADC. If the ADC scatters a fraction of only of the system’s X-ray flux onto the companion, that would be enough to completely change its structure and drive up the mass transfer rate (Podsiadlowski 2001, private communication). Irradiation-enhanced mass transfer is a significant possibility in AC211: our He ii 4686 Doppler maps indicate that the companion is indeed being irradiated.
Although the results of our tomograms need to be treated with caution considering the quality of our data and our limited spectral and temporal resolution, we nevertheless believe that these results point to a significantly different mass-ratio for the system, and therefore provide us with a valuable insight into the evolutionary state of AC211.
Acknowledgments
This paper is based on observations made with the William Herschel Telescope operated on the island of La Palma by the Isaac Newton Group in the Spanish Observatorio del Roque de los Muchachos of the Instituto de Astrofisica de Canarias.
LvZ would like to thank Rob Hynes for the use of his binsim binary visualization code, Philipp Podsiadlowski for useful discussions, and Tom Marsh for the use of his molly, doppler and trailer spectral analysis software. LvZ acknowledges the support of scholarships from the Vatican Observatory, the National Research Foundation (South Africa), the University of Cape Town, and the Overseas Research Studentship scheme (UK).
TN acknowledges the support of a PPARC Advanced Fellowship during part of this work.
We would like to thank the anonymous referee for helpful comments.
References
- [1] Arribas S., et al. 1998, , SPIE, 3355, 821
- [2] Arribas S., Mediavilla E., Fuensalida J.J. 1998, ApJ, 505, L43
- [3] Auriére M., Le Févre O., Terzan A. 1984, A&A, 138, 415
- [4] Bailyn C.D., Garcia M.R., Grindlay J.E., 1989, ApJ, 344, 786
- [5] Bingham R.G., Gellatly D.W., Jenkins C.R., Worswick S.P. 1994, SPIE, 2198, 56
- [6] Charles P.A., Jones D.C., Naylor T., 1986, Nat., 323, 417
- [7] Charles P.A., Clarkson W.I., van Zyl L. 2002, NewA, 7, 21
- [8] Dotani T. et al., 1990, Nat., 347, 534
- [9] Durrell P.R. & Harris W.E. 1993, AJ, 105, 142
- [10] Edwards D.A. & Pringle J.E. 1987, NMRAS, 229, 383
- [11] Fabian A.C., Guilbert P.W., Callanan P.J. 1987, MNRAS, 225, 29P
- [12] Fahlman G.G., Richer H.B., Vandenberg D.A., 1985, ApJS, 58, 225
- [13] Harlaftis E.T., Charles P.A., Horne K. 1997, MNRAS, 285, 673
- [14] Hellier C. 2000, New Astronomy Reviews, 44, 131
- [15] Homer L., Charles P.A. 1998, NewA, 3, 435
- [16] Ilovaisky S.A., et al. 1987, A&A, 179, L1
- [17] Ilovaisky S.A. 1989, Proc. 23rd ESLAB Symp. on Two Topics in X-Ray Astronomy, ESA SP-296, p145
- [18] Ilovaisky S.A., Aurière M., Koch-Miramond L., Chevalier C., Cordoni J.-P., Crowe R.A. 1993, A&A, 270, 139
- [19] Ioannou Z., Naylor T., Smale A.P., Charles P.A., Mukai K., 2002, A&A, 382, 130
- [20] Ioannou Z., van Zyl L., Naylor T., Charles P.A., Margon B., Koch-Miramond L., Ilovaisky S. 2003, A&A, 399, 211
- [21] King A.R. 1993, MNRAS, 260, L5
- [22] Marsh T.R., Horne K. 1988, MNRAS, 235, 269
- [23] Naylor T., Charles P.A., Drew J.E., Hassall B. J.M., 1988, MNRAS, 233, 285
- [24] Naylor T., Charles P.A., 1989, MNRAS, 236, 1p
- [25] Peterson R.C., Olszewski E.W., Aaronson M. 1986, ApJ, 307, 139
- [26] Phillips S.N., Podsiadlowski Ph. 2002, MNRAS, 337, 431
- [27] Podsiadlowski Ph. 1991, Nature, 350, 136
- [28] Podsiadlowski Ph., Rappaport S., Pfahl E. 2002, ApJ, 565, 1107
- [29] Pringle J.E. 1985, in Interacting Binaries, eds. J.E. Pringle & R.A. Wade, Cambridge University Press, p1
- [30] Taam R.E. 1983, ApJ, 270, 694
- [31] Wade R.A., Horne K. 1988, ApJ, 324, 411
- [32] Warner B. 1995, Cataclysmic Variable Stars, Cambridge University Press
- [33] Webbink R.F., Rappaport S.A., Savonije G.J. 1983, ApJ 270, 678
- [34] White N.E., Angelini L., 2001, ApJ, 561, L101