Optical, UV, and EUV Oscillations of SS Cygni in Outburst111Dedicated to my colleague and friend Janet Akyuz Mattei, who this year celebrates her 30th year as director of the American Association of Variable Star Observers. ,222Based in part on observations with the NASA/ESA Hubble Space Telescope obtained at the Space Telescope Science Institute, which is operated by the Association of Universities for Research in Astronomy, Incorporated, under NASA contract NA5-26555.
Abstract
I provide a review of observations in the optical, UV (HST), and EUV (EUVE and Chandra LETG) of the rapid periodic oscillations of nonmagnetic, disk-accreting, high mass-accretion rate cataclysmic variables (CVs), with particular emphasis on the dwarf nova SS Cyg in outburst. In addition, I drawn attention to a correlation, valid over nearly six orders of magnitude in frequency, between the frequencies of the quasi-periodic oscillations (QPOs) of white dwarf, neutron star, and black hole binaries. This correlation identifies the high frequency quasi-coherent oscillations (so-called “dwarf nova oscillations”) of CVs with the kilohertz QPOs of low mass X-ray binaries (LMXBs), and the low frequency and low coherence QPOs of CVs with the horizontal branch oscillations (or the broad noise component identified as such) of LMXBs. Assuming that the same mechanisms produce the QPOs of white dwarf, neutron star, and black hole binaries, this correlation has important implications for QPO models.
Optical, UV, and EUV Oscillations of SS Cygni in Outburst
1 Introduction
Rapid periodic oscillations have been studied in cataclysmic variables (CVs; war95 ) since the early 1970s in the optical and the early 1980s in the extreme ultraviolet (EUV) and soft X-rays rob76 ; pat81 ; war04 . (Nominally) nonmagnetic, disk-accreting, high mass-accretion rate (“high-;” novalike variables and dwarf novae in outburst) CVs manifest “dwarf nova oscillations” (DNOs) with periods –30 s and high coherence (–), as well as “quasi-periodic oscillations” (QPOs) with longer periods (by a factor of , see §3) and far lower coherence (–). In contrast, the oscillations of intermediate polars/DQ Her stars pat94 , the white dwarf analogues of accretion-powered X-ray pulsars, have longer periods (–7190 s) and far higher coherence (–). While the pulsation periods of intermediate polars vary gradually (), those of dwarf novae vary significantly during dwarf nova outbursts, decreasing on the rising branch and increasing on the declining branch of the outburst.
Although QPO research in compact binaries largely shifted to LMXBs in the mid-1980s, the study of rapid oscillations in CVs continues to be of value because of the many similarities between CVs and LMXBs, because CVs are in many ways better laboratories in which to study accretion processes (the mass-accretion rate varies systematically by three orders of magnitude during dwarf nova outbursts, the peak luminosities are well below the Eddington value, radiation pressure is unimportant, and relativistic effects are insignificant), because CV oscillations can be studied from the ground in the optical with modest-size telescopes, and because CVs offer unique diagnostics of the oscillations in the optical, UV, and EUV. Since the date of this meeting, Warner war04 has supplied an excellent review of the oscillations of CVs, particularly those in the optical. This contribution concentrates on observations of oscillations in the optical, UV, and EUV flux of the best-studied CV, the dwarf nova SS Cyg. During outburst, oscillations have been detected in its optical pat78 ; hor80 ; hil81 ; pat81 , UV (HST) [§4], and EUV/soft X-ray (HEAO 1, EXOSAT, ROSAT, and EUVE) cor80 ; cor84 ; jon92 ; mau96 ; tes97 ; mau01 ; mau02 flux with periods ranging from 3 s to 11 s.
2 Simultaneous Optical, UV, and EUV Observations
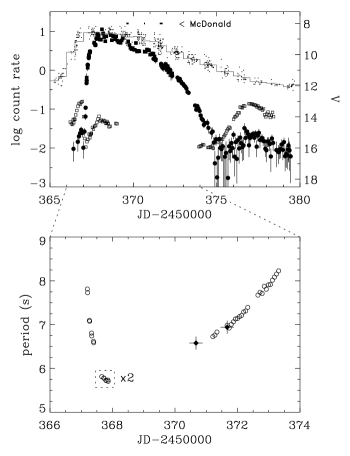
Mauche & Robinson mau01 and Wheatley, Mauche, & Mattei whe03 have described simultaneous optical (AAVSO visual magnitudes and McDonald Observatory 2.7 m telescope high-speed photometry), EUV (EUVE DS and SW: –120 Å), and X-ray (RXTE PCA: –15 keV) observations of a narrow asymmetric outburst of SS Cyg in 1996 October. The resulting optical, EUV, and X-ray light curves are shown in the upper panel of Figure 1. They can be understood in the context of the thermal-viscous instability model of dwarf nova outbursts las01 ; sch03 . When the disk surface density reaches some critical value first in the outer disk, the disk plasma is heated locally and a heating wave is launched though the disk, heating the disk plasma and increasing its viscosity. As this material sinks toward the white dwarf, it converts its gravitational potential energy into rotational kinetic energy and radiation. This radiation comes out first in the optical and then in the UV as hotter parts of the disk are activated (in steady state, ). When this material reaches the boundary layer between the disk and the surface of the white dwarf, it converts its prodigious rotational kinetic energy into radiation. This radiation comes out first in X-rays because the boundary layer is initially optically thin and hence quite hot (of order the virial temperature keV), and then in the EUV when the boundary layer becomes optically thick to its own radiation and becomes relatively cool (of order the blackbody temperature eV). The delay between the rise of the optical and EUV/X-ray emission is a direct measure of the time it takes for the heating wave to sweep through the disk. The delays of approximately , , and days between the rise of the optical and the EUV flux of outbursts of SS Cyg, U Gem, and VW Hyi, respectively, are consistent with a heating wave velocity mau01c .
As shown in the lower panel of Figure 1, oscillations were detected in the EUVE DS count rate light curves during an interval of approximately one week during this outburst. The oscillation was first convincingly detected on the rising branch of the outburst at a period of 7.81 s, it fell to 6.59 s over an interval of 4.92 hr (), jumped to 2.91 s, and then fell to 2.85 s over an interval of 4.92 hr () before observations with the DS were terminated. When DS observations resumed 3.4 days later during the declining branch of the outburst, the period of the oscillation was observed to rise from 6.73 s to 8.23 s over an interval of 2.10 days (). When the EUV oscillation period was approximately 2.9 s and its amplitude was 25–30%, a conservative upper limit for the X-ray oscillation amplitude was 7% whe03 .
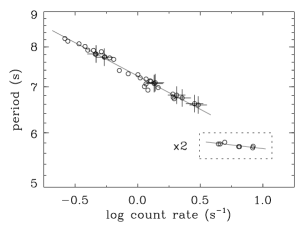
It is clear from Figure 1 that the period of the EUV oscillation of SS Cyg anticorrelates with the DS count rate, being long when the count rate is low and short when the count rate is high. To quantify this trend, Figure 2 shows the log of the period of the oscillation as a function of the log of the DS count rate. As in the previous figure, the data fall into two groups: one during the early rise (distinguished with crosses) and decline of the outburst, the other during the interval after the frequency of the oscillation had doubled. The trends during the early rise and decline of the outburst are the same and can be fit by a function of the form (where is the DS count rate) with s and , consistent with the trends observed during outbursts of SS Cyg in 1993 August and 1994 June/July mau96 .
Despite any direct evidence that the white dwarf in SS Cyg is magnetic, it is useful to consider the requirements of a magnetospheric model to explain the period-intensity (by inference, period-) relationship observed in SS Cyg. For a star with a dipole magnetic field (where is the dipole moment), the disk is truncated at a radius , hence the Keplerian frequency . With , this is far “softer” than the relationship observed in SS Cyg. For a multipole magnetic field (where is the multipole moment), , hence . Under these assumptions, SS Cyg requires a surface magnetic field strength –1 MG (which is sufficiently low to be hard-to-impossible to detect directly), and a high-order multipole field () mau96 .
As restrictive as this is, the situation is worse during the peak of the outburst: after the oscillation frequency doubled, the period-intensity relationship can be fit with s and : not only did the oscillation frequency double, it’s dependence on the DS count rate became “stiffer” by a factor of approximately 5. This evolution is consistent with SS Cyg pulsating at a fundamental period s, then switching to a first harmonic and stiffening its period-intensity (by inference, period-) relationship so as to avoid oscillating faster than s. This minimum period is consistent with the Keplerian period at the inner edge of the accretion disk if the mass of the white dwarf (and the Nauenberg nau72 white dwarf mass-radius relation applies). A secure value of the white dwarf mass is needed to confirm this interpretation.
As shown in the upper panel of Figure 1, the McDonald Observatory photometry was obtained on three consecutive nights during the early decline of the outburst. Oscillations in the optical flux were detected on the second and third nights with periods of 6.58 s and 6.94 s, respectively, consistent with the corresponding EUV oscillation periods. During these intervals, the amplitude of the EUV oscillation was 34%, while in the amplitudes were 0.11%, 0.07%, 0.05%, and 0.07%, respectively. On the third night, during two intervals of strictly simultaneous optical and EUV data, the periods and phases of the oscillations were determined to be the same within the errors. The phase difference implies s for s. The upper limit s corresponds to a distance cm. Assuming that the EUV oscillation originates near the white dwarf and that the optical oscillation is formed by reprocessing of EUV flux in the surface of the accretion disk, the delay , where the binary inclination and is the azimuthal angle from the line of sight. Then, the distance to the reprocessing site cm, which is about 30 white dwarf radii or one-third the size of the disk.
3 Chandra LETG Observations
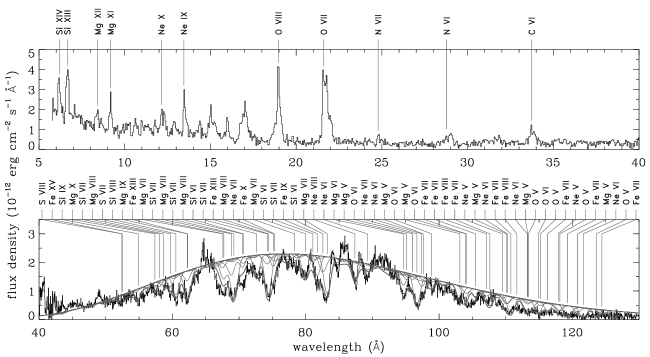
Mauche mau02c ; mau02 presented photometric and spectroscopic results from a Chandra Low Energy Transmission Grating (LETG) observation of SS Cyg obtained on 2001 January 16 during the plateau phase of a wide asymmetric outburst. The resulting spectrum, shown in Figure 3, contains emission lines of H- and He-like C, N, O, Ne, Mg, and Si and Fe L-shell ions in the X-ray band, and a quasi-continuum extending from 40 Å to 130 Å in the EUV band. The EUV spectrum can be modeled as an absorbed blackbody with flux scattered out of the line of sight by scores of ground-state transitions of a broad range of ions in the system’s outflowing wind. The model fit shown in the figure has the following parameters: blackbody temperature eV, neutral hydrogen column density , fractional emitting area (hence luminosity ), and wind velocity and mass-loss rate . The strongest lines in the model are labeled in the figure and include O V–VI, Ne V–VIII, Mg V–X, Si VI–IX, S VII–VIII, and intermediate change states of L-shell Fe.

Power spectra were calculated from background-subtracted count rate light curves constructed from the first-order LETG event data. The X-ray and EUV components of the spectrum were isolated by applying –42 Å and –120 Å wavelength filters, respectively. Consistent with the 1996 October EUVE and RXTE results, the optically thick EUV component of the LETG spectrum oscillates, while the optically thin X-ray component does not. The power spectrum of the EUV light curve, shown in the upper panel of Figure 4, manifests excess power at frequencies Hz and Hz, indicating the presence of oscillations at periods s and s. To investigate these oscillations more closely, the soft X-ray light curve was divided into 47 consecutive 1 ks intervals. Although the power spectra of these light curves are rather noisy, the Hz oscillation typically appears as a single Hz peak with a frequency in the range –0.112 Hz. The mean of these 47 power spectra is shown in the middle panel of Figure 4. In addition to the peaks at Hz and Hz, there appears to be a shoulder on the higher frequency peak extending to Hz. This feature is revealed as a distinct peak in the power spectrum of the harder (–70 Å) half of the EUV component of the LETG spectrum. In EUVE DS data obtained during the 1994 June/July outburst of SS Cyg, oscillations were detected at Hz and Hz (and its first harmonic ), indicating the presence of oscillations at periods s and s mau97c . The ratio for the Chandra LETG and EUVE DS power spectra is 0.088 and 0.096, respectively.

SS Cyg is not the only compact binary in which multiple periodicities have been detected. Woudt & Warner wou02 discuss a number of instances when multiple periodicities were detected in the optical flux of VW Hyi in outburst. During the decline of the 2000 February outburst, DNOs with periods –37 s and QPOs with periods –580 s were detected simultaneously. The ratio –0.071 is similar to the period ratios observed in SS Cyg. In addition, Psaltis, Belloni, & van der Klis psa99 showed that in five Z sources a tight correlation exists between the “horizontal branch oscillation” (HBO) frequency and the frequency of the lower frequency member of the pair of “kilohertz” (kHz) QPOs, with . Furthermore, by identifying with and the frequencies of various types of peaked noise components in atoll sources, other neutron star binaries, and black hole binaries, they (and subsequently Belloni, Psaltis, & van der Klis bel02 ) extended this correlation over nearly three orders of magnitude in frequency. Figure 5 shows this correlation and shows that the EUV data of SS Cyg and the optical data of VW Hyi extend this correlation nearly two orders of magnitude lower in frequency. This connection between the oscillations of CVs and LMXBs has since been strengthened by Warner, Woudt, & Pretorius war03 , who used published, archival, and new data to add a number of other CVs to the correlation, extending it another order of magnitude lower in frequency (to the magnetic disk-accreting dwarf nova GK Per, for which is the QPO frequency and is the white dwarf spin frequency).
This connection between the oscillations of CVs and LMXBs identifies the DNOs of CVs with the kHz QPOs of LMXBs, and the QPOs of CVs with the HBOs (or the broad noise component identified as such) of LMXBs. Note that the frequencies of the DNOs of CVs and the kHz QPOs of neutron star binaries are similar in that they are comparable to the Keplerian frequency at the inner edge of the accretion disk of, respectively, a white dwarf and neutron star: Hz for a white dwarf with cm, while Hz for a neutron star with km, as required by general relativity. In addition to their frequencies, the DNOs of CVs and the kHz QPOs of neutron star binaries are similar in that they have relatively high coherence and high amplitudes, their frequency scales with the inferred mass-accretion rate, and they sometimes occur in pairs. Assuming that the same mechanisms produce the oscillations in white dwarf, neutron star, and black hole binaries, the data exclude the relativistic precession model and the magnetospheric and sonic-point beat-frequency models (as well as any model requiring the presence or absence of a stellar surface or magnetic field) mau02 .
4 HST STIS Observations
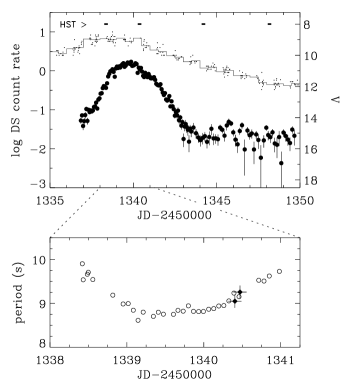
The final campaign to be discussed is one in which EUVE and HST Space Telescope Imaging Spectrograph (STIS) observations were obtained during an outburst of SS Cyg in 1999 June. The resulting optical and EUV lights curves are shown in the upper panel of Figure 6. Unfortunately, the outburst proved to be both short, so only two of the HST visits coincided with the peak of the outburst, and weak, so the peak DS count rate was relatively low. EUV oscillations were detected in the DS count rate light curves during an interval of approximately days near the peak of the outburst. The lower panel of Figure 6 shows the evolution of the period of the EUV oscillation, which gradually fell from s to s, and then rose back to s. Four orbits of HST observations were obtained during each of four visits on 1999 June 8, 10, 14, and 18. During each visit, STIS was used in TIME-TAG mode with (1) the NUV-MAMA with the G230L grating (–2800 Å, one orbit), (2) the FUV-MAMA with the G140L grating (–1600 Å, one orbit), and (3) the FUV-MAMA with the E140H echelle grating centered at Å (–1690 Å, two orbits). Unfortunately, it was necessary for reasons of detector safety to use the F25NDQ aperture/neutral density filter with the first two configurations. UV oscillations were detected during two consecutive orbits on the early decline from outburst in light curves produced from the echelle grating event data ( photons per orbit!) with periods of 9.06 s and 9.28 s, consistent with the corresponding EUV oscillation periods.
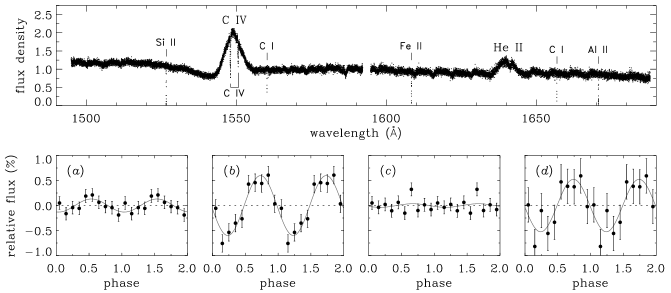
More interesting is the spectrum of the UV oscillations. The upper panel of Figure 7 shows the spectrum derived from the echelle grating observation obtained on 1996 June 10.86 UT. It consists of a bright continuum on which are superposed the C IV P Cygni profile, the He II emission line, and various interstellar absorption lines (the discontinuities in the spectrum every Å are due to small errors in the assumed effective areas of the 32 echelle orders). Power spectra were calculated for light curves of each echelle order, and excess power was detected in the neighborhood of the C IV and He II lines, but not in the continuum. To determine the wavelength dependence of the oscillation while maximizing the signal, power spectra were calculated for light curves produced from events from echelle orders 1–6 (–1528 Å), 8–11 (–1557 Å: C IV), 13–23 (–1629 Å), and 25–26 (–1648 Å: He II). The lower panels of Figure 7 show the relative light curves for each of these channels folded on the 9.28 s oscillation period. By fitting a sinusoidal function to the folded light curves, the relative oscillation amplitudes were found to be , , , and , respectively: the oscillation was convincingly detected in the C IV and He II channels, only weakly (at ) detected in the –1528 Å continuum channel, and not detected in the –1629 Å continuum channel. This result is in contrast to the eclipsing dwarf nova OY Car in superoutburst, which showed oscillations in the UV continuum, but not in the C IV emission line mar98 . The result for SS Cyg does not exclude the possibility that the oscillation amplitude of the UV continuum was as high as is observed in the optical (0.05%–0.1%, §2). The possibility remains that the optical oscillation, like the UV oscillation, is dominated by the lines. In support of this, note that in the dwarf nova V2051 Oph in outburst, the mean oscillation amplitude of the Balmer emission lines is approximately twice that of the optical continuum ste01 .
How are we to understand these results? Numerous lines of evidence identify the white dwarf/boundary layer as the primary source of the oscillations observed in nonmagnetic, disk-accreting, high- CVs. The pulsations of intermediate polars and the phase shifts of eclipsing intermediate polars war72 , novalike variables nat74 ; kni98 , and dwarf novae in outburst pat81 are interpreted in terms of a model in which rotating beams of EUV/X-ray photons are reprocessed in the surface of the accretion disk pat79 ; pet80 . Warner & Woudt war02 argue that DNOs are caused by an equatorial belt on the surface of the white dwarf that is first spun up and then spun down during dwarf nova outbursts, and that QPOs are caused by vertical thickenings of the inner disk, which alternately obscure and reflect radiation from the central source.
The He II Balmer line arises from the surface of the accretion disk and is a probe of EUV flux, as it arises from the cascade following photoionization of He II by EUV ( Å) photons. The C IV feature, on the other hand, is formed by scattering of , 1550 Å photons in SS Cyg’s outflowing wind. It is something of a surprise that this line pulsates at all, given the large volume in which it is formed. Even more surprising is the apparent lack of a phase shift across the C IV profile: the blue and red sides of the profile rise and fall in phase. To investigate the implications of this result, we constructed a simple model in which photons from a central source were scattered into the line of sight by a spherically symmetric constant-velocity wind, taking into account the light travel delays for the scattered photons. Different pulse-phase resolved profiles were obtained for a source with a rotating one-armed beam, a rotating two-armed beam, and an isotropic source whose flux is sinusoidally modulated. The synthetic profiles showed the greatest phase shift between the blue and red sides of the profile for the rotating one-armed beam source and the least phase shift for the modulated isotropic source, but a more detailed investigation is required to determine if the rotating two-armed beam source can be excluded by the data.
5 Conclusion
As I hope this contribution has demonstrated, the future of the study of the rapid periodic oscillations of CVs is bright. Additional observations of additional systems can help establish the proposed equivalence of CV and LMXB QPOs, and will provide unique and quantitative tests of QPO models. Data can be obtained from the ground in the optical and from space in the UV and EUV, the system parameters (binary inclination, white dwarf mass, radius, and rotation velocity) can be measured, eclipse mapping in edge-on systems allows the sites of flux modulations to be located and dissected, dwarf nova outbursts provide a dramatic and systematic variation in the mass-accretion rate, and diagnostic emission lines are available for study in the optical, UV, and EUV. The growth area in this field of research in the near future will likely be high-speed spectroscopic observations of CVs with large optical telescopes, such as Keck and the VLT.
References
- (1) Belloni, T., Psaltis, D., & van der Klis, M. 2002, ApJ, 572, 392.
- (2) Córdova, F. A., Chester, T. J., Mason, K. O., Kahn, S. M., & Garmire, G. P. 1984, ApJ, 278, 739.
- (3) Córdova, F. A., Chester, T. J., Tuohy, I. R., & Garmire, G. P. 1980, ApJ, 235, 163.
- (4) Hildebrand, R. H., Spillar, E. J., & Stiening, R. F. 1981, ApJ, 243, 223.
- (5) Horne, K., & Gomer, R. 1980, ApJ, 237, 845.
- (6) Jones, M. H., & Watson, M. G. 1992, MNRAS, 257, 633.
- (7) Knigge, C., Drake, N., Long, K. S., Wade, R. A., Horne, K., & Baptista, R. 1998, ApJ, 499, 429.
- (8) Lasota, J.-P. 2001, New Astronomy Reviews, 45, 449.
- (9) Marsh, T. R., & Horne, K. 1998, MNRAS, 299, 921.
- (10) Mauche, C. W. 1996, ApJ, 463, L87.
- (11) Mauche, C. W. 1997, ApJ, 476, L85.
- (12) Mauche, C. W. 1997, in Accretion Phenomena and Related Outflows, ed. D. T. Wickramasinghe, L. Ferrario, & G. V. Bicknell (San Francisco: ASP), 251.
- (13) Mauche, C. W. 2002, BAPS, 47, #N17.118.
- (14) Mauche, C. W. 2002, ApJ, 580, 423.
- (15) Mauche, C. W., Mattei, J. A., & Bateson, F. M. 2001, in Evolution of Binary and Multiple Star Systems, ed. Ph. Podsiadlowski, S. Rappaport, A. R. King, F. D’Antona, & L. Burderi (San Francisco: ASP), 367.
- (16) Mauche, C. W., & Robinson, E. L. 2001, ApJ, 562, 508.
- (17) Nather, R. E., & Robinson, E. L. 1974, ApJ, 190, 637.
- (18) Nauenberg, M. 1972, MNRAS, 254, 493.
- (19) Patterson, J. 1979, ApJ, 234, 978.
- (20) Patterson, J. 1981, ApJS, 45, 517.
- (21) Patterson, J. 1994, PASP, 106, 209.
- (22) Patterson, J., Robinson, E. L., & Kiplinger, A. L. 1978, ApJ, 226, L137.
- (23) Petterson, J. A. 1980, ApJ, 241, 247.
- (24) Psaltis, D., Belloni, T., & van der Klis, M. 1999, ApJ, 520, 262.
- (25) Robinson, E. L. 1976, ARA&A, 14, 119.
- (26) Schreiber, M. R., Hameury, J.-M., & Lasota, J.-P. 2003, A&A, 410, 239.
- (27) Steeghs, D., O’Brien, K., Horne, K., Gomer, R., & Oke, J. B. 2001, MNRAS, 323, 484.
- (28) van Teeseling, A. 1997, A&A, 324, L73.
- (29) Warner, B. 1995, Cataclysmic Variable Stars (Cambridge: CUP).
- (30) Warner, B. 2004, PASP, in press (astro-ph/0312182).
- (31) Warner, B., Peters, W. L., Hubbard, W. B., & Nather, R. E. 1972, MNRAS, 159, 321.
- (32) Warner, B., & Woudt, P. A. 2002, MNRAS, 335, 84.
- (33) Warner, B., Woudt, P. A., & Pretorius, M. L. 2003, MNRAS, 344, 1193.
- (34) Wheatley, P. J., Mauche, C. W., & Mattei, J. A. 2003, MNRAS, 345, 49.
- (35) Woudt, P. A., & Warner, B. 2002, MNRAS, 333, 411.