Globular Clusters as Probes of Galaxy Evolution: NGC 5128
Abstract
We present the results of our analysis of the photometric data of globular clusters in the elliptical galaxy NGC 5128 (Cen A). We show that the integrated colour can be an effective metallicity indicator for stellar populations. This is because it is sensitive to metallicity via the opacity effect but relatively insensitive to the effective main sequence turn-off temperature of the population (and thus to age) when – 12000 K, that is, when the Balmer Jump is strong. This flat vs relation is a result of the fact that the blueing effect of the optical continuum with increasing temperature is temporarily stopped by the Balmer Jump which becomes greater with temperature in this range. In this study we use and as metallicity and age indicators, respectively. We first show that the use of the vs two-colour diagram roughly yields the metallicities and ages of the Milky Way globular clusters independently determined, and then apply the technique to the clusters in NGC 5128. There is a large range in , which corresponds to [Fe/H] of 2.0 through over 0.3. The large uncertainties from the data and the models currently prevent us from pinning down their ages and metallicities. Although a constant age for all these clusters cannot be ruled out, there is a hint of the metal-rich clusters being younger. Significance of these results and caveats of the analysis are discussed.
keywords:
galaxies: elliptical and lenticular, cD – galaxies: evolution – galaxies: stellar content – galaxies: star clusters – galaxies: individual: NGC 5128 (Cen A).1 Introduction
When and how big elliptical galaxies developed their present shape in terms of mass and light are among the most debated questions in astrophysics. The classical view assumes that most elliptical galaxies formed at high redshifts in a monolithic way via a very efficient starburst (Larson 1974), while the more recent, hierarchical galaxy formation theory suggests that they are more recent products of mergers of older disk galaxies (Toomre 1977; Kauffman 1996). Both scenarios can account for many important observational phenomena, but their implications for the formation and morphological evolution of galaxies are significantly different. Consequently, numerous theoretical and observational investigations aim to find a more realistic scenario.
Galaxy integrated colours are among the most popular tools to study this issue. Changes in rest-frame optical colours are often interpreted as evidence of “passive” evolution of early-type galaxies since high redshifts (Bower, Lucy, & Ellis 1992). However, the actual optical colour evolution of old populations is so small that the measured colour evolution can be similarly well reproduced by different theoretical pictures (Kauffman 1996). Yi (2003a) points out that the change of optical colours as a function of time becomes hardly noticeable after the age 6 – 7 Gyr. This means that if the mean age of the stars in an early-type galaxy is greater than 6 – 7 Gyr, it is extremely difficult to derive the stellar ages based on integrated colours and thus to pin down the correct galaxy evolution scenario. Besides, both of the two competing views suggest mean stellar ages as large as 7 Gyr anyway if the galaxies are in large dark matter halos, although the ranges of stellar ages are significantly different from one another. In this regard, it seems hopeless to use the integrated light of galaxies to derive their star formation and galaxy evolution history. Spatially resolved stars seem to be required for the task!
Though not quite spatially resolved, globular clusters (GCs) provide excellent alternatives. They are just bright enough for easy detection. The stars in individual clusters are more or less of the same age and chemical composition, like our own Milky Way globular clusters (MWGCs), and thus easy to model. Accurate measurements of their ages and metallicities will give us important hints to the formation and evolution of the host galaxy. A significant hindrance of GC studies is, however, that their integrated colours are often degenerate in terms of age and metallicity, and thus even having multiple colour information is not sufficient to accurately determine their ages. The so-called age-metallicity degeneracy (hereafter AMD) was first systematically pointed out by Worthey (1994).
Lately, Yi (2003b) claimed that the use of short-wavelength broad-band colours (such as ) may break the AMD because they are quite insensitive to age. We present the further details of why behaves that way. We apply the technique to Peng, Ford, & Freeman’s (2003, submitted) -band integrated photometry of the GCs in NGC 5128, the giant elliptical galaxy in the Centaurus group.
From this analysis we found evidence that may indicate (1) a large range of age (), (2) a large range of metallicity (), and (3) a possible age-metallicity relation (AMR). This technique is easy to apply to extragalactic GC systems and may provide important clues to galaxy evolution. We discuss significance, caveats and the future prospects.
2 Broad-band Colours of Globular Clusters
Broad-band colours of GCs have been announced useful for extragalactic evolution studies many times before (to cite only a few, Crampin & Hoyle 1961; van den Bergh 1969; Harris & Racine 1979; Elson & Walterbos 1988; Girardi & Bica 1993; Zepf, Ashman, & Geisler 1995; Cohen, Blakeslee, & Ryzhov 1998). Globular clusters are generally regarded as “simple” stellar populations, that is, made up of stars of the same age and chemical composition because stars in each cluster probably formed out of the same gas cloud nearly simultaneously. This makes them easy targets of population synthesis models and consequently effective tracers of galaxy evolution.

As mentioned in §1, a serious hindrance is that broad-band colours are known to suffer from the AMD. Fig. 1 shows a clear example of the AMD in colours, the most popular colours for distant stellar population studies. The MWGC data are compared to the population synthesis models of Yi (2003a; Yi & Yoon in preparation). Table 1 lists the models for select metallicities and ages. Their models are for simple stellar populations and are based on Salpeter initial mass function and the Yale stellar models. Four models (lines) in Fig. 1 are for four metallicities; the bluest models with open circles on top being the most metal-poor of all. Each model (line) is a sequence of age 1–15 Gyr with 1 (smallest), 5, 9, 13 Gyr (biggest) models marked with open symbols. The MWGC colours are based on the same symbol code except for the most metal-poor bin; the filled circles denote the most metal-poor MWGCs with the mean metallicity of roughly [Fe/H]=2, while the most metal-poor models are for [Fe/H]=. Fig.1-(a) shows the entire MWGC data, while (b) shows only low reddening () data, from Harris (1996). For reddening correction in Fig.2, we use from Schlegel, Finkbeiner, & Davis (1998, Landolt calibration in Table 5).
Note firstly in Fig.1-(b) how tight the AMD appears in the colours. Secondly, the MWGC colours are reasonably reproduced by the models of their spectroscopically measured metallicities and of their isochrone-derived ages. But the four models are virtually on the same extended line; and thus neither of these colours provides age or metallicity information unless one of them (age or metallicity) is known a priori.
Yi (2003a) recently claimed that the use of far-UV-to-optical colours (e.g., ) may avoid the AMD and separate old ( Gyr) populations from young ones. This is because the age effect in far-UV-to-optical colours is virtually orthogonal to the metallicity effect a population is old enough to develop a blue horizontal-branch. Unfortunately, far-UV data are only available through space telescopes and thus difficult to obtain.
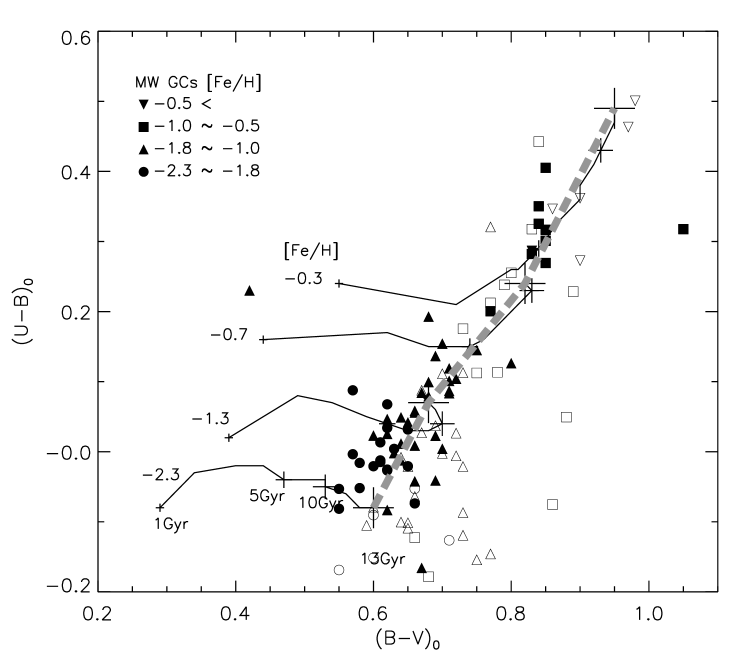
The colour is easier to obtain and may still be capable of breaking the AMD at least partially. Yi (2003b) showed that is sensitive to metallicity but not to age if metallicity is low. We compared the colours of the MWGCs to Yi’s population synthesis models to test this. The result is shown in Fig. 2. Indeed, the four metallicity models (lines) are separated from one another very clearly. All models span 1 through 13 Gyr, with 1 (smallest), 5, 10, 13 Gyr (largest) models are marked with cross symbols. Our models reproduce the MWGC data reasonably well in both colours. A small discrepancy of order 0.03–0.04 mag (in particular in ) may appear noticeable to some readers. Such offsets are currently unavoidable given the uncertainties in the -colour transformation (Lejeune et al. 1997). The thick vertical dashed line is the 13 Gyr sequence derived from the four metallicity models. It appears to be a good representation of the MWGC data, although the scatter is large.
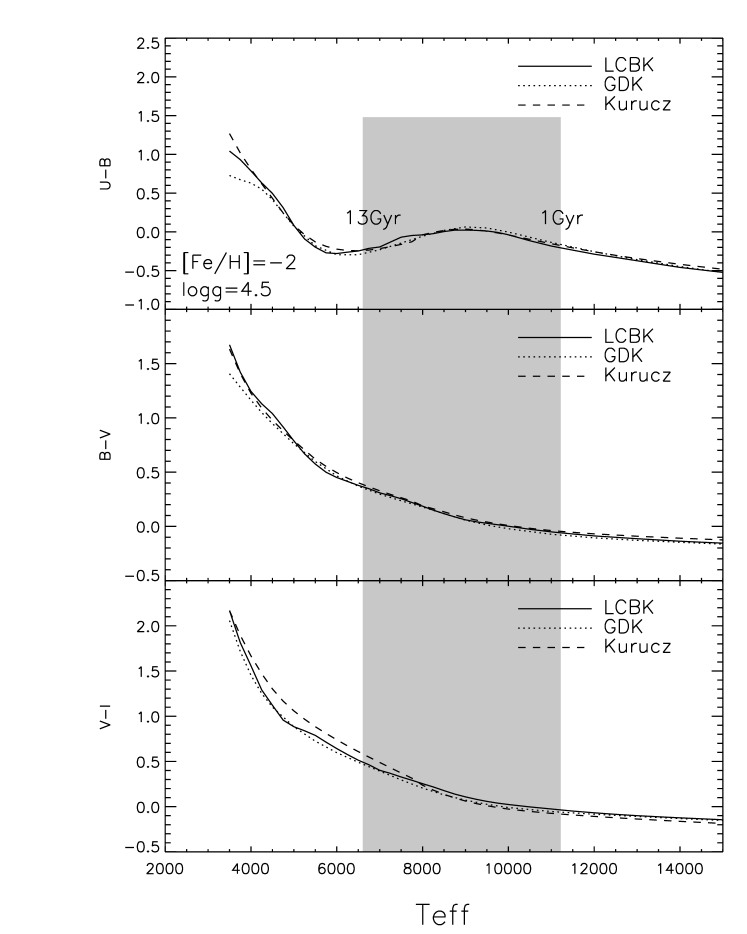
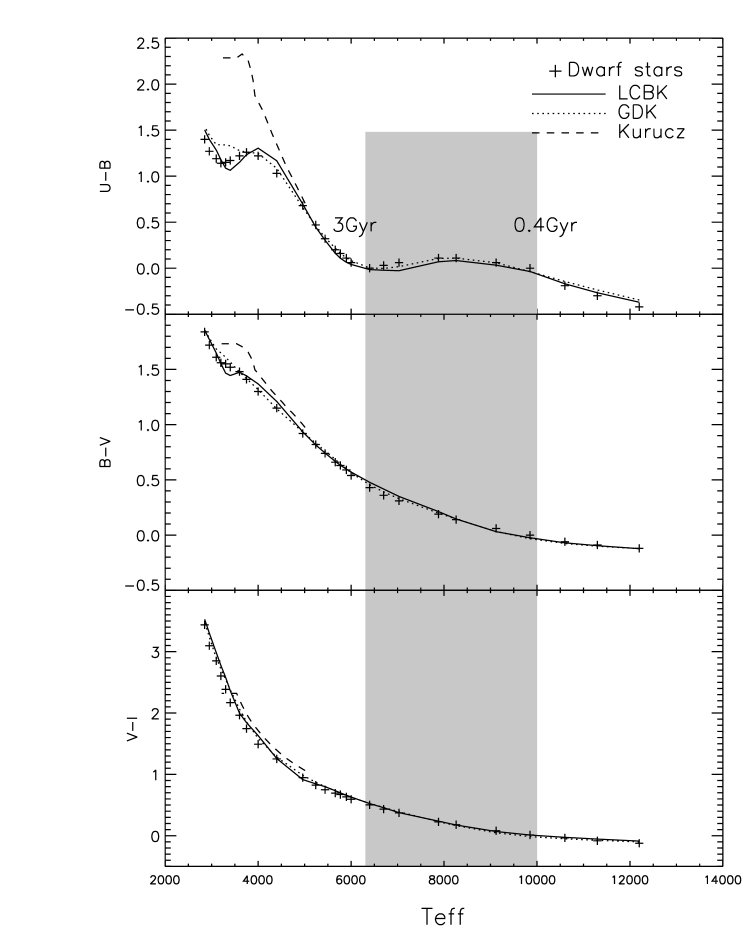
Then we wonder what causes to be so insensitive to age. For instance, at low metallicities, is nearly flat (within 0.1 mag variation) for a good part of the age range (1–15 Gyr when [Fe/H]=2.3, 1–9 Gyr when ). This is answered in the next two figures. Figs. 3 and 4 show optical colours as a function of temperature. The shaded box denotes the main-sequence turn-off (MSTO) temperature for the age range in question (1–13 Gyr). Unlike or , does not exhibit a monotonic change with respect to temperature. The shape in the vs relation in Fig. 3 is also visible along the models in Fig. 2. The colour is sensitive to metallicity via the opacity effect. But it shows a semi-flat curve with effective temperature (and thus with age) when – 12000 K (ages 1–10 Gyr) if [Fe/H]=2 as shown in Fig. 3 and when – 10000 K (ages 0.4–3 Gyr) if [Fe/H]=+0.0 as shown in Fig. 4. This relatively flat vs relation is a result of the fact that the blueing effect of the optical continuum with increasing temperature is temporarily held back by the Balmer Jump which becomes stronger with temperature in this range (Binney & Merrifield 1998). This is why acts as a good metallicity indicator and does so in different age ranges at different metallicities.
Similar techniques have been used by Rejkuba (2001) and Jordán et al. (2002), who used and the HST/WFPC2 F336WF547M, respectively, as a metallicity indicator. Such colours are substantially better than or as a metallicity indicator; but they still change gradually with respect to age and thus are not as effective as .
In summary, we have shown that the popular and colours suffer from severe cases of the AMD and fail to serve as age or metallicity indicators. The colour, on the contrary, is predicted to be a good metallicity indicator. We demonstrate this using the MWGC data. As the derived ages of the MWGCs tell us about how Galactic halo and thick disk have evolved, we hope to apply to extragalactic GCs and find their metallicities and ages in order to understand the evolution of their host galaxies.
| [Fe/H] | Age(Gyr) | ||||
|---|---|---|---|---|---|
| 2.3 | 1 | -0.08 | 0.29 | 0.23 | 0.50 |
| 2.3 | 2 | -0.03 | 0.34 | 0.25 | 0.55 |
| 2.3 | 3 | -0.02 | 0.40 | 0.29 | 0.62 |
| 2.3 | 4 | -0.02 | 0.44 | 0.31 | 0.66 |
| 2.3 | 5 | -0.04 | 0.47 | 0.32 | 0.69 |
| 2.3 | 6 | -0.04 | 0.51 | 0.34 | 0.73 |
| 2.3 | 7 | -0.04 | 0.51 | 0.34 | 0.72 |
| 2.3 | 8 | -0.04 | 0.52 | 0.35 | 0.74 |
| 2.3 | 9 | -0.04 | 0.53 | 0.36 | 0.76 |
| 2.3 | 10 | -0.05 | 0.53 | 0.36 | 0.77 |
| 2.3 | 11 | -0.06 | 0.56 | 0.38 | 0.79 |
| 2.3 | 12 | -0.08 | 0.58 | 0.39 | 0.81 |
| 2.3 | 13 | -0.08 | 0.60 | 0.40 | 0.84 |
| 2.3 | 14 | -0.09 | 0.60 | 0.40 | 0.83 |
| 2.3 | 15 | -0.09 | 0.62 | 0.41 | 0.85 |
aTable 1 is available in its entirety in the electronic edition of
the Monthly Notices of the Royal Astronomical Society.
3 Globular Clusters of NGC 5128
NGC 5128 (Cen A) is the closest giant elliptical galaxy at distance 3.5–4 Mpc. Owing to its proximity, its GCs have been found early by Graham & Phillips (1980) and subsequently studied by many groups (to cite only a few, Frogel 1984; Jablonka et al. 1996; Minniti et al. 1996; Rejkuba 2001). Peng et al. (2003) have lately acquired the data on its 210 GCs. These observations were taken with the CTIO 4-meter telescope with its Mosaic imaging camera in June, 2000. The photometry was calibrated using standard stars from Landolt (1992). Descriptions of these observations are given in Peng et al. (2002, 2003) The catalog we use is of the 210 spectroscopically confirmed GCs. While it is always important that GCs have radial velocities consistent with that of the host galaxy, the high foreground contamination in the direction of NGC 5128 makes radial velocity selection critically important for defining a sample of GCs. All GCs in this catalog have km s-1, and it is on this data set that we apply the two-colour diagram technique.
Fig. 5 shows the NGC 5128 GC data compared to our population models for six metallicities. Data are divided into two groups depending on the -band measurement errors. The small-error sample (-band error smaller than 0.2 mag) appear as filled circles while the large-error data appear as open circles. The mean error in the whole sample is 0.2 mag, while that of the low-error data alone is 0.1 mag. The mean errors in colours for the small-error sample are shown as cross in the top left. The arrow in the lower right corner illustrates the Galactic extinction, mag, estimated using the Schlegel et al. (1998) formula. The internal reddening in NGC 5128 does not seem to add much to this (Frogel 1984; Jablonka et al. 1996; Rejkuba et al. 2002) unless objects are near its dust lane. The GCs observed by Peng et al. are mostly outside 1 effective radius (approximately 5 arcmin) and away from the dust lane. Also shown are the low-reddening MWGCs from Fig. 1-(b).
Several features are apparent. Most notable is a large range in in the NGC 5128 GC sample compared to the MWGCs. This indicates a wide range of metallicity in the NGC 5128 sample. It is also interesting to notice that the fraction of extremely metal-poor () GCs seems much smaller in NGC 5128 than in the MW, which confirms the earlier result of Zepf & Ashman (1993) based on the Washington photometry colour. Fig. 6 shows this more clearly.
The rough estimates of metallicity are listed in Table 2. Column 1 lists seven bins. Column 2 lists the ()-based mean metallicity estimates of the clusters. Crude age and metallicity estimates were obtained from visual inspection of Figure 6 and 7. The seven data points with error bars in Fig. 6 are the mean values with standard deviations for the bins. The uncertainty is large due to the large measurement error in (0.2 mag) in the first place; and it is worse at higher metallicities because at high metallicities even the vs diagram suffers from the AMD and the population synthesis models are poorly tested and calibrated. Column 3 shows the ages again roughly derived from the mean values of in the bins using Fig. 7. The errors are translated simply from the standard deviation in assuming that we have no prior information on metallicity. For the upper error estimation, we assume the maximum age of 14 Gyr. For a given value of (though with large errors), the scatter in is small, even compared to the Milky Way GC data. If we can reduce the measurement errors, we would be able to pin down their ages. Figure 7 also shows the MWGC data (with dashed error bars) determined by the same scheme (but only for the first five bins). A total of 60 MWGCs are used for this measurement, and 18, 22, 9, 4, and 5 are in each of the five bins from blue to red. We excluded NGC 7492 data point in computing the mean points because it has an abnormally blue colour of 0.42 according to the Harris table, which is not easy to reconcile with other cluster colours if they belong to the same age group. Because of the small number statistics, only the first two points are significant. Besides, redder GCs on the average suffer from a higher extinction and thus less reliable. Keeping these in mind, the five data points are still consistent with a single-age hypothesis in the range 12–14 Gyr.

The scatter of the data in this diagram is strikingly small compared to those in the MWGC data. The widths in the and scatters are only of similar scale to the measurement errors; and, thus, much of the scatters probably come from the observational errors. This implies that the of the NGC 5128 GC data in this diagram is intrinsically narrow. Such a sequence, if it can be further narrowed down by achieving higher quality data, might lead to an age-metallicity relation (AMR). For example, the most metal-poor GCs seem similar in colours to their MW counterparts, suggesting they are comparable in age; but metal-rich GCs are more consistent with younger models. Fig. 7 shows this more clearly. Indeed, redder GCs appear younger. The bluest, and most metal-poor, GCs () seem as old as Gyr. As metallicity (based on ) increases the mean GC age seems to decrease gradually. At = 0.3 the estimated age on the sequence is approximately Gyr. If this is real, the data is indicating an AMR. Such an AMR, if true, would provide an important clue to the star formation history of the galaxy. The anti-correlation between age and metallicity makes sense from the views of galactic chemical evolution theory. It should be noted again, however, that the hypothecal AMR is not significant enough yet due to the uncertainties discussed above.

Our last focus is on whether the data show any sign of multiple metallicity (or age) peaks. Zepf & Ashman (1993) found two metallicity peaks in the sample of 61 GCs of NGC 5128 at 0.85 and 0.35 based on . We find similar clusterings at two metallicities near 1 and 0, as shown in Fig. 8. The separation between the two metallicity peaks seems larger in our study than that of Zepf & Ashman (1993). Rejkuba (2001) also found two peaks in her 71 GC sample based on , but at substantially lower metallicities of 1.7 and 0.6. In our analysis, we do not find many GCs below 1.3, indicating a notable offset between her results and ours. The two colours, and have similar effects in determining metallicities, but is in general less sensitive to age and thus being a better metallicity indicator. In Fig. 8 we denote the two peaks with rough estimates of metallicity based on . However, note that there are large uncertainties in the metallicity estimates (see Table 2), in particular at high metallicities because errors are larger for redder GCs: the mean -band errors for and GCs are 0.16 and 0.31, respectively.
We do not provide detailed relations between and metallicity here because they depend on the ages which vary from one galaxy system to another. Instead we suggest readers to use the model grids listed in Table 1 for deriving the metallicities of simple stellar populations.

| [Fe/H]a | Age(Gyr)b | N (cluster) | |
|---|---|---|---|
| 2.0 | 11 | 10 | |
| 0.0–0.1 | 1.1 | 7 | 41 |
| 0.2–0.3 | 0.7 | 5 | 49 |
| 0.3–0.4 | 0.3 | 3 | 35 |
| 0.4–0.5 | 0.1 | 4 | 25 |
| 0.5–0.6 | +0.3 | 3 | 27 |
| +0.7 | 2 | 23 |
aMetallicity derived from .
bAge derived from (assuming the maximum age 14 Gyr).

4 Implications on the Evolution of NGC 5128
If we take mean values alone from Table 2 (although it is a clear oversimplification), our two-colour diagram analysis on the NGC 5128 GCs appears to suggest a large range in age (2–11 Gyr) and metallicity ( through +0.3), and possibly an AMR. Could this galaxy have been forming star clusters all through this age range? Multiple peaks in the colour distributions of extragalactic GCs have been interpreted as signs of multiple starbursts (e.g., Zepf & Ashman 1993). Gebhardt & Kissler-Patig (1999) in particular found that half of the galaxies with more than 100 GCs observed show bimodality and interpreted it as a sign of double (or more) starbursts.
At this moment, it is worth noting that this galaxy has other notable morphological features. It shows a prominent dust lane, optical filaments, and many diffuse shells (Schiminovich et al. 1994) that are often attributed to a recent (100 Myr ago) merger event. Of the 210 GCs in our sample only one at (, ) (0.25, 0.08), marked with asterisk in Figure 7 seems young enough to have come from such recent merger activities. On the other hand, it may be natural not to see many young GCs in our sample because our sample avoids the dust-lane region, which is the most likely place to find them.
The presence of intermediate-age (a few Gyr) clusters has been reported by Minniti et al. (1996). We also find quite a few of them, which are mostly of a high metallicity. Larsen et al. (2003) have found such intermediate-age GCs in NGC 4365 as well.
Gebhardt & Kissler-Patig (1999) noted that the colour bimodality is more often found in brighter elliptical galaxies. Multiple peaks, in particular in age, although not necessarily indicating multiple major mergers, are compatible with the hierarchical formation scenario. Kauffmann (1996) suggested that brighter cluster elliptical galaxies form their stars at higher redshifts on the average. NGC 5128 is a near- () elliptical galaxy, and thus its wide-spread starburst signatures, if true, would be marginally compatible with hierarchical scenario. For a comparison, Cohen et al. (1998) and Jordán et al. (2002) suggest that the colour distributions of GCs of the giant elliptical galaxy M 87 indicate a large constant age of 13–14 Gyr. Similarly, Kuntschner et al. (2002) found the GCs in the lenticular galaxy NGC 3115 are old and coeval at 11–12 Gyr. It will be interesting to obtain data on their GC sample and apply our two-colour diagram technique.
Because NGC 5128 is the brightest and probably most massive galaxy in Centaurus group, it is also plausible that some clusters came from neighbouring galaxy systems (e.g., Côté, Marzke & West 1998). Such foreign GCs may add to the scatters in the observed sequence in the two-colour diagram. However, the present level of the scatters is very small and thus incompatible with a scenario where many of the GCs formed in independent starbursts that have distinctively different age-metallicity relations.
5 Summary and Discussion
We present the result of our analysis on the multi-band photometric data of GCs in the field elliptical galaxy NGC 5128. We used and colours as metallicity and age indicators, respectively. At low metallicities the colour is a good metallicity indicator because it is sensitive to metallicity but not to age. We have given a theoretical explanation for these phenomena. The vs two-colour diagram technique is able to differentiate old populations from young ones quite successfully. We first show that this technique works very well on the MWGCs; our models match the MWGC colours at their independently-derived metallicities and ages.
We applied the same technique to the NGC 5128 GC data and found the following. There is a large range in , which corresponds to [Fe/H]=2.0 through possibly over +0.3. For a given , the spread in is very small, making the age estimation possible. Despite the fact that the observational errors are large, the scatters in and are only of comparable sizes to the observational errors, implying an intrinsically narrow sequence in the age-metallicity parameter space.
If we take the mean values of the derived ages and metallicities (ignoring large errors), more metal-rich clusters appear younger. There also seems to be a (metallicity) bimodality with at least two peaks at 1 and 0. Zepf & Ashman (1993) and Rejkuba (2002) also found two peaks but at slightly different positions.
If this is true, the data seem to support the galaxy evolution scenario in which globular clusters started to form very early and subsequently at later redshifts. This seems consistent, albeit only qualitatively, with the prediction of semi-analytic models, where elliptical galaxies are results of numerous merger events. Harris & Harris (2001) have reached a similar conclusion on this galaxy based on their halo giant star data.
The uncertainties in the age and metallicity estimates are currently too large to decide whether there indeed is a clear AMR. It is very puzzling why there are so few metal-poor GCs but so many super-metal-rich GCs compared to the GC systems in other galaxies. Does this make sense when viewed from the chemical evolution theory? If we are somehow underestimating reddening by 0.1 mag, the metallicity distribution of the NGC 5128 GCs would become similar to those of other GC systems. Moreover, the observational errors are systematically larger for redder GCs, and thus the age and metallicity estimates of redder GCs are less certain. Besides, our conclusions hinge on the slope of the GC locus in space. This slope is sensitive to the -band photometric colour term which needs to be measured carefully. Another source of uncertainty is that population synthesis models have been rigorously tested only for metal-poor populations (mainly MWGCs) but not for metal-rich ones. Thus, the AMR the data seem to indicate may not be pristine. If we accordingly admit large uncertainties in our analysis, a single age (anywhere between 5 and 13 Gyr) hypothesis should not to be ruled out yet (see Fig. 7).
Despite the fact that we cannot conclude with confidence at this moment, it is encouraging that the data shows a narrow sequence in age and metallicity. A factor of two better-quality (signal-to-noise) data would lead to a much stronger conclusion. Achieving reliable population models may require substantially more work. Meanwhile, a simple but useful test can be made by acquiring spectra of some of the bright red clusters, e.g., those in the = 0.5 – 0.6 bin in Table 2. We should measure their spectroscopic metallicities and ages (e.g., using Balmer line indices) to validate/calibrate the population models. For example, if such analyses indicate that these GCs are substantially younger than typical old GCs, then it would confirm the AMR that we found. On the other hand, if their spectra suggest old ages that are comparable to the ages of the metal-poor GCs, a small-range of formation epoch for the GCs would be more likely222After this work was completed, we learned that Peng et al. (2003) have measured spectroscopic line indices for the brightest of these clusters and found that the metal-rich GCs are indeed young on average with the mean age of 4 Gyr.. Obviously, different galaxy evolution scenarios will be favoured depending on the result.
Another important test is to see whether these GCs show strong UV fluxes. Yi (2003a) pointed out that the GCs that are old enough to develop a large number of blue horizontal branch stars must exhibit a measurable UV flux, as shown in some of the MWGCs. Far-UV observations using HST or GALEX will effectively differentiate old GCs from young ones.
One might point out that, although -band data are useful in the metallicity determination, it is substantially more difficult to obtain and calibrate, and so the errors are large. It is true. NGC 5128 is perhaps one of only a few galaxies to which we can apply this technique using 4-m telescopes. Getting deep, precise -band photometry for GCs in Virgo cluster galaxies, for example, would be much more difficult. Nevertheless, it is an effective tool for deriving metallicities unlike other dominantly popular colours such as and , which suffer from the age-metallicity degeneracy.
We believe that this technique, when tested and calibrated sufficiently, can be applied to extragalactic populations of various properties to systematically study the star formation history in galaxies. It is possible to detect globular clusters in -band even at the Virgo cluster distance if 8-m class telescopes are used. In addition, UV observations (using HST and GALEX) are highly recommended because they could serve as effective age indicators for old metal-rich populations where the current two-colour technique becomes ineffective.
Acknowledgments
We thank the anonymous referee for a number of constructive criticisms and suggestions. We thank Joseph Silk, Ignacio Ferreras, Roger Davies, Robert Zinn, Pierre Demarque, Richard Larson, for valuable comments. Stimulating discussions with Ray Sharples and Jean Brodie also shed great lights on this study. This research has been supported by PPARC Theoretical Cosmology Rolling Grant PPA/G/O/2001/00016 and the Lockey Bequest Funds (S. K. Yi), and Glasstone Fellowship (S. Yoon). E. W. Peng acknowledges support from the National Science Foundation through grant AST 00-98566.
References
- [1] Binney, J., & Merrifield, M. 1998, Galactic Astronomy (Princeton: Princeton Univ. Press), 55
- [2] Bower, R. G., Lucey, J. R., & Ellis, R. S. 1992, MSRAS, 254, 601
- [3] Cohen, J. G., Blakeslee, J. P., & Ryzhov, A. 1998, ApJ, 496, 808
- [4] Côté, P., Marzke, R. O., & West, M. J. 1998, ApJ, 501, 554
- [5] Crampin, J., & Hoyle, F. 1961, MNRAS, 122, 27
- [6] Elson, R., & Walterbos, R. 1988, ApJ, 333, 594
- [7] Frogel, J. A. 1984, ApJ, 278, 119
- [8] Gebhardt, K., & Kissler-Patig, M. 1999, AJ, 118, 1526
- [9] Girardi, L., & Bica, L. 1993, A&Ap, 274, 279
- [10] Graham, J. A., & Phillips, M. M. 1980, ApJ, 239, L97
- [11] Green, E. M., Demarque, P., & King, C. R. 1987, The Revised Yale Isochrones and Luminosity Functions (New Haven: Yale Univ. Obs.)
- [12] Harris, W. E. 1996, AJ, 112, 1487
- [13] Harris, W. E., & Harris, G. L. H. 2001, AJ, 122, 3065
- [14] Harris, W. E., & Racine, R. 1979, ARA&A, 17, 241
- [15] Jablonka, P., Bica, E., Pelat, D., & Alloin, D. 1996, A&Ap, 307, 385
- [16] Jordán, A., Côté, P., West, M. J., & Marzke, R. O. 2002, ApJ, 576, L113
- [17] Kauffmann, G. 1996, MNRAS, 281, 487
- [18] Kuntschner, H., Ziegler, B. L., Sharples, R. M., Worthey, G., & Fricke, K. J. 2002, A&Ap, 395, 761
- [19] Kurucz, R. 1992, in The Stellar Population in Galaxies, eds. B. Barbuy & A. Renzini (Dordrecht: Reidel), 225
- [20] Landolt, A. U. 1992, AJ, 104, 340
- [21] Larsen, S. S., Brodie, J. P., Beaseley, M. A., Forbes, D., Kissler-Patig, M., Kuntschner, K., and Puzia, T. H. 2003, 585, 767
- [22] Larson, R. B. 1974, MNRAS, 166, 585
- [23] Lejeune, Th., Cuisinier, F., & Buser, R. 1997, A&Ap, 125, 229
- [24] Minniti, D., Alonso, M. V., Goudfrouij, P., & Meylan, G. 1996, ApJ, 467, 221
- [25] Peng, E. W., Ford, H. C., Freeman, K. C., & White, R. L. 2002, AJ, 124, 3144
- [26] Peng, E., Ford, H., & Freeman, K. 2003, ApJS, accepted; astro-ph/0311264
- [27] Rejkuba, M. 2001, A&Ap, 369, 812
- [28] Rejkuba, M., Minniti, D., Courbin, F., & Silva, D. R. 2002, ApJ, 564, 688
- [29] Schlegel, D. J., Finkbeiner, D. P., & Davis, M. 1998, ApJ, 500, 525
- [30] Schiminovich, D., van Gorkom, J. H., van der Hulst, J. M., & Kasow, S. 1994, ApJ, 423, L101
- [31] Toomre, A. 1977, in The Evolution of Galaxies and Stellar Populations, eds. B. M. Tinsley and R. B. Larson (New Haven: Yale Univ. Obs.), 401
- [32] van den Bergh, S. 1969, ApJS, 19, 145
- [33] Worthey, G. 1994, ApJS, 95, 107
- [34] Yi, S. 2003a, ApJ, 582, 202
- [35] Yi, S. 2003b, in Extragalactic Globular Cluster Systems, ed. M. Kissler-Patig (Berlin: Springer-Verlag), 249
- [36] Zepf, S. E., & Ashman, K. M. 1993, MNRAS, 264, 611
- [37] Zepf, S. E., Ashman, K. M., & Geisler, D. 1995, ApJ, 443, 570