Gemini imaging of QSO host galaxies at
Abstract
We present results of a Gemini adaptive optics (AO) imaging program to investigate the host galaxies of typical QSOs at . Our aim is to study the host galaxies of typical, QSOs at the epoch of peak QSO and star formation activity. The large database of faint QSOs provided by the 2dF QSO Redshift Survey allows us to select a sample of QSOs at which have nearby ( arcsecond separation) bright stars suitable for use as AO guide stars. We have observed a sample of 9 QSOs. The images of these sources have AO corrected full-width at half-maximum of between 0.11 and 0.25 arcseconds. We use multiple observations of point spread function (PSF) calibration star pairs in order to quantify any uncertainty in the PSF. We then factored these uncertainties into our modelling of the QSO plus host galaxy. In only one case did we convincingly detect a host (2QZ J133311.4+001949, at ). This host galaxy has mag with a half-light radius, , equivalent to assuming a simple passively evolving model. From detailed simulations of our host galaxy modelling process, we find that for four of our targets we should be sensitive to host galaxies that are equivalent to (passively evolved). Our non-detections therefore place tight constraints on the properties of QSO host galaxies, which can be no brighter (after allowing for passive evolution) than the host galaxies of AGN at low redshift, although the QSOs themselves are a factor of brighter. This implies that either the fueling efficiency is much greater at high redshift, or that more massive black holes are active at high redshift.
Subject headings:
instrumentation: adaptive optics — galaxies: active — quasars: general — galaxies: high-redshift1. Introduction
In recent years it has become evident that active galactic nuclei (AGN) could play a crucial role in the formation of most galaxies. Although only a small fraction of galaxies at any one time contain an AGN, it is possible that all sufficiently massive galaxies passed through an active phase at some point in their history. Answering the question of what triggers this activity is a vital step in gaining a full understanding of galaxy formation.
Recent observations that most nearby luminous galaxies contain a massive black hole (or at least a ’massive dark object’) certainly support the hypothesis that these galaxies all passed through an AGN phase (e.g., Kormendy & Richstone, 1995). In particular Magorrian et al. (1998) suggest that all dynamically hot systems (either elliptical galaxies or spiral bulges) will contain a central massive dark object. The measured masses of these dark objects are found to be correlated to the luminosity (or mass, assuming a uniform mass-to-light ratio) of the spheroidal component, with more massive spheroids containing more massive dark objects. Detailed analysis has shown that black hole mass appears to correlate most tightly with the velocity dispersion of the spheroid (Gebhardt et al., 2000a; Ferrarese & Merritt, 2000). This relation also appears to hold in galaxies with current nuclear activity (Gebhardt et al., 2000b; Ferrarese et al., 2001).
Further circumstantial evidence of a connection between AGN and galaxy formation is that the strong increase in the space density of luminous QSOs with increasing redshift (Boyle et al., 2000) closely matches the increase in the the global star formation rate (Boyle & Terlevich, 1998). Both of these appear to peak at .
| QSO name | R.A. | Dec. | aaAssuming , and . | bbGalactic taken from Schlegel et al (1998). | GS sep.ccGuide star magnitude and separation from QSO. | GS ccGuide star magnitude and separation from QSO. | ||
|---|---|---|---|---|---|---|---|---|
| (J2000) | (J2000) | (mag) | (mag) | (′′) | (mag) | |||
| 2QZ J103204.7001120 | 10 32 04.75 | 00 11 20.2 | 19.25 | 1.8761 | 26.27 | 0.064 | 9.72 | 14.7 |
| 2QZ J105113.8012331 | 10 51 13.86 | 01 23 31.9 | 19.88 | 2.4103 | 26.12 | 0.044 | 11.48 | 14.5 |
| 2QZ J111859.6001737 | 11 18 59.63 | 00 17 37.9 | 20.60 | 1.7494 | 24.67 | 0.049 | 11.00 | 15.3 |
| 2QZ J112839.8015929 | 11 28 39.84 | 01 59 29.0 | 19.21 | 1.7462 | 26.03 | 0.041 | 10.98 | 13.8 |
| 2QZ J133311.4001949 | 13 33 11.42 | 00 19 49.6 | 20.27 | 1.9325 | 25.16 | 0.023 | 11.73 | 13.8 |
| 2QZ J134441.0004951 | 13 44 41.09 | 00 49 51.2 | 18.89 | 2.2605 | 26.87 | 0.024 | 11.98 | 12.8 |
| 2QZ J140854.0023626 | 14 08 54.04 | 02 36 26.4 | 20.69 | 1.8029 | 24.69 | 0.058 | 11.07 | 14.2 |
| 2QZ J144115.5005726 | 14 41 15.51 | 00 57 26.3 | 19.38 | 2.2578 | 26.47 | 0.047 | 10.88 | 15.8 |
| 2QZ J145049.9000143ddFIRST radio detection of mJy. | 14 50 49.92 | 00 01 43.9 | 19.37 | 1.9679 | 26.20 | 0.046 | 11.66 | 14.4 |
Parameters such as the shape, size and luminosity of AGN host galaxies can help to determine how the activity occurs, and also shed light on the process of galaxy formation. The first observations of AGN host galaxies focused on low redshift sources, limited as they were by the moderate resolution of most ground based facilities. It has been know for some time that radio-loud (RL) sources are exclusively found in elliptical galaxies while low-luminosity radio-quiet (RQ) Seyfert galaxies were thought to prefer spiral galaxies. However, more recently Taylor et al. (1996) found that almost half of the RQ AGN in their sample had early-type hosts.
The high resolution available with the Hubble Space Telescope (HST) has provided significant advances in the measurement of AGN host galaxies. At low redshift () Schade et al. (2000) have imaged the hosts of 76 AGN selected from the Einstein Extended Medium Sensitivity Survey. These should be free of any selection bias with respect to host properties, and lie in a luminosity range bracketing the extrapolated break in the AGN luminosity function, . In this sample of RQ AGN 55% had hosts which were dominated by a spheroidal component. Apart from this bias towards earlier morphological types, in all other respects the host galaxies are identical to normal galaxies. For example, they follow the same size-luminosity relations for disks and spheroids as normal galaxies. For brighter low-redshift AGN the hosts are invariably elliptical galaxies (McLure et al., 1999).
At higher redshift, the most systematic and extensive work so far has been by Kukula et al. (2001), who have observed RQ and RL AGN with at and in the rest-frame V-band using NICMOS on the HST. At they find hosts which are consistent with the passive evolution of elliptical galaxies. At higher redshift () it appears that the RQ AGN have hosts which are are somewhat fainter than a passively evolving model, while the RL AGN hosts are still consistent with passively evolved elliptical galaxies. However, although they made detections of hosts at , Kukula et al. struggled to fit both size and luminosity for their RQ sample, as they where faint and compact (similar in size to the NICMOS PSF in the -band).
Our aim in this paper is to make a detailed investigation of the host galaxy properties of AGN at , near the peak in both AGN and cosmic star-formation activity. Our approach has been to select AGN for study that are near to in luminosity. This therefore allows us to examine the hosts of typical AGN at high redshift. In order to obtain sufficient signal-to-noise () and spatial resolution we have used the infrared adaptive optics (AO) system, Hokupa’a, at Gemini North to carry out an imaging survey of high redshift AGN hosts. At , AGN typically have apparent magnitudes of . This is too faint to be used as an AO guide star. Therefore we have used the large database of the 2dF QSO Redshift Survey (2QZ; Croom et al. 2001; Croom et al. 2004) to select AGN which are nearby ( separation) bright Galactic stars which can act as AO guide stars.
In Section 2 we discuss our sample, observations and data reduction. In Section 3 we present analysis of our final AO corrected images, and in Section 4 fit multi-component models to the data, as well as carrying out simulations to determine our expected sensitivity limits. We discuss our conclusions in Section 5

| PSF star name | R.A. | Dec. | aaPhotographic magnitude of PSF star. | GS sep.bbfootnotemark: | GS ccPhotographic magnitude of guide star. |
|---|---|---|---|---|---|
| (J2000) | (J2000) | (mag) | (′′) | (mag) | |
| J103204.7001120-PSF | 10 53 51.76 | 00 13 51.3 | 15.4 | 9.97 | 15.2 |
| J105113.8012331-PSF | 10 51 27.40 | 02 57 20.2 | 16.2 | 12.56 | 14.9 |
| J111859.6001737-PSF | 11 20 58.16 | 02 03 33.4 | 15.7 | 11.76 | 15.6 |
| J112839.8015929-PSF | 11 56 22.70 | 01 39 56.2 | 16.3 | 11.35 | 13.4 |
| J133311.4001949-PSF | 12 33 37.08 | 00 42 07.4 | 16.2 | 12.22 | 14.5 |
| J134441.0004951-PSF | 14 14 05.66 | 01 11 27.0 | 13.3 | 12.69 | 16.3 |
| J140854.0023626-PSF | 13 59 05.93 | 01 15 50.0 | 16.5 | 11.74 | 14.6 |
| J144115.5005726-PSF | 14 35 51.85 | 03 16 35.7 | 16.1 | 10.60 | 16.0 |
| J145049.9000143-PSF | 14 28 47.90 | 02 14 42.6 | 14.4 | 12.64 | 15.8 |
2. Observations and data
2.1. Sample selection
The 2QZ is a color selected QSO sample based on photographic data from the UK Schmidt Telescope. QSOs are selected by their blue stellar appearance from , and photographic plates and films. The survey comprises 30 UKST fields arranged in two declination strips centered on and . The strip extends from to in the South Galactic Cap and the equatorial strip from to in the North Galactic Cap. The range in apparent magnitude is , and QSOs are selected up to . Details of the catalogue along with the public release are given in Croom et al. (2004). Details of the photometric candidate selection are given in Smith et al (2004).
The 2QZ catalogue contains over 23000 QSOs. At the time of our observations it contained 13000 QSOs, of which approximately 6000 were in the strip and therefore easily visible from Gemini North. To obtain good AO correction using the Hokupa’a system on Gemini we were required to have guide stars which were brighter than and had a maximum separation from the QSO of . Also, we wish to examine QSO host galaxies at high redshift, at or near the peak epoch of QSO activity and star formation. We therefore also limited ourselves to QSOs with . Searching our photometric catalogue for QSOs in this redshift range with a nearby bright star resulted in a sample of potential targets. Of these, nine where actually observed with Gemini. The details of the target QSOs are listed in Table 1. Their absolute magnitudes are calculated assuming a cosmological model with , and km s-1 Mpc-1 (used throughout this paper) and using the K-corrections of Cristiani & Vio (1990). We have also corrected for Galactic extinction based on the work of Schlegel, Finkbeiner & Davis (1998). The distribution of redshifts and absolute magnitudes, , are displayed in Fig. 1. Also shown (solid line) is the location of the break in the QSO luminosity function (LF), , for the best fit evolutionary model to the 2QZ LF (Boyle et al., 2000; Croom et al., 2002). Our sample was specifically chosen to span the region around to sample typical QSOs. Our data set was selected purely on it observed frame optical properties, with no reference to emission properties at X-ray or radio wavelengths. However, we have cross-correlated our sources with the FIRST (White et al., 1997) 21cm radio survey and only one of our targets is detected, J145049.9000143, which has a flux of mJy. All other targets must have radio fluxes of less than mJy at 21cm.
The second part of the source selection was to choose suitable pairs of stars to use in our modelling of the PSF. In particular, the detailed form of the AO corrected PSF could depend an a number of parameters, most notably the brightness of the AO guide star, the separation of the guide star from the QSO and the intrinsic, pre-correction, seeing. A first order estimate of the PSF can be obtained simply by using the image of the AO guide star used to correct the QSO images, however this does not account for variations due to the QSOs being off axis (although it does correct perfectly for both the brightness of the AO guide star and the intrinsic seeing). To model more exactly the PSF, we have selected a set of bright star pairs. One of each pair is matched to the properties of a specific AO guide star used for the QSO observations, in both separation from the target source and brightness. At bright magnitudes, and brighter, the photometric calibration of the UKST plate is poor, due to the small number of calibrating stars, and the strong saturate of the photographic plates, being good to only mags. We therefore also chose the matching PSF stars to be from the same UKST plates as the QSOs, so that their photometric calibration would be uniform. The details of the PSF stars are listed in Table 2.
2.2. Gemini observations
Observations were obtained at the Gemini North telescope during the nights of April 20–April 25 2001 using the University of Hawaii (UH) Hokupa’a 35-element adaptive optics system and the QUIRC camera (Graves et al., 1998). The QUIRC camera contains a HAWAII HgCdTe array, with 19.98 milli-arcsecond pixels, delivering a 20 arcsec field of view. Expert assistance was provided by the UH team together with Kathy Roth and John Hamilton. Our observations where primarily carried out in the band with a small number of objects also being observed in the band. Dome flats and dark frames were taken at the start of each night and at the end of some nights. Standard star observations from the UK Infrared Telescope faint standards (FS) list were obtained each night. A key aim in making our observations was to obtain high quality estimates of the PSF. Exposures were taken in a 9-point grid dither pattern with spacings of approximately , making sure that the AO guide star was always on the detector. We also selected exposure times in order to avoid saturating QSOs, AO guide stars and PSF stars (in a single case the PSF was saturated; observations of J144115.5005726 on April 24). Observations of PSF stars were interleaved between science observations to allow us to track the varying atmospheric conditions.
Table 3 lists the details of our observations. The number of frames, the total exposure time on source are listed together with the FWHM measured. A number of objects were repeated on several nights in order to obtain longer exposures or improved image quality.
| Target name | Date | Filter | No. of | Time | FWHM | Notes |
| frames | (s) | (′′) | ||||
| J112839.8015929* | April 20 | 54 | 6357 | 0.16 | 2nd PSF | |
| J134441.0004951* | April 20 | 144 | 4320 | 0.15 | 2nd PSF | |
| J145049.9000143* | April 20 | 20 | 1200 | 0.16 | ||
| J112839.8015929* | April 22 | 8 | 960 | 0.25 | 2nd PSF | |
| J112839.8015929 | April 22 | 44 | 6240 | 0.33 | 2nd PSF | |
| J134441.0004951 | April 22 | 141 | 4830 | 0.24 | 2nd PSF | |
| J105113.8012331 | April 23 | 45 | 2700 | 0.25 | QSO on edge | |
| J140854.0023626* | April 23 | 157 | 4710 | 0.15 | Binary GS | |
| J145049.9000143* | April 23 | 63 | 3780 | 0.19 | ||
| J105113.8012331* | April 24 | 54 | 2430 | 0.11 | ||
| J111859.6001737* | April 24 | 63 | 5535 | 0.18 | ||
| J133311.4001949* | April 24 | 81 | 5400 | 0.15 | ||
| J144115.5005726 | April 24 | 78 | 5890 | 0.22 | Saturated PSF | |
| J103204.7001120* | April 25 | 81 | 4860 | 0.14 | 2nd PSF | |
| J111859.6001737 | April 25 | 27 | 2700 | 0.15 | poor flat fielding | |
| J134441.0004951* | April 25 | 90 | 2700 | 0.11 | 2nd PSF (edge) | |
| J144115.5005726* | April 25 | 35 | 2100 | 0.12 | ||
| J134441.0004951-PSF | April 20 | 27 | 135 | 0.12 | ||
| J134441.0004951-PSF | April 22 | 27 | 135 | 0.23 | 2 PSFs | |
| J105113.8012331-PSF | April 23 | 36 | 855 | 0.24 | ||
| J140854.0023626-PSF | April 23 | 27 | 540 | 0.16 | ||
| J145049.9000143-PSF | April 23 | 27 | 540 | 0.20 | ||
| J105113.8012331-PSF | April 24 | 9 | 180 | 0.11 | ||
| J111859.6001737-PSF | April 24 | 9 | 540 | 0.16 | ||
| J133311.4001949-PSF | April 24 | 12 | 720 | 0.15 | ||
| J144115.5005726-PSF | April 24 | 11 | 660 | 0.23 |
There were a wide range of observing conditions or instrument performance which varied on a short time-scale, often showing dramatic changes in the resolution within a single set of integrations. Thus the resulting data set has a range of sensitivities with respect to detection of host galaxies and this requires detailed modelling of the sensitivities.
2.3. Data Reduction
Reduction of the images from Hokupa’a/Quirc was done using parts of the IRAF GEMINI.GEMTOOL and GEMINI.QUIRC packages. Dome flat fields with a range of exposure times were taken and the task GEMINI.QUIRC.QFLAT task was used to make flat field images and bad pixel masks.
Exposure times for science images ranged from 30 to 240 seconds so that many images (16 to 200) were taken and combined to form the final images. The main constraint on exposure time was the requirement that the AO guide star did not saturate because that star serves as the first order estimate of the PSF. Each cycle of the 9-point dither pattern took about 30 minutes and a separate sky was derived for each cycle from the science frames themselves using the QSKY task ensuring that objects were masked beyond the radius at which the faint wings were detectable, typically . The combination of this large masking radius, and the jitter pattern spacing means that on scales residual host galaxy flux might be suppressed if it were present. However, reasonable physical models of host galaxies, do not have significant flux at this radius, and even if they did, they would then be easily detectable at smaller angular scales. The sky from each dither cycle was subtracted from each member image of that cycle. The sky subtraction and flat-fielding was accomplished using the QREDUCE task.
The stacking of images was done with scripts developed specifically for this purpose. The images were inspected visually, and shifts determined by centroiding on the AO guide star. We note that using the QSO image to centroid on would have resulted in large random errors due to the relatively low S/N of the QSO image in a single frame. A small number () of very poor quality images (usually due to bad guiding) were rejected at this stage. After sky subtraction, individual images were shifted and then averaged, scaling by exposure time (as there was no significant variation in sky level which would have necessitated a variance weighted combination).
We analysed the variations in flux due to airmass within a large (30 pixel, ) aperture, but no trend was found. We therefore simply scaled our images by exposure time. Weights in the combination process were also proportional to exposure time.
We found that best results were obtained if a separate sky was constructed for each distinct exposure time within a set of integrations rather than combining different exposure times into a single sky.
2.4. Standard stars
Standard stars were measured with a series of apertures from 0.06 to 8 arcseconds and the growth curves examined. Zero-points were defined with reference to the Mauna Kea Observatory system in and , using apertures of which was confirmed as reasonable from the growth curves. No significant extinction term was found in the band. In the band, observations were not made over sufficient range in airmass to derive an extinction term. Therefore no extinction term was applied to either the or band photometry.
3. Image analysis
In total 17 observations were made of 9 science targets. Of these, three (J112839.8015929, J134441.0004951 and J111859.6001737) were observed in the -band, as well as . the aim of these -band observations was to determine the colors of host galaxies, if detected. As host galaxies were not detected in these sources and the FWHM of the -band PSFs were generally worse than in the -band, we restrict our discussion below to concern the -band imaging. We therefore consider the 14 -band images of 9 science targets. Five of our targets had repeats observations, these were taken to obtain images in better seeing conditions (J134441.0004951, J105113.8012331, J144115.5005726) or with longer exposure times (J145049.9000143). Of these 14 observations a further 2 were rejected: The observation of J105113.8012331 on the 23rd April has the QSO very close to the edge of the detector in one of the dither positions; The April 24th observation of J144115.5005726 has a saturated PSF star. Removing these from our sample we have a set of 12 observations of 9 QSOs. The number of individual exposures that were combined to produce a single image ranged from 8 to 157 (median 36) with total exposure times that ranged from 960 seconds to 6357 seconds with a median of 4320 seconds. The total integration times for individual objects (where more than 1 stack was produced for an object) ranged from 4700 to 7990 seconds in (median 5400 seconds) and ranged from 2700 to 6240 seconds for the three objects that were also observed in . Image quality in the aligned and stacked science images ranged from 0.11 to 0.25 arcseconds full-width at half maximum (FWHM) in the -band, with a median of 0.15 arcseconds. A list of the observational details appears in Table 3.
Also listed in Table 3 are the observations of PSF stars made in order to calibrate the PSFs in our science images. Eight separate observations were made of PSF stars in the -band, and one in the -band. These observations were made in order for us to better characterize the expected PSF of our QSO targets, and hence to make more accurate model fits to determine the host galaxy contribution to the source flux.
3.1. Point-spread function analysis
Before analysing the QSOs, we require a detailed characterization of the PSF. A central part of the problem of detecting and measuring host galaxies around these AGN is understanding the PSF. The challenges of modelling the PSF are severe with AO systems. The PSF is expected to change as a function of distance from the AO guide star. Increasing distance from the guide star degrades the resolution, and some elongation is expected, with the major axis being directed towards the location of the guide star. Variations will also be expected, depending on the brightness of the AO guide star, and the uncorrected seeing. Our observations were designed to enable us to quantify these effects.
Preliminary investigations showed that Moffat profiles provided a significantly better fit to the PSFs than did Gaussians. Therefore, in our analysis below, we will use Moffat profiles of the form
| (1) |
where is the intensity at a given pixel, a distance from the center of the source, is the central intensity of the source, and and are parameters which define the shape of the profile. is typically for our images. We will also discuss the FWHM of the images, which for a Moffat profile is defined as
| (2) |
We also investigated whether there was any evidence of a core-halo structure in our PSFs. Even when stacking multiple PSFs we found no evidence of an extended halo around the compact core of the PSF. This is most likely attributable to the relatively low strehl ratios () in our observations.
In all cases the images of our science targets included the AO guide star on the chip. This provides a first order measurement of the PSF obtained in the same conditions as the science observation. In several cases there exist secondary PSF stars on the science frames in addition to the guide star. These secondary PSFs provide an estimate of the spatial variation of the PSF with distance from the guide star. In the case that no secondary PSF stars were available in the AO-corrected field a star-star pair was observed to quantify the spatial variation of the PSF. One of the stars served as the AO guide star and primary PSF and the second served as the secondary PSF. Our 8 PSF star observations had a median separation of 12.6 arcseconds (range 11.1 to 13.3 arcseconds), and the 5 star-star pairs found on the science images had separations from 6.0 to 14.5 arcseconds with a median of 10.6 arcseconds. For comparison, the separations from the AO guide star to the science targets ranged from 9.9 to 13.0 arcseconds with a median of 10.7 arcseconds. The ”delivered” resolution of the aligned and stacked PSF images ranged from 0.11 to 0.24 arcseconds with a median value of 0.15 arcseconds. This is similar to the distribution of science image delivered resolutions.
The fundamental measurements that provide a basic characterization of the PSF are the FWHM of the profile, the ellipticity, and the position angle (PA). These were derived by fitting a Moffat profile to the two-dimensional image using the IRAF IMEXAMINE task. The ”direct” FWHM was adopted.

Fig. 2 is a comparison of the parameters of all of the star-star pairs in our observations both from those science frames that had secondary PSFs and from the star-star pairs that we observed. We first directly compare the PA, ellipticity and FWHM of the guide stars and the PSF stars in Figs. 2a, b and c. We see that the AO guide stars and PSF stars generally have the same PAs and ellipticity, with no evidence of systematic changes in orientation or ellipticity seen for the PSF stars. As in all cases the sources are close to circular, the error on the PA is large. In Fig. 2c we show the FWHM of the PSF stars vs. that of the AO guide stars. We see that the PSF stars generally have a slightly wider FWHM than the AO guide stars, which is as expected given that the PSF stars are off axis.
We next show the quantity PA in Fig. 2d. This is the absolute value of the difference between the PA of the model fit to the secondary PSF star and angle of a line from the secondary PSF to the AO guide star. We plot this against the difference in ellipticity between the AO guide star and the PSF star. If the PSF star was elongated with its major axis pointing toward the guide star then these angles should cluster around zero, that is, the major axis should tend to point toward the guide star. This is not the case. On the same figure the quantity ellipticity is the difference in ellipticity between the AO guide star and the PSF star. If the PSF star was elongated then this should tend to be a positive quantity. This is not the case. We therefore fail to detect any elongation of the PSF stars, in the direction of the AO guide star, or any other direction.
Figs. 2e and f show the difference between the FWHM of the PSF star and the AO guide star (FWHM=(FWHM(PSF)-FWHM(GS))). A positive value indicates that the resolution of the PSF star is degraded relative to the guide star. The expected degradation is detected and ranges from zero (no degradation) to 0.05 arcseconds or a relative loss of resolution of roughly 30%. It might be expected that the most significant difference between guide star FWHM and PSF FWHM would occur with the faintest guide stars and the largest separation between the PSF stars and AO guide stars. We see no significant evidence that this is the case. The closest PSF star (at separation) does have a FWHM which is close to zero, however, at larger separations other PSF stars with FWHM close to zero can be found. The AO guide star - QSO separations are , and in this range there is no observable trend of FWHM with separation. Over the range of AO guide star magnitudes used for our targets there is also no evidence of any correlation between guide star magnitude and FWHM.
In summary, we see that there is typically a degradation of (full range of ) at the separations used in our observations. However the amount of degradation does not seem to depend on any observable parameters. This dispersion in FWHM will be accounted for in our analysis below.
3.2. QSO images
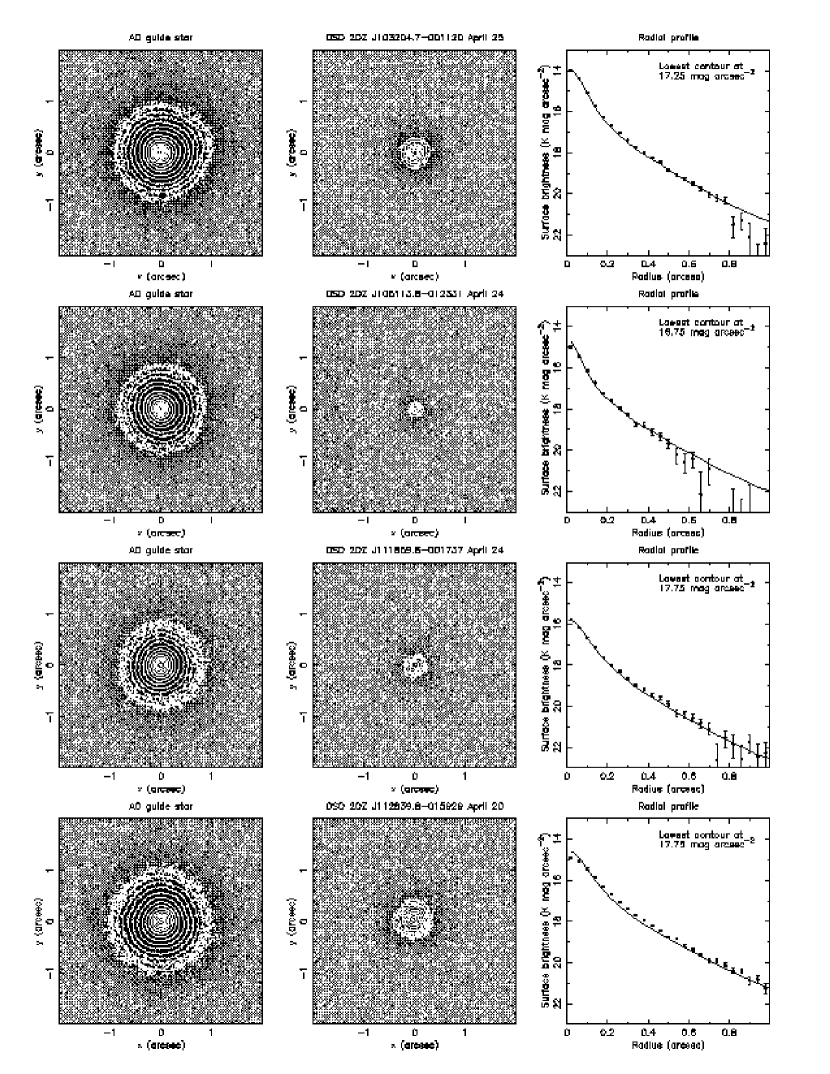
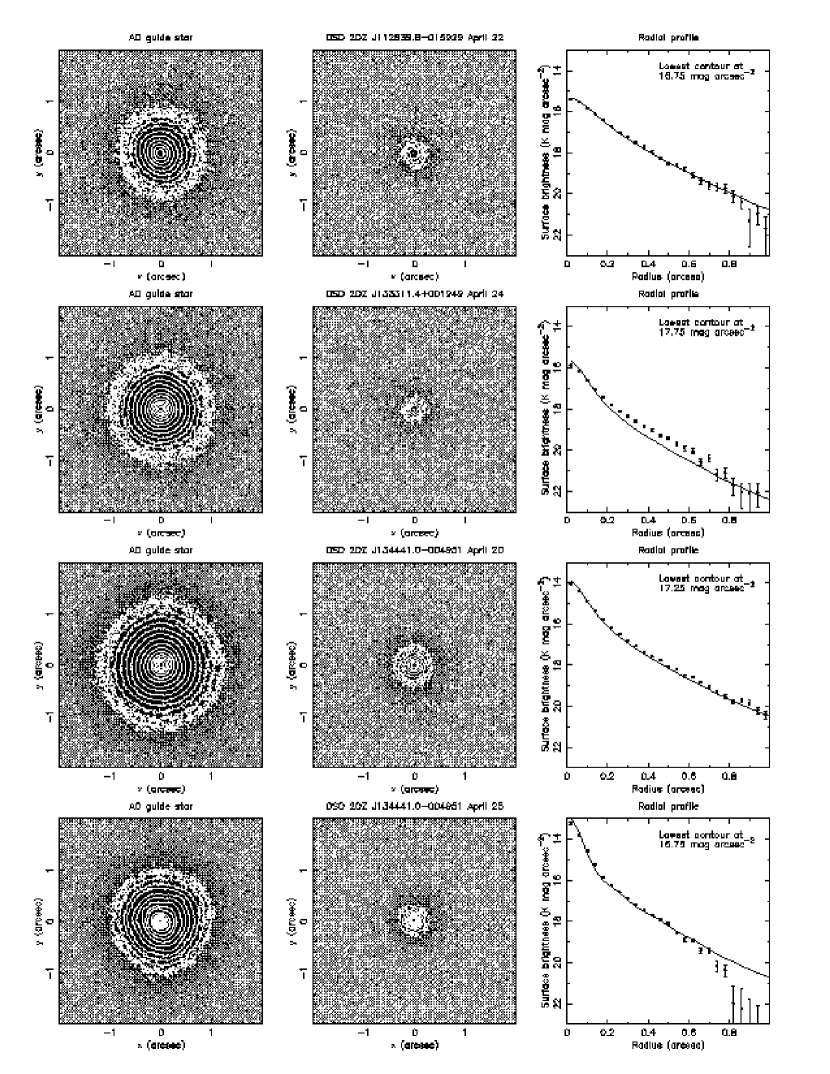
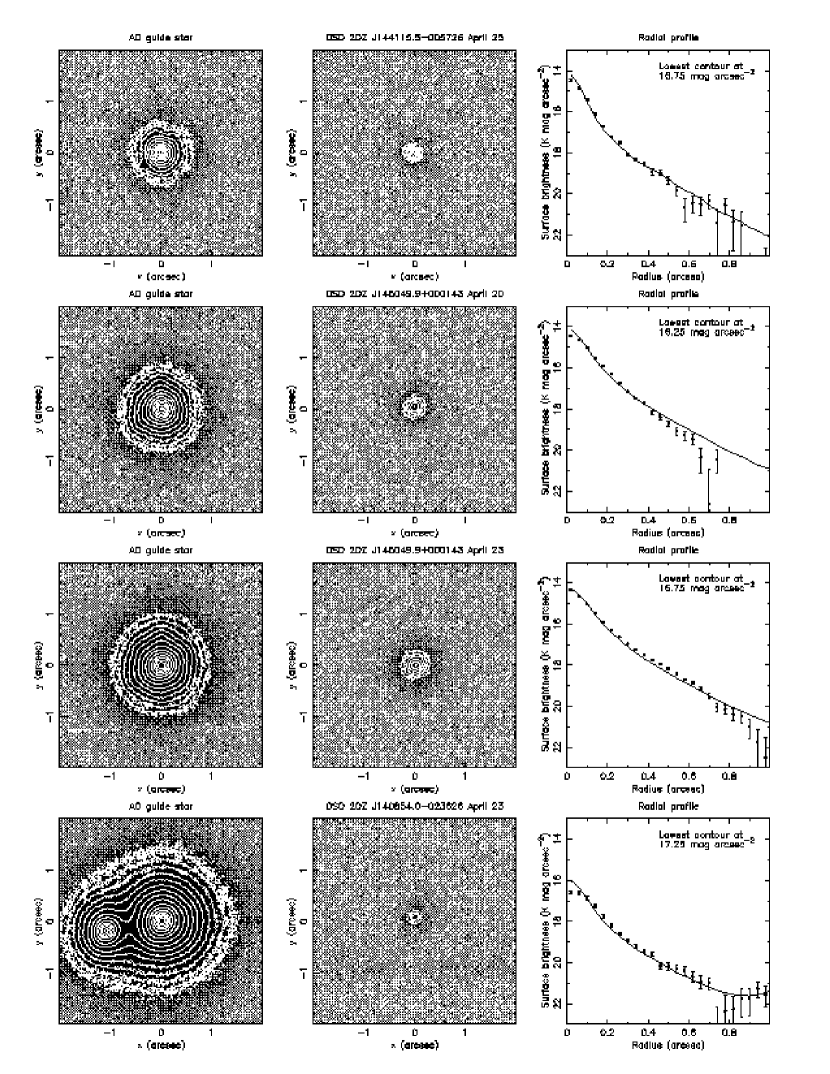
Given the above estimates of the PSF variations, we now attempt to model the QSO images, in order to derive the fundamental parameters of the host galaxies. The images of the 12 AO guide star/QSO pairs are shown in Fig. 3. Both images are displayed on the same scale, and the contours are at 0.5 mag arcsec-2 intervals. The level of the lowest contour is set to be the first contour above 5 times the RMS sky noise. Also plotted are the radial profiles for both the AO guide stars and QSOs. The profiles are determined relative to the image centroid, and are averaged in 2 pixel bins. The errors are the standard errors derived from the dispersion in each bin, and do not take into account errors in the PSF. The AO guide star profile (solid line) has been normalized to the QSO, based on the total flux within a 0.2 arcsec radius aperture. Although we have not broadened the AO guide star PSF, we see that in many cases it matches closely the PSF of the QSO. This demonstrates that in most cases the AO guide star gives a good estimate of the PSF. By a straight forward comparison of the profiles, we can see that few of the QSOs show evidence for an extended component. The QSO 2QZ J133311.4001949 is the best example of a source with an extended component, with the QSO radial profile being significantly broader that the AO guide star PSF. In our model fitting below we will assess the significance of this extended component and attempt to determine its parameters.
4. Two-dimensional profile fitting
If the form of the host galaxy luminosity profile is known reasonably well then an effective way to detect the presence of a host galaxy is to do a simultaneous fit of the nuclear point source and the host galaxy luminosity profile including the convolution with the PSF. This procedure can also yield reliable limits on the brightness and other properties of possible sources in the case of no detection. This procedure requires assumptions about the possible range of morphologies of sources. Most nearby massive galaxies have luminosity profiles that are reasonably well-described by some combination of an exponential disk and a more compact component, often modelled using the deVaucouleurs law form. Schade et al. (2000) extended this approach by adding a point-source component and the results suggest that the characteristics of the underlying host galaxy can be extracted reliably given a sufficient combination of signal-to-noise ratio and spatial resolution. This approach is adopted for the present study.
4.1. Fitting procedure
The details of the fitting procedure are similar to those described in Schade et al. (2000). For each image a fit was made with the three components described above. Given the relationship between spheroids and massive central objects (Gebhardt et al., 2000a; Ferrarese & Merritt, 2000) we are particularly interested in the detection of bulge-like components. Models were integrated over each pixel and convolved with the adopted PSF. Our observational procedure provides a first-order estimate of the PSF (based on the AO guide star) and our separate PSF star observations provide an estimate of the change in the PSF from the guide star position to the position of the QSO. As shown in Fig. 2 we observe scatter in the quantity (the change in the full-width at half maximum of a point source between the guide star position and the science target position) rather than systematic variations in FWHM and the other properties (ellipticity and major axis position angle) that could be used to make precise predictions of the characteristics of the PSF at the science target position. In the absence of a predictive trend, our best estimate of the PSF at the science target positions is the guide star PSF broadened by arcseconds. With this assumption we expect of the observations to have FWHM that lie within 0.02 arcseconds of that predicted resolution.
In practice, we deal with the PSF uncertainty by fitting each science image with three PSFs. These cover a range of FWHM values from that of the observed AO guide star to 0.04–0.05 arcseconds greater than the AO guide star. This range of is approximate, as we chose actual PSFs from other observations to use as the broadened PSFs, rather than trying to artificially broaden the AO guide star PSF. In a small number of cases PSFs of the required FWHM were not avaiable, and so for these objects, PSFs were constructed based on the observed AO guide star using the IRAF MAGNIFY task. The management of the PSFs was done using DAOPHOT (Stetson, 1987) which models the PSF by a combination of an analytical function and a look-up table of residuals. This PSF can then be centered at any position with respect to the pixel grid.
4.2. Simulations of host galaxy detection sensitivity
In order to understand the effectiveness of the fitting procedure an extensive set of simulations were performed where images of galaxies with known size, surface brightness, and morphology were created and then subjected to the fitting procedure and the outcome evaluated. In particular, we estimated the probability of detecting elliptical host galaxies of luminosities , , and . At redshift a elliptical galaxy subject to passive evolution (assuming a single burst of star formation at ) corresponds to an observed mag (being mag more luminous in the rest frame -band than at ). Luminosities of and correspond to -band apparent magnitudes of 19.8 and 18.6 respectively.
The relation between size and luminosity is taken from Schade, Barrientos, & Lopez-Cruz (1997) and corresponds to half-light radius () of 0.37, 0.65, and 0.90 arcseconds for , , and respectively. For each source, the observed magnitude was taken to be the sum of a nuclear point source and a host galaxy with pure bulge morphology (no disk component) with luminosity of , , or and this assumption determined the division of light between the bulge and nuclear point-source components. The sources in our sample with the brightest apparent magnitudes are completely dominated by the point source component and any host galaxy would thus be very difficult to detect unless it were extremely luminous. Pure bulge components for the host galaxy represent the most difficult case for detection by the fitting process because disk components would be expected, in general, to be more extended at a given luminosity and thus easier to separate from the point source. Thus if the host galaxies had disk morphologies then the probability of detecting them would be higher at a given luminosity than the estimates for elliptical hosts.
Simulations were prepared on a source-by-source basis using the actual exposure times, sky brightnesses (which varied significantly), and noise characteristics for the images of each object (we also included repeat observations apart from the April 22 observation of J112839.8–015929 which has a short integration time and poor seeing). In each case, a model of the final deep QSO image was added to a suitable sky frame (rather than simulating each frame of our dithered observations). The relation between the resolution of the AO guide star (our first order PSF) and the actual resolution at the position of the QSO was estimated from those frames where two or more stars were available on the frame (see Section 3.1 above). Centering errors were introduced into the simulations by assigning fractional-pixel positions that varied randomly so that each galaxy was centered differently with respect to the pixel grid. Then the centroiding algorithm was applied to the simulated images to determine the center for the purposes of the fitting procedure. This is a relevant source of error because the PSF and the models are both discrete before convolution and a discrete fast Fourier transform is used to accomplish the convolution.
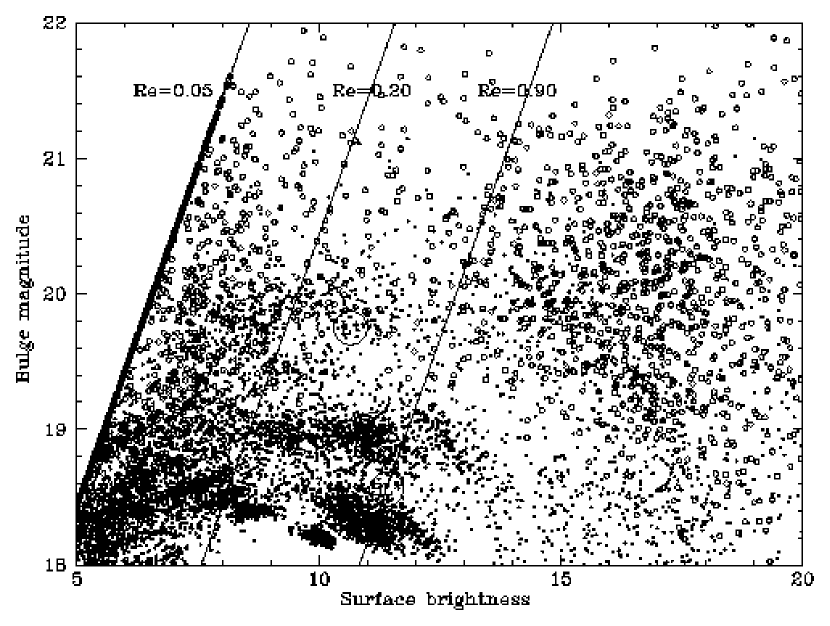
The uncertainty in the PSF is a major source of error in detecting galaxies and estimating their sizes and surface brightness. Each set of 100 simulations was repeated with 5 different PSFs which varied in FWHM around the true value from 0.02 arcseconds smaller to 0.02 arcseconds larger than the value that was used to create the simulated galaxy image. Therefore, each of our observations of acceptable quality was simulated 1500 times (100 simulations for each of 3 model galaxy luminosities and each of 5 PSFs). Each observation was also simulated 500 times (100 simulations for each of 5 PSFs) with only a point source. Fig. 4 shows the results of these simulations. The point source simulations (open circles) are shown for the full range of PSF simulations as are the galaxies (filled circles). The clumps of points near (surface brightness, magnitude) equal to (10.0, 19) and (10.5, 18.5) are detections of simulated galaxies with luminosities and respectively. Few galaxies at were detected. Two thirds (67.6%) of the simulated galaxies were fitted with half-light radii at the fitting limit of 0.05 arcseconds. From this figure it is clear that our observations have little sensitivity to elliptical galaxies fainter than K=19.5 and reasonable structural parameters. Note that much of the plane in Fig. 4 represents unphysical sets of parameters for galaxies in the local Universe.
For the purposes of estimating sensitivity a successful detection will be defined as a fitting result giving a galaxy brighter than and with a half-light radius larger than 0.2 arcseconds. Further, we will require that the surface brightness in is less than 14 magnitudes per square arcsecond. With this definition we find globally that 1.2 per cent of the simulations of pure point sources are detected as galaxies so that the rate of spurious detections is small even including the effect of PSF errors.
Table 4 gives the FHWM and total magnitdue for each observation together with the detection probabilities assuming an elliptical host galaxy of the given luminosity. Probabilities are shown for the case where the PSF is known exactly and for a case where there are uncertainties in the PSF. For the latter case the average is weighted with the case of a perfect PSF given a weight of unity and errors of 0.01 and 0.02 in the FWHM of the PSF given weights of 0.5 and 0.25 respectively. These weights are a crude way to include the fact that the larger errors are less likely to occur than the smaller errors. We have insufficient information to do better than this estimate.
The detection probabilities range from 0 to 1 and only a fraction of our observations have significant sensitivity to the galaxies that we have modelled. Our observations have very little sensitivity to galaxies less luminous that . This is largely due to their small size (, compared to for a galaxy). The sum of the probabilities at each luminosity can be taken as the expected number of galaxies that would have been detected at a given luminosity if all QSOs resided in host galaxies at that luminosity. Using the weighted probability we would have expected 0.4 galaxies of luminosity to be detected, 2.6 galaxies at , or 4.0 galaxies of under the assumptions stated. The expected number of detected galaxies is slightly higher if the PSF uncertainties are negligible (0.2, 3.3, and 4.6 galaxies respectively). In some cases, when the detection probability is low, the probability is greater when allowing for PSF errors. This is due to spurious detections. We also note that the four objects for which we have reasonable probabilities of detecting host galaxies are the faintest four sources in our sample. Contrast clearly plays an important role in being able to distinguish a faint bulge component, as the point source becomes brighter a bulge component of a given brightness becomes harder to detect.
| Name | Night | FWHM | Exp. | Mag | |||
|---|---|---|---|---|---|---|---|
| (′′) | Time (s) | () | |||||
| J112839.8015929 | April 20 | 0.16 | 6357 | 17.004 | 0.00 (0.01) | 0.01 (0.06) | 0.01 (0.10) |
| J134441.0004951 | April 20 | 0.15 | 4320 | 16.348 | 0.00 (0.00) | 0.00 (0.00) | 0.00 (0.00) |
| J145049.9000143 | April 20 | 0.16 | 1200 | 17.070 | 0.01 (0.04) | 0.01 (0.06) | 0.09 (0.20) |
| J140854.0023626 | April 23 | 0.15 | 4710 | 18.052 | 0.01 (0.06) | 0.81 (0.64) | 1.00 (0.90) |
| J105113.8012331 | April 24 | 0.11 | 2430 | 17.887 | 0.15 (0.06) | 0.80 (0.32) | 1.00 (0.42) |
| J111859.6001737 | April 24 | 0.18 | 5535 | 18.343 | 0.00 (0.12) | 0.85 (0.79) | 1.00 (1.00) |
| J133311.4001949 | April 24 | 0.15 | 5400 | 18.077 | 0.00 (0.05) | 0.84 (0.64) | 1.00 (0.91) |
| J144115.5005726 | April 24 | 0.22 | 5890 | 17.395 | 0.00 (0.00) | 0.00 (0.00) | 0.00 (0.00) |
| J103204.7001120 | April 25 | 0.14 | 4860 | 16.919 | 0.00 (0.00) | 0.00 (0.01) | 0.00 (0.04) |
| J134441.0004951 | April 25 | 0.11 | 2700 | 16.348 | 0.00 (0.00) | 0.00 (0.00) | 0.02 (0.00) |
| J144115.5005726 | April 25 | 0.12 | 2100 | 17.395 | 0.00 (0.03) | 0.02 (0.10) | 0.46 (0.42) |
4.3. Fitting results
We have calculated the probabilities for detection of galaxies with a very specific set of assumptions about their size, luminosity, and morphology. The simulations demonstrated that spurious detections occur some small fraction of the time largely because of the uncertainty in the PSF. We will adopt the same set of criteria for accepting a host galaxy detection as legitimate as we chose from the simulations. We require a detection of a host galaxy brighter than and with a half-light radius larger than 0.2 arcseconds and with a -band surface brightness less than 14 mag arcsec-2.
As in the simulations, many of the fits resulted in the statistical detection of a galaxy component in addition to the point source but most of these ”detections” are galaxies with sizes at the limit of 0.05 arcseconds. In these cases the galaxy component is simply assuming the role of fitting small residuals between the adopted PSF and the actual PSF (which is not precisely known). The fitting procedure is not sensitive to host galaxies with sizes that are so small that they approach point sources after accounting for the convolution with the PSF.
4.3.1 Detections
Fits to the actual observations resulted in a number of apparent detections. These are discussed below:
4.3.2 J112839.8015929
The observation of J112839.8015929 on the 22nd April showed a detection of a bulge with a reasonable set of galaxy parameters. Both the size and surface brightness fall within our acceptable range for a range of PSFs, with a best fit arcseconds. However, the observation was of poor quality ( FWHM and short exposure time, see Fig. 3). There are two other images of this object and both were of superior quality (one in the -band). Fits to those images resulted in no detection. This detection is thus rejected as spurious but it is worrying that we needed additional data to reject it.

4.3.3 J133311.4001949
The best detection that we have is on the observation of J133311.4001949 on the 24th April. The data quality is good (FWHM= and exposure time 5400 seconds). The detection is fairly robust against changes in the fitting PSF. The best fit parameters for the host galaxy are , half-light radius arcseconds and central surface brightness in of . The errors are estimates from the range of best-fit parameters after varying the PSF. Visual examination of the fit yields no reason to reject it. The fitted parameters would indicate that this is a galaxy of luminosity roughly 3L* with a slightly higher surface brightness and smaller radius than expected. The radial surface brightness distribution for J133311.4001949 is shown in Fig. 5. The errors shown are purely statistical, based on the scatter within each annulus. Overplotted is the best fit model (solid line) which comprises a point source (dotted line) and an law bulge convolved with the PSF derived from the AO guide star (dashed line). A clear excess over the point source profile is seen which is well described by an law at .

5. Discussion
Given the upper limits to potential host galaxy magnitudes derived in the simulations above. We now consider what these imply for the evolution of QSO host galaxies. Our observations were made in the -band, which is close to the rest-frame -band. This then allows direct comparison with the low redshift observations of Schade et al. (2000). We wish to determine whether our observations are consistent with host galaxies which evolve more or less strongly that may be predicted by simple passive evolution. To determine this we make comparisons to the simple single instantaneous burst models of Bruzual & Charlot (1995). In Fig. 6 we show the evolution of a single instantaneous burst at in the rest-frame -band (solid lines) and compare this to the measured luminosities of QSO host galaxies (similar to Fig. 7 of Kukula et al. 2001). The evolutionary curves are relative to the local value of found from the 2dF Galaxy Redshift Survey (Norberg et al., 2000). The evolution is shown for galaxies of current day luminosity , , and . At low redshift we plot the host galaxy magnitudes found by Schade et al. from their low redshift X-ray selected sample (filled circles). Although there is large scatter (which is partly due to a weak correlation with luminosity), it is clear that these host galaxies have luminosites which are at most a few times . We also plot the average absolute magnitudes of radio quiet QSO host galaxies measured by Kukula et al (2001) (filled squares) transformed from the band to the band using the color of the passively evolving model at each redshift. These show no evidence of any evolution with redshift. Our host galaxy detection at is shown (open circle), and is seen to lie at an absolute magnitude equivalent to (passively evolved). We also mark the location of upper limits corresponding to , 19 and 20 at (arrows). The above simulations showed that our host galaxies must typically have -band magnitudes fainter than , therefore they are consistent with being only a few times the passively evolved . As a comparison we also show the evolution found in the AGN point source (dotted line), as measured by the evolution of the QSO luminosity function from the 2QZ (Boyle et al., 2000). If the host galaxies were to evolve by this amount, they would be easily detectable in our Gemini observations.
Thus, our Gemini observations show that the host galaxies of high redshift QSOs cannot be significantly more luminous than would be predicted from passive evolution of their stellar population. Although we have used a simple model (a single instantaneous burst) to describe host galaxy passive evolution, it is worth noting that any more complex model (e.g. with on-going star-formation) is likely to show much stronger evolution so long as star formation declines towards low redshift. This agrees with the HST observations of Kukula et al. (2001) which also show little evolution in the host galaxy properties of radio-quiet QSOs. We do note however, that Kukula et al were not able to constrain both the size and brightness of their detected host galaxies in their radio quiet sample.
We can also view this from the perspective of the relationship between bulge mass and black hole mass derived for AGN at (Magorrian et al. 1998, Gebhardt et al. 2000a). Casting this in terms of bulge and AGN luminosity we obtain (see McLeod, Reike & Storrie-Lombardi 1999; Schade et al. 2000):
| (3) | |||||
where is the AGN luminosity expressed in terms of the Eddington luminosity, is the mass-to-light ratio in the band, BC is the bolometic correction from to total luminosity for the AGN and in the fraction of spheroid mass in the black hole.
Adopting values consistent with low redshift AGN; , and , the relation reduces to
| (4) |
In this analysis, we obtain an upper limit of for a typical QSO: , implying that
| (5) |
i.e. that the fraction of black hole mass to bulge mass is at least an order of magnitude higher at than at . Equally, an increase in the efficiency of the black hole to could also account for the observed upper limit on the bulge luminosity whilst maintaining . However, in either case, the faintness of the host galaxy at in relation to observations at low redshift suggests that the conditions in AGN at are fundamentally different to those studied at lower redshift; requiring at least an order of magnitude change in the Eddington luminosity ratio or in the mass of the black hole in relation to the bulge mass of the galaxy.
Moreover, a recent analysis of QSO spectra from the 2QZ shows that the black hole mass to AGN luminosity relation does not appear to evolve strongly with redshift over the range (Corbett et al. 2003). This observation implies little if any change in the value of over this redshift range, suggesting that it is the evolution of black hole mass (and thus the bulge-to-black hole mass ratio), rather than fuelling rate, that is driving the observed evolution of the QSO luminosity function. Thus, more massive black holes are active at high redshift. This rather counter-intuative picture suggests that QSOs would have a single active phase at the formation of the spheroid, the subsequent evolution in the QSO LF reflecting the decreasing efficiency with which massive black holes could be formed in a spheroid of given mass over the range . This clearly needs further investigation, as the evolution of the black hole mass to bulge mass correlation at high redshift is a crucial to understanding the formation of QSOs. Once clear detections of host galaxies have been made, follow up to determine black hole mass (e.g. through reverberation mapping) should be of high priority.
References
- Boyle et al. (2000) Boyle, B. J., Shanks, T., Croom, S. M., Smith, R. J., Miller, L., Loaring, N. & Heymans, C. 2000, MNRAS, 317, 1014
- Boyle & Terlevich (1998) Boyle, B. J. & Terlevich, R., 1998, MNRAS, 293, L49
- Corbett et al. (2003) Corbett, E. A., et al. 2003, MNRAS, 343, 705
- Cristiani & Vio (1990) Cristiani, S. & Vio, R. 1990, A&A, 227, 385
- Croom et al. (2003) Croom, S. M., Smith, R. J., Boyle, B. J., Shanks, T., Miller, L., Outram, P. J., & Loaring, N. S. 2004, MNRAS, in press
- Croom et al. (2002) Croom, S. M., Boyle, B. J., Loaring, N. S., Miller, L., Outram, P. J., Shanks, T. & Smith, R. J. 2002, MNRAS, 335, 459
- Croom et al. (2001) Croom, S. M., Smith, R. J., Boyle, B. J., Shanks, T., Loaring, N. S., Miller, L., & Lewis, I. J., MNRAS, 322, L29
- Ferrarese & Merritt (2000) Ferrarese, L. & Merritt, D., ApJ, 539, L9
- Ferrarese et al. (2001) Ferrarese, L., Pogge, R. W., Peterson, B. M., Merritt, D., Wandel, A., Joseph, C. L. 2001, ApJ, 555, L79
- Gebhardt et al. (2000a) Gebhardt, K., et al. 2000a, ApJ, 539, L13
- Gebhardt et al. (2000b) Gebhardt, K., et al. 2000b, ApJ, 543, L5
- Graves et al. (1998) Graves, J. E., Northcott, M. J., Roddier, F. J., Roddier, C. A. & Close, L. M. 1998, SPIE Vol. 3353, Adaptive Optical Systems Technologies, ed. D. Bonaccini & R. K. Tyson, SPIE, Washington, 34
- Kormendy & Richstone (1995) Kormendy, J. & Richstone, D. 1995, ARA&A, 33, 581
- Kukula et al. (2001) Kukula, M. J., Dunlop, J. S., McLure, R. J., Miller, L., Percival, W. J., Baum, S. A., O’Dea, C. P. 2001, MNRAS, 326, 1533
- Magorrian et al. (1998) Magorrian, J., et al. 1998, AJ, 115, 2285
- McLeod et al. (1999) McLeod, K. K., Reike, G. H. & Storrie-Lombardi, L. J. 1999, ApJ, 511, 67
- McLure et al. (1999) McLure, R. J., Kukula, M. J., Dunlop, J. S., Baum, S. A., O’Dea, C. P. & Hughes, D. H. 1999, MNRAS, 308, 377
- Norberg et al. (2000) Norberg, P. et al. 2002, MNRAS, 336, 907
- Schade et al. (1997) Schade, D., Barrientos, L. F., & Lopez-Cruz, O., 1997, ApJ, 477, 17
- Schade et al. (2000) Schade, D., Boyle, B. J. & Letawsky, M. 2000, MNRAS, 315, 498
- Schlegel, Finkbeiner & Davis (1998) Schlegel, D. J., Finkbeiner, D. P. & Davis, M., 1998, ApJ, 500, 525
- Smith et al. (2004) Smith, R. J., Croom, S. M., Boyle, B. J., Shanks, T., Miller, L. & Loaring, N. S. 2004, MNRAS, submitted
- Stetson (1987) Stetson, P. B., 1987, PASP, 99, 191
- Stoughton et al. (2002) Stoughton, C. et al., 2002, AJ, 123, 485
- Taylor et al. (1996) Taylor, G. L., Dunlop, J. S., Hughes, D. H., Robson, E. I., MNRAS, 283, 930
- White et al. (1997) White, R. L., Becker, R. H., Helfand, D. J., & Gregg, M. D., 1997, ApJ, 475, 479