On The Nature of the Variable Infrared Emission from Sgr A*
Abstract
Recent infrared (IR) observations of the center of our Galaxy indicate that the supermassive black hole source Sgr A* is strongly variable in the IR. The timescale for the variability, min, is comparable to that of the X-ray flares observed by Chandra and XMM, suggesting a common physical origin. In this paper, we investigate the nature of the IR emission in the context of models recently proposed to interpret the X-ray flares. We show that the IR emission in Sgr A* can be well explained by nonthermal synchrotron emission if a small fraction of the electrons in the innermost region of the accretion flow around the black hole are accelerated into a broken power-law distribution, perhaps due to transient events such as magnetic reconnection. The model predicts differences in the variability amplitudes of flares in the IR and X-rays, in general agreement with observations. It also predicts that the IR emission should be linearly polarized, as has indeed been observed during one epoch. IR and X-ray flares analogous to those observed in Sgr A* may be detectable from other accreting SMBHs, provided ; at higher luminosities the flaring emission is dominated by thermal synchrotron-self Compton emission, which is likely to be less variable.
1 Introduction
The center of our Galaxy provides the best evidence to date for a massive black hole (e.g., Schödel et al. 2002; Ghez et al. 2003a), associated with the compact radio source, Sgr A* (see, e.g., Melia & Falcke 2001). Since the original discovery of Sgr A* in the radio, there have been intensive searches for counterparts at other wavelengths, with dramatic progress in the past few years. Thanks to the high angular resolution and sensitivity of Chandra and XMM-Newton, Sgr A* has been convincingly detected in the X-rays (Baganoff et al. 2001, 2003ab; Goldwurm et al. 2003; Porquet et al. 2003). The X-ray emission has two distinct components. In “quiescence,” the emission is soft and relatively steady, with a large fraction of the X-ray flux coming from an extended region with a diameter (Baganoff et al. 2001, 2003b). Several times a day, however, Sgr A* has X-ray “flares” in which the X-ray luminosity increases by a factor of a few – 50 for roughly an hour; the short timescale argues that the emission arises quite close to the BH, within (where is the Schwarzschild radius). The spectrum of the flares is somewhat uncertain and may be variable; for the strongest flare detected by Chandra, the spectrum is hard, with a photon index of (Baganoff et al. 2001). XMM, however, detected a very bright and soft flare, with a photon index of (Porquet et al. 2003).
At IR wavelengths, it has proven extremely difficult to detect Sgr A* because of contamination by dust and stellar confusion (e.g., Morris et al. 2001; Genzel et al. 1997; Stolovy et al. 1999; Hornstein et al. 2002). Recently, however, two groups have independently detected a highly variable IR source coincident with Sgr A* (Genzel et al. 2003; Ghez et al. 2003b). This breakthrough is primarily due to rapid advances in Adaptive Optics on Keck and the VLT. Genzel et al. (2003) detected Sgr A* at 1.6-3.8 m (not simultaneously), with a factor of variability on timescales of min. Similarly, at 3.8 m, Ghez et al. (2003b) found that the flux changes by a factor of 4 over a week, and a factor of 2 in just 40 min. They argue that the IR spectrum is extremely red, with a K-L color greater than 2.1 mag. The rapid variability of the IR emission argues that it arises from very close to the BH. Moreover, the comparable timescales for the IR and X-ray flares strongly suggests a common physical origin (though rapid IR variability may be more common than rapid X-ray variability, a point to which we will return in §3).
In a previous paper, we described a model for the observed emission from Sgr A* (Yuan, Quataert, & Narayan 2003; hereafter YQN03), based on the idea that accretion onto the central BH proceeds via a hot two-temperature radiatively inefficient accretion flow (RIAF; Narayan et al. 1995, 1998; see Narayan 2002, Quataert 2003 for reviews; and Melia 1992, Liu & Melia 2001, and Yuan, Markoff & Falcke 2002 for related ideas). In this model, as in that of Markoff et al. (2001), the observed flares are produced when electrons very close to the BH flow are accelerated to ultrarelativistic energies and emit synchrotron or synchrotron self-Compton radiation.111This model is preferred to one in which the flares arise from fluctuations in the density or accretion rate, because the latter overpredict the variability at radio frequencies (Markoff et al. 2001). In this paper, we investigate whether such a model can explain the recently detected IR emission from Sgr A*. We focus throughout on the RIAF model. An alternative possibility that can also account for the observations of Sgr A* is a coupled RIAF-jet model (Yuan, Markoff & Falcke 2002; Markoff et al. 2001; see also Falcke & Markoff 2000). More work is needed to distinguish these two possibilities.
2 RIAF Models for Sgr A*
As in YQN03, we model the dynamics of the accretion flow as a two-temperature RIAF. In this section we briefly summarize the ingredients in our models. The dynamical quantities describing the accreting plasma, such as the density and temperature, are obtained by solving a one dimensional global model of the accretion flow (see e.g., Yuan et al. 2000). Motivated by theoretical calculations and numerical simulations, we assume that the accretion rate is a function of radius, with (e.g., Blandford & Begelman 1999; Stone et al. 1999; Hawley & Balbus 2002; Igumenshchev et al. 2000, 2003). Here is the outer radius of the flow, i.e., the Bondi radius, is the accretion rate at (the Bondi accretion rate, fixed by Chandra observations of diffuse gas on scales; Baganoff et al. 2003b), and we fix as in YQNO3. The suppression of the accretion rate onto the central black hole by a factor is in good agreement with the high level of linear polarization detected at 230 GHz (e.g., Aitken et al. 2000; Bower et al. 2003), which puts an upper limit on the density of gas near the BH and thus the accretion rate onto the hole (Quataert & Gruzinov 2000; Agol 2000).
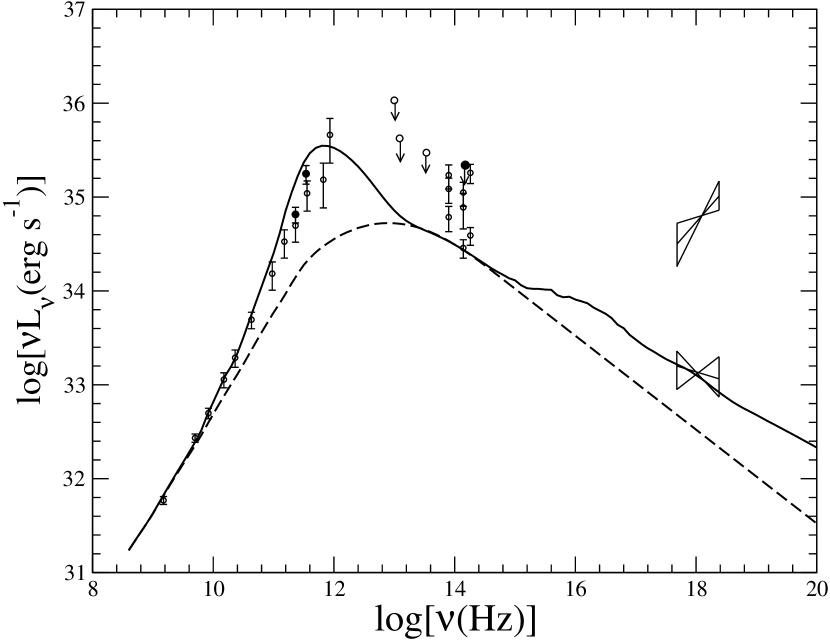
Electrons in the RIAF have a temperature K close to the BH, and produce significant emission in the radio by synchrotron radiation. In addition to this thermal population of electrons, we assume that processes such as turbulent acceleration, reconnection, and weak shocks accelerate some fraction of the electrons into a power-law tail (as is to be expected in a collisionless magnetized plasma). We characterize the nonthermal population by , the slope of the electron distribution function [ where is the Lorentz factor], and a parameter , the ratio of the energy in the power-law electrons to that in the thermal electrons. The nonthermal electrons emit synchrotron and SSC radiation from the radio to gamma-rays, depending on the values of and . In YQNO3, we favored and for “quiescent” non-flaring epochs, so as not to violate what were then IR limits on the emission from Sgr A*. The solid line in Fig. 1 shows a slight variant of this quiescent model with : the IR flux is now comparable to the lowest flux levels seen in the recent observations of Genzel et al. (2003) and Ghez et al. (2003b), while the nonthermal synchrotron emission in the X-rays (dashed line) has a flux somewhat below that of thermal bremsstrahlung from large radii in the RIAF (the latter produces the extended source observed most of the time by Chandra; e.g., Quataert 2002).
3 Variable IR and X-ray Emission from Accelerated Electrons
The emission produced by the nonthermal electrons depends sensitively on the uncertain electron distribution function, parameterized by and (defined earlier), as well as the maximum Lorentz factor of the nonthermal electrons, . In addition, the relative importance of different acceleration mechanisms may be time variable, which would result in highly time variable nonthermal emission. A useful analogue may be solar flares, in which the amount of energy in suprathermal electrons differs by several orders of magnitude from flare to flare (see, e.g., Fig. 3 of Miller et al. 1997). In the following, we investigate how accelerated electrons close to the BH can account for the recently detected variable IR emission from Sgr A*, and how such IR emission is related to the X-ray flares. We also stress how relatively modest changes in the electron distribution function can produce a wide range of variability amplitudes and spectra in the IR and X-ray.
3.1 Synchrotron self-Compton (SSC) models
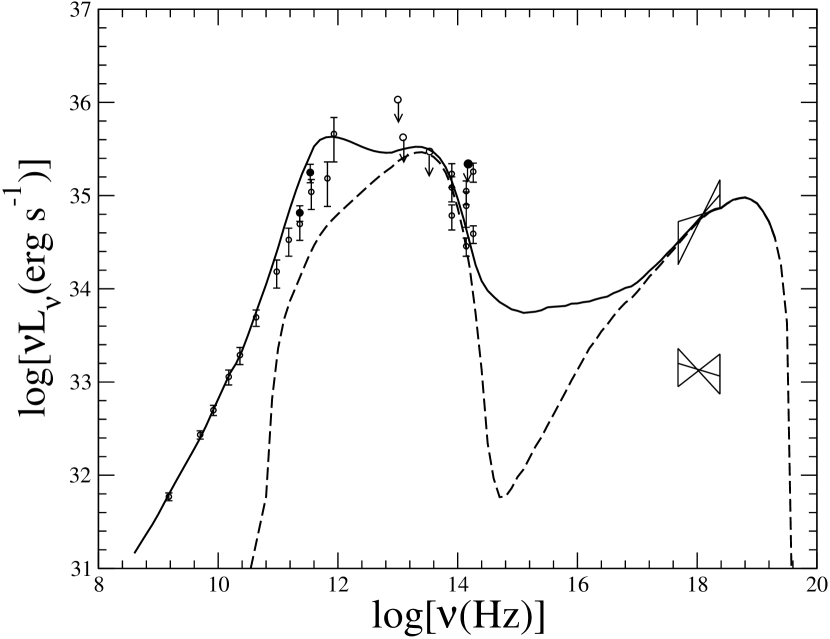
In YQN03, we showed that if a large fraction of the electrons () are accelerated into a power-law tail with , the accelerated electrons will Compton-scatter synchrotron photons into the Chandra band, producing an X-ray flare. We explored two such synchrotron self-Compton (SSC) models with different values of the electron energy index: and . In both models, we predicted that there should be a significant flare in the IR correlated with the X-ray flare (see Figs. 7a,b in YQN03). Fig. 2 of the present paper shows our model as compared with the recent IR detections. Because of the extreme variability that is observed, and the lack of simultaneous X-ray and IR detections, we do not attempt to distinguish rigorously between a “quiescent” and “flaring” IR source at this point, though the smallest and largest IR fluxes detected should be a useful guide. In addition, because there are no simultaneous IR observations in several bands, we do not compare our predicted IR spectra with the observations (see Ghez et al. 2003 and Genzel et al. 2003 for possible constraints on spectra with non-simultaneous observations).
As Fig. 2 shows, the predicted IR emission in the SSC model is in good agreement with observations of the Galactic Center. The difficulty with this model, however, is the rather extreme requirement that , i.e., nearly all of the electron energy should reside in a very hard power-law tail. There is also no well-motivated reason for , as is required to avoid significantly overproducing the IR flux (since acceleration mechanisms such as reconnection, turbulence, or shocks could readily accelerate electrons to much higher energies). For these reasons, it is worth exploring models which relax the above assumptions on and . The nonthermal X-ray emission must then be due to synchrotron radiation, not SSC, and so we refer to such models as “synchrotron” models.
3.2 Synchrotron models
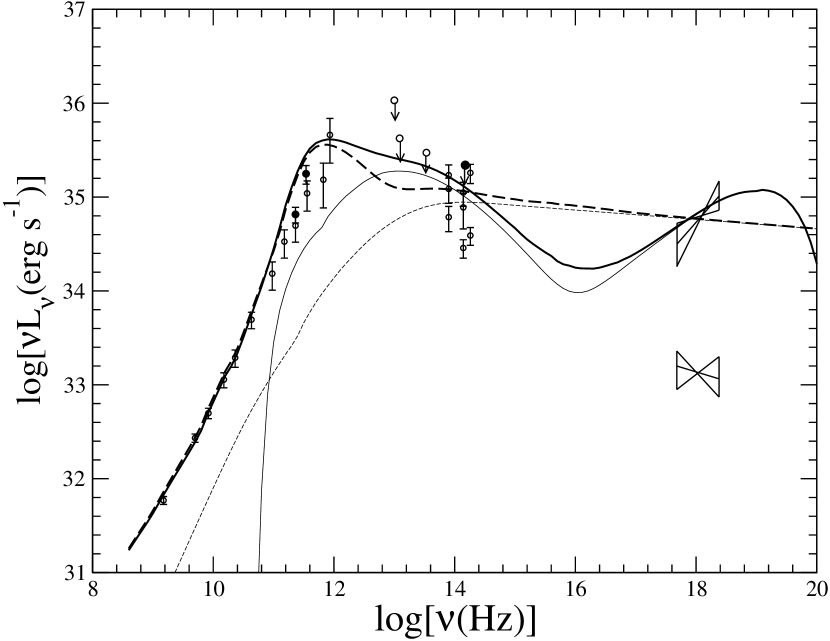
In the synchrotron model for X-ray flares described in YQN03, we assumed that in the inner of the accretion flow a small fraction of electrons are accelerated into a hard power-law tail with or larger. The synchrotron emission from such high energy electrons accounts for the observed X-ray flares. The specific models considered in YQN03 modeled the distribution of accelerated electrons as a single power-law with . In this case the flare contains too few electrons with to produce significant IR flux via synchrotron emission; therefore, the model does not produce an IR flare (see, e.g., Fig. 6 of YQN03). The dashed lines in Fig. 3 show, however, that a model in which the accelerated electrons have and can produce an IR flux consistent with the observations, while at the same time producing an X-ray flux similar to that observed during flares by Chandra and XMM. This model has the advantage of theoretical economy: the same population of power-law electrons produces both the IR and X-ray flares. One problem, however, is that the predicted X-ray spectrum () is too soft to be consistent with the X-ray flares observed by Chandra.
Thus, if we wish to fit the IR flux, the X-ray flux, and the spectra of flares with a synchrotron model, it appears that a single power-law distribution of accelerated electrons is ruled out and a two-component distribution is favored. In fact, such a two-component distribution is expected theoretically from the physics of particle acceleration, either in shocks or via magnetic reconnection. For example, models of nonlinear shock acceleration (which account for the back reaction of the accelerated particles on the shock structure) typically predict that the spectral index of accelerated particles increases (“hardens”) with increasing energy (e.g., Ellison et al. 2000); as discussed below, this kind of hardening is what we need to account for the observations of Sgr A*. More generally, although the physics of particle acceleration in the accretion flow context is not that well understood, it is nevertheless quite likely that, while some particles are accelerated into a hard power-law distribution, many more particles are heated to a roughly thermal distribution (see the discussion and references in §5 of YQN03). There is observational support for this result both for shock acceleration (e.g., from the study of SNR shocks; see McKee & Hollenbach 1980; Vink 2003) and magnetic reconnection (from the study of solar flares; see Priest & Forbes 2000; Lin & Johns 1993). Many details remain unclear but current results seem to indicate that the energy distribution of the power-law electrons is harder in the case of magnetic reconnection compared to shock acceleration. Since we need a very hard distribution (, see below), we feel that reconnection is a more likely explanation for the flares in Sgr A*.
For convenience, we model the lower energy (“heated”) electrons in the flare by means of a steep power-law (). We have also calculated models in which the heated electrons are described by a thermal distribution with a higher temperature than the bulk of the electrons, and we obtain similar results. This is because the precise form of the energy distribution for the low-energy electrons is not that well constrained without detailed IR spectra; current observations require only that an appropriate number of electrons with IR-emitting Lorentz factors should be present. In contrast, the distribution of the high-energy power-law electrons is more important since it directly determines the spectral index of the flare radiation in the X-ray band.
Motivated by these considerations, we assume that, episodically, some fraction of electrons at are accelerated into the following “broken” power-law distribution,
| (1a) | |||
| (1b) |
The above prescription refers to the injected distribution. For the steady distribution of electrons, the power-law will become steeper above a cooling break at . We calculate the values of and self-consistently at each radius as described in YQN03. For the reasons explained above, we adopt and ; the former corresponds roughly to the inferred slope from the quiescent emission while the latter corresponds to that inferred from the hard X-ray flares. To determine the break between these two distributions, which occurs at , we define to be the ratio of the energy in electrons with to those with . Since the electrons with relatively small (large) are responsible for the IR (X-ray) radiation, is essentially the ratio of the energy in IR and X-ray emitting electrons.
The solid lines in Fig. 3 show the spectrum from such a population of electrons for , , and (comparable energy in IR and X-ray emitting electrons). This corresponds to and in the region . Although the power-law electrons have of the electron thermal energy, the total fraction of the electrons accelerated is only , while the ratio of electrons with to those with is . The total number density of electrons in this region is cm-3 and the strength of the magnetic field is G. The thin solid line in Fig. 3 shows the flaring synchrotron emission from the “broken” power-law electrons while the thick solid line shows the sum of the flaring emission and the quiescent radiation. We see that the model produces a large IR flux comparable to that observed, as well as a hard X-ray flare similar to that seen by Chandra.
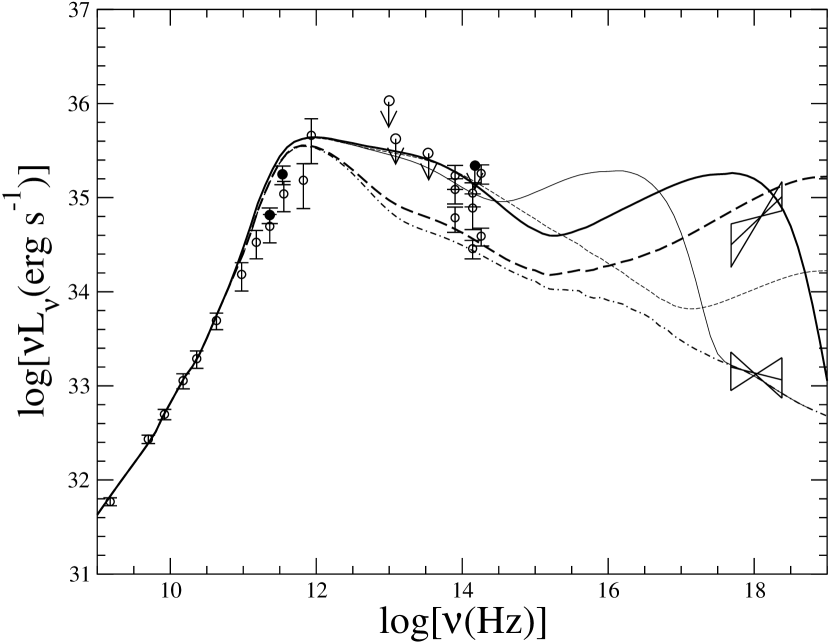
Because the physics of electron acceleration in the collisionless magnetized plasma close to the BH remains poorly understood it is interesting to assess how the predicted spectrum changes when some of our assumptions are varied. This is shown in Fig. 4. The thin and thick dashed lines show the results of changing the relative energy in IR and X-ray emitting electrons: (thick dashed, X-ray dominated) and (thin dashed, IR dominated). In the case, there is a prominent X-ray flare with little change in the IR emission, while for , the X-ray flare is much less prominent (and would in fact disappear entirely for ). In general, X-ray flares are predicted to have much larger amplitudes than IR flares, in part because the baseline “quiescent” flux is substantially smaller in X-rays. This trend is consistent with current observations.
Fig. 4 also explores the effects of changing . The thick solid line shows the spectrum when is 5 times smaller than in Fig. 3, namely . In this case the peak of the synchrotron emission is in the X-ray band. Such a spectrum could account for the bright soft X-ray flare detected by XMM (Porquet et al. 2003). The thin solid line shows the result of further decreasing to . In this case, there is still a large increase in IR flux, but there is no X-ray flare because the peak of the synchrotron emission occurs well below the X-ray band. This possibility, namely that it is easier to accelerate low energy electrons that emit in the IR, could account for the fact that significant IR variability appears more common than significant X-ray variability (§1).
4 Summary and Discussion
Recent observations have convincingly detected IR emission from Sgr A*, the supermassive black hole in the Galactic Center. The emission is highly variable, with order unity changes on timescales min, comparable to the orbital period of matter near the last stable orbit around the BH. The amplitude of the IR variability is , smaller than that of the X-ray flares observed by Chandra and XMM. The timescales are, however, quite comparable, strongly suggesting that the IR and X-ray emission arise from the same physical location. In YQN03 we presented flare models based on the SSC mechanism that predict roughly the right flux in both the IR and X-ray bands (see Fig. 2). In this paper, we have explored in more detail an alternative model in which synchrotron emission from electrons accelerated in the accretion flow close to the BH account for the variable IR and X-ray emission (Fig. 3). In order to fit both the IR and X-ray observations, we assume that the accelerated electrons are in a broken power-law distribution, with a hardening of the power law at high energies. We discuss possible physical origins for such a distribution in §3.2. In all of our models, the IR emission is produced by the synchrotron process and is predicted to be significantly polarized. This finds support in the high level of linear polarization detected in one observation by Genzel et al. (The IR flux was relatively low during this epoch so they identified it as “quiescence”). It is worth noting that Rees et al. (1982), in their original ion-torus model, proposed that the prominence of nonthermal emission would be a signature of two-temperature collisionless accretion flows; we suggest that this prediction has been borne out by the recent observations of the Galactic Center.
We have also explored in Fig. 4 the range of IR and X-ray spectra expected as a result of flare-to-flare variations in the distribution function of accelerated electrons (as is observed in, e.g., solar flares). We suggest that such variations can account for the wide range, both in flux and spectra, of IR and X-ray emission from Sgr A*. Our calculated models make several predictions: (i) X-ray and IR flares should often be correlated, but need not always be (see Fig. 4). (ii) X-ray flares, when present, should have larger amplitudes than the corresponding IR flares. (iii) The spectral slopes of X-ray flares can differ significantly, whereas the slopes of IR flares should, at least within our simple models, differ less. (iv) X-ray and IR flares should be accompanied by only small amplitude variability in the radio and sub-mm (because of the damping effect of the thermal electrons; see Özel, Psaltis & Narayan 2000). In fact, these predictions are probably generic to many nonthermal models (e.g., even if the acceleration is in a jet rather than the accretion flow). In this connection, a distinction should be made between the short time scale flares, which we identify with localized acceleration of nonthermal electrons, and longer time scale variability which may be caused by variations in the temperature, density and magnetic field strength close to the BH. The latter variations will cause modest amplitude variability in all bands, including radio/submm, but on longer time scales.
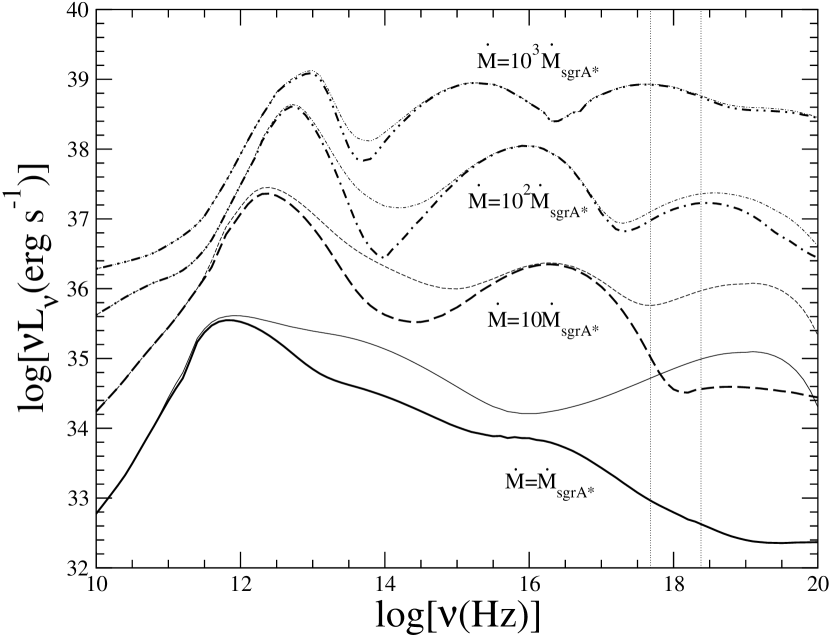
The remarkable detection of short-timescale variability in the IR and X-ray emission from the Galactic Center raises the important question of why such flares have not been detected from other systems, given the plausible hypothesis that most low-luminosity AGN accrete via a RIAF (Narayan 2002; Quataert 2003). One factor is certainly the large amount of observing time dedicated to Sgr A*, but this may not be the only explanation. To assess this issue, Fig. 5 shows the quiescent (thick lines) and flaring (thin lines) spectra for accretion rates 10, 100, and 1000 times that of Sgr A*. In each calculation, we assume that the basic accretion flow parameters and electron distribution function (, , , etc.) are the same as they are in our synchrotron model of Sgr A* (Fig. 3), except that the accretion rate onto the BH is larger. This assumes that the basic acceleration physics is independent of (e.g., density), which may not be correct but is a useful “straw-man” model. The results of Fig. 5 show that for more luminous systems the flaring emission becomes much more difficult to observe. If we scale to Eddington units ( for Sgr A*), the flares become difficult to detect for because they are swamped by the larger quiescent emission. The physical reason is that thermal SSC emission becomes much more important than nonthermal emission as the accretion rate increases. This emission would undoubtedly be variable because of fluctuations in, e.g., , but the resulting variations in flux would likely only be of order unity. As a result, we expect that dramatic flaring analogous to that seen in Sgr A* will be restricted to very low-luminosity systems () where the nonthermal emission can dominate the thermal SSC emission.
To be more concrete, we point out several systems where the results of Fig. 4 suggest that flaring may be detectable. This discussion is not exhaustive, but highlights some of the relevant issues in searching for variability analogous to that seen in Sgr A*. One possibility is M84, which has two reported nuclear X-ray luminosities: ergs s-1 (Ho et al. 2001) and ergs s-1 (Finoguenov & Jones 2001).222M84 has an X-ray emitting jet so it is not clear whether this emission arises from the direct vicinity of the black hole. These correspond to for the black hole in this system. One complication is that the relevant dynamical times close to a BH scale linearly with black hole mass. Hour-long flares once per day in Sgr A* thus correspond to flare per year for , with a duration of 1-2 weeks. It is unlikely (few % probability) that a random observation would see such flares. A sample of comparable mass systems observed several times over the course of a year could, however, detect flare. A more promising candidate is M32, where Ho et al. (2003) found a ergs s-1 X-ray source coincident with the black hole. This X-ray luminosity corresponds to , implying that M32 may show X-ray flares according to our analysis. The timescales are expected to be similar to those in Sgr A* since the black hole masses are similar. Finally, if we consider the other extreme of low-luminosity X-ray binaries, a possible candidate for the detection of X-ray flares would be XTE J1118+480, or its twin A0620–00. Chandra observations show that (McClintock et al. 2003). The flare duration in this source would, however, be 0.01 second, and the flux only . Unfortunately, it is not currently possible to detect such short duration flares from these very faint X-ray binaries. We thus conclude that very low-luminosity AGN with black hole masses comparable to or even somewhat smaller than that of Sgr A* are the most promising sources to search for rapid large-amplitude variability analogous to that seen in the Galactic Center.
References
- (1) Agol, E. 2000, ApJ, 538, L121
- (2) Aitken, D.K., Greaves, J.S., Chyrsostomou, A. et al., 2000, ApJ, 534, L173
- (3) Baganoff, F. K. 2003a, to be published in Astron. Nachr., Vol. 324, No. S1 (2003), Special Supplement “The central 300 parsecs of the Milky Way”, Eds. A. Cotera, H. Falcke, T. R. Geballe, S. Markoff
- (4) Baganoff, F. K., Bautz, M. W., Brandt, W. N. et al., 2001, Nature, 413, 45
- (5) Baganoff, F. K., Maeda, Y., Morris, M. et al., 2003b, ApJ, 591, 891
- (6) Blandford, R.D., & Begelman, M.C. 1999, MNRAS, 303, L1
- (7) Bower, G.C. et al. 2003, ApJ, 588, 331
- (8) Ellison, D. C., Berezhko, E. G., & Baring, M. G., 2000, ApJ, 540, 292
- (9) Falcke, H., Goss, W. M., Matsuo, H., Teuben, P., Zhao, J. H., & Zylka, R., 1998, ApJ, 499, 731
- (10) Falcke, H., Markoff, S. 2000, A&A, 362, 113
- (11) Finoguenov, A. & Jones, C., 2001, ApJ, 547, L107
- (12) Genzel. R. et al. 2003, Nature, 425, 934
- (13) Genzel, R., Eckart, A., Ott, T., & Eisenhauer, F. 1997, MNRAS, 291, 219
- (14) Ghez, A. M., et al. 2003a, ApJ, 586, L127
- (15) Ghez, A.M., Wright, S.A., Mattews K. et al. 2003b, submitted to ApJ(astro-ph/0309076)
- (16) Goldwurm A., Brion, E., Goldoni, P. et al. 2003, ApJ, 584, 751
- (17) Hawley, J. F., & Balbus, S. A. 2002, ApJ, 573, 738
- (18) Ho, L. C. et al., 2001, ApJ, 549, L51
- (19) Ho, L. C., Terashima, Y., & Ulvestad, J. S., 2003, ApJ, 589, 783
- (20) Hornstein, S.D., Ghez, A. M., Tanner, A. et al. 2002, ApJ, 577, L9
- (21) Igumenshchev, I. V., Abramowicz, M. A., & Narayan, R. 2000, ApJ, 537, L27
- (22) Igumenshchev, I. V., Narayan, R., & Abramowicz, M. A. 2003, ApJ, 592, 1042
- (23) Lin, R.P. & Johns, C.M., 1993, ApJ, 417, L53
- (24) Liu, S. & Melia, F. 2001, ApJ, 561, L77
- (25) Markoff, S., Falcke, H., Yuan, F., & Biermann, P. 2001, A&A, 379, L13
- (26) McClintock, J. et al. 2003, ApJ, 593, 435
- (27) McKee, C.F., & Hollenbach, D.J. 1980, ARA&A, 18, 219
- (28) Melia, F. 1992, ApJ, 387, L25
- (29) Melia, F., & Falcke, H. 2001, ARA&A, 39, 309
- (30) Miller, J. et al., 1997, JGR, 102, 14631
- (31) Morris, M., Tanner, A. M., Ghez, A. M., et al. 2001, BAAS, 198, 410
- (32) Narayan, R. 2002, in “Lighthouses of the Universe” eds. M. Gilfanov, R. Sunyaev, E. Churazov, Springer-Verlag; p405
- (33) Narayan, R., Mahadevan, R., Grindlay, J.E., Popham, R. & Gammie, C., 1998, ApJ, 492, 554
- (34) Narayan, R., Yi, I., & Mahadevan, R., 1995, Nature, 374, 623
- (35) Özel, F., Psaltis, D., & Narayan, R. 2000, ApJ, 541, 234
- (36) Porquet, D., Predehl, P., Aschenback, B., et al. 2003, A&A, 407, L17
- (37) Priest, E. & Forbes T. 2000, Magnetic Reconnection: MHD Theory and Applications (Cambridge: Cambridge Univ. Press)
- (38) Quataert, E. 2002, ApJ, 575, 855
- (39) Quataert, E. 2003, Astron. Nachr., 324, in press (astro-ph/0304099)
- (40) Quataert, E. & Gruzinov 2000, ApJ, 545, 842
- (41) Rees, M. J., Phinney, E. S., Begelman, M. C., & Blandford, R. D. 1982, Nature, 295, 17
- (42) Schödel, R. et al. 2002, Nature, 419, 694
- (43) Serabyn, E., Carlstrom, J., Lay, O. et al., 1997, ApJ, 490, L77
- (44) Stolovy, S. R., McCarthy, D. W., Melia, F., Rieke, G., Rieke, M. J., & Yusef-Zadeh, F. 1999, “The Central Parsecs of the Galaxy,” ASP Conf, eds. Falcke et al., 186, 39
- (45) Stone, J., Pringle, J., & Begelman, M. 1999, MNRAS, 310, 1002
- (46) Vink, J. 2003, to appear in ”High Energy Studies of Supernova Remnants and Neutron Stars” (COSPAR 2002), Eds. W. Hermsen, W. Becker, Advances in Space Research, in press (astro-ph/0304176)
- (47) Yuan, F., Markoff, S., & Falcke, H., 2002, A&A, 383, 854
- (48) Yuan, F., Peng, Q., Lu, J., & Wang, J. 2000, ApJ, 537, 236
- (49) Yuan, F., Quataert, E., & Narayan, R. 2003, ApJ, 598, 301 (YQN03)
- (50) Zhao, J.-H., et al. 2003, ApJ, 586, L29