The 2dF Galaxy Redshift Survey: Hierarchical galaxy clustering
Abstract
We use the two-degree field Galaxy Redshift Survey (2dFGRS) to test the hierarchical scaling hypothesis: namely, that the -point galaxy correlation functions can be written in terms of the two point correlation function or variance. This scaling is expected if an initially Gaussian distribution of density fluctuations evolves under the action of gravitational instability. We measure the volume averaged -point correlation functions using a counts in cells technique applied to a volume limited sample of 44,931 galaxies. We demonstrate that galaxies display hierarchical clustering up to order in redshift space. The variance measured for galaxies is in excellent agreement with the predictions from a -cold dark matter N-body simulation. This applies to all cell radii considered, . However, the higher order correlation functions of galaxies have a significantly smaller amplitude than is predicted for the dark matter for Mpc. This disagreement implies that a non-linear bias exists between the dark matter and galaxies on these scales. We also show that the presence of two rare, massive superclusters in the 2dFGRS has an impact on the higher-order clustering moments measured on large scales.
keywords:
cosmology: observations, large-scale structure of Universe1 Introduction
Current theoretical models of structure formation in the Universe are based on the paradigm of gravitational instability. This process is believed to be responsible for driving the growth of small primordial density perturbations into the nonlinear collapsed structures such as galaxies and clusters that are evident in the Universe today.
The premise of gravitational instability has been tested indirectly by comparing the clustering predicted by numerical simulations of the formation of cosmic structures with the observed distribution of galaxies (e.g. Benson et al. 2001). A direct test of this fundamental ingredient of structure formation models was made using the 2dFGRS by Peacock et al. (2001). The size of the 2dFGRS allowed the first accurate measurement of the two-point galaxy correlation function on large scales. Peacock et al. demonstrated that the two-point correlation function at large pair separations displays a form that is characteristic of the bulk motions of galaxies expected in the gravitational instability scenario.
We present an independent test of the gravitational instability paradigm. For a Gaussian distribution of density fluctuations, the volume averaged correlation functions, , are identically zero for ; the density field is completely described by its variance, . The evolution of an initially Gaussian density field due to gravitational instability generates non-zero (Peebles 1980). A basic test of the gravitational origin of the higher order moments is to determine their relation to the variance of the distribution. This is traditionally encapsulated in the hierarchical model:
| (1) |
This model applies to real space clustering; however, in redshift space the scaling still tends to hold even on small scales where the “fingers-of-God” effect is prominent (Lahav et al. 1993; Hoyle, Szapudi & Baugh 2000). Perturbation theory predicts that the hierarchical amplitudes for the mass distribution are independent of the cosmological density parameter, the cosmological constant and cosmic epoch (Bernardeau et al. 2002).
We use the 2dFGRS (Colless et al. 2001, 2003) to measure the higher order correlation functions of the galaxy distribution, focusing on the clustering of galaxies. The size of the 2dFGRS is exploited to extract a volume limited sample of galaxies, which greatly simplifies our analysis (Section 2). The results for the volume averaged correlation functions, up to sixth order, are presented in Section 3, in which we also test how well the hierarchical scaling model works. Our conclusions are given in Section 4.
2 Data and analysis
The density of galaxies is a strong function of radial distance in a magnitude limited survey. This needs to be compensated for in any clustering analysis by applying a suitable weighting scheme (e.g. Saunders et al. 1991). Alternatively, one may construct a volume limited sample by selecting certain galaxies from the full redshift survey. These galaxies are chosen so that they would appear inside the apparent magnitude range of the survey if displaced to any redshift within the interval defining the sample. The only radial variation in galaxy number density in a volume limited sample is due to large scale structure in the galaxy distribution. This makes volume limited samples much more straightforward to analyse than flux limited samples. However, only a fraction of the galaxies from the full redshift survey satisfy the selection criteria in redshift and absolute magnitude. This reduction in the density of galaxies has curtailed the utility of volume limited subsamples constructed from earlier redshift surveys.
We construct a volume limited sample of galaxies from the 2dFGRS. The motivation for the choice of a sample centred on is clear; this results in a volume limited sample with the largest possible number of galaxies for magnitude bins of a given size. As the luminosity used to define a sample increases, the selected galaxies can be seen out to larger redshifts and thus sample larger volumes. However, brighter than , the space density of galaxies drops exponentially (e.g. Norberg et al. 2002). Hence, the optimum balance between volume surveyed and intrinsic galaxy space density is achieved for galaxies. In addition, the higher order clustering of galaxies provides a benchmark or reference against which to compare trends in clustering strength with galaxy luminosity (see Norberg et al 2001; Croton et al. 2004a). We consider the two contiguous areas of the 2dFGRS, referred to as the NGP and SGP regions, which contain around 190,000 galaxies with redshifts and cover an effective area of approximately 1200 square degrees in total. After selecting galaxies with absolute magnitudes in the range (corrected to using the global correction quoted by Norberg et al. 2002), the volume limited sample contains 44,931 galaxies. The redshift interval of the sample is to , corresponding to a volume of for the combined NGP and SGP regions.
2.1 Counts in cells analysis
The distribution of counts in cells is estimated by throwing down a large number of spherical cells, on the order of for each cell radius considered, within the volume limited 2dFGRS sample. Full details of how we deal with the spectroscopic incompleteness and the angular mask are given in Croton et al. (2004a); the corrections turn out to be small in any case (see figure 1 of Croton et al.).
The higher order correlation functions, , are the reduced order moments of the distribution of galaxy counts in cells. The estimation of the higher order correlation functions from the cell count probability distribution is explained in a number of papers (e.g. Gaztañaga 1994; Baugh, Gaztañaga & Efstathiou 1995; Croton et al. 2004a). The variance or width of the count distribution is given by the case . For , the correlation functions probe further out into the tail of the count probability distribution.
We use mock 2dFGRS catalogues to estimate the errors on the measured higher order correlation functions. Full details of the mocks can be found in Norberg et al. (2002) and Croton et al. (2004a).
3 Results
The projected density of galaxies in the volume limited sample is shown in Fig. 1. The galaxy density projected onto the right ascension–redshift plane is smoothed using circular windows. Two different smoothing radii have been used to produce these maps; the left-hand panel shows the density after smoothing with a circular cell of radius Mpc and the right hand panel shows the distribution as sampled with a cell of radius Mpc. The redder colours indicate higher galaxy densities, as shown by the scale that accompanies each cone plot. Two ‘hot-spots’ are readily apparent, particularly in the cone plot smoothed on the larger scale. These correspond to superclusters of galaxies that also appear in the 2dFGRS Percolation Inferred Galaxy Group catalogue (Eke et al. 2004) and in the reconstructed density field of the 2dFGRS (Erdogdu et al. 2004). The presence of these superclusters has an impact on the extreme event tail of the count probability distribution. Later in this section, we will investigate the influence of these structures on our measurement of the higher order correlation functions by excising the volumes that contain the superclusters from our analysis. The ‘cosmic web’ of filamentary structures and voids is apparent in the cone smoothed on the smaller scale.
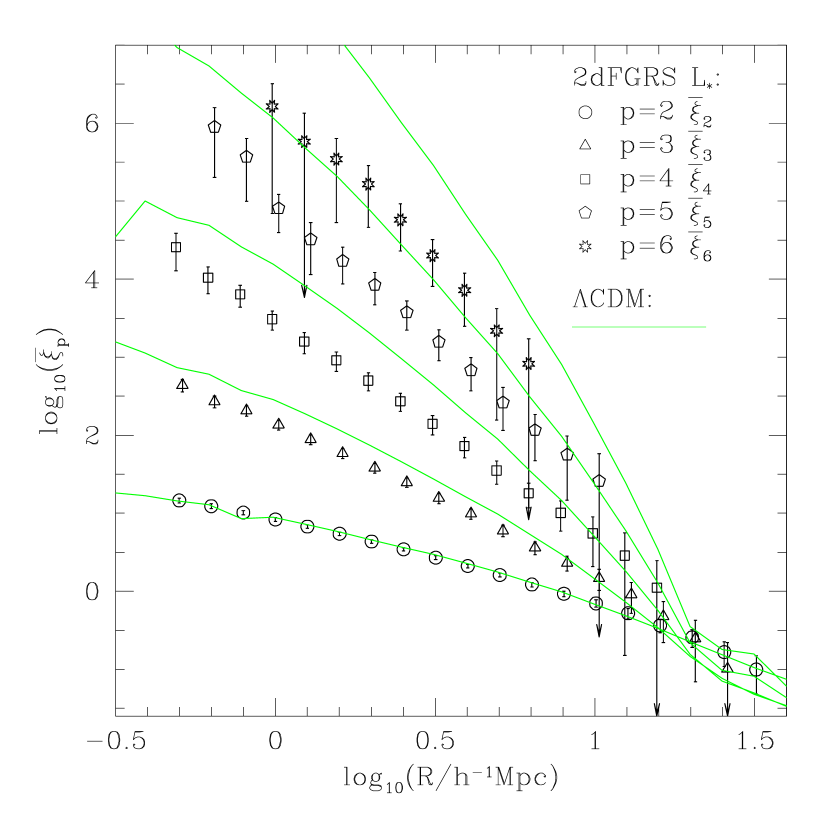
The higher order correlation functions measured for galaxies are plotted in Fig. 2. The correlation functions are only plotted on scales for which a robust measurement is possible. The correlation functions show a dramatic steepening on small scales as the order increases. For example, the ratio is at Mpc, falling to at Mpc. We also plot the higher order correlation functions for the dark matter distribution in the CDM Hubble Volume simulation (Evrard et al. 2002). These theoretical predictions include the effects of peculiar motions in the distant observer approximation. The variance of the dark matter in redshift space agrees spectacularly well with the measured for galaxies. This confirms the conclusions reached in independent analyses of the clustering of galaxies in the 2dFGRS (Lahav et al. 2002; Verde et al. 2002). However, for the case of the CDM Hubble Volume simulation, the moments of the dark matter differ from the measurements for galaxies for Mpc.
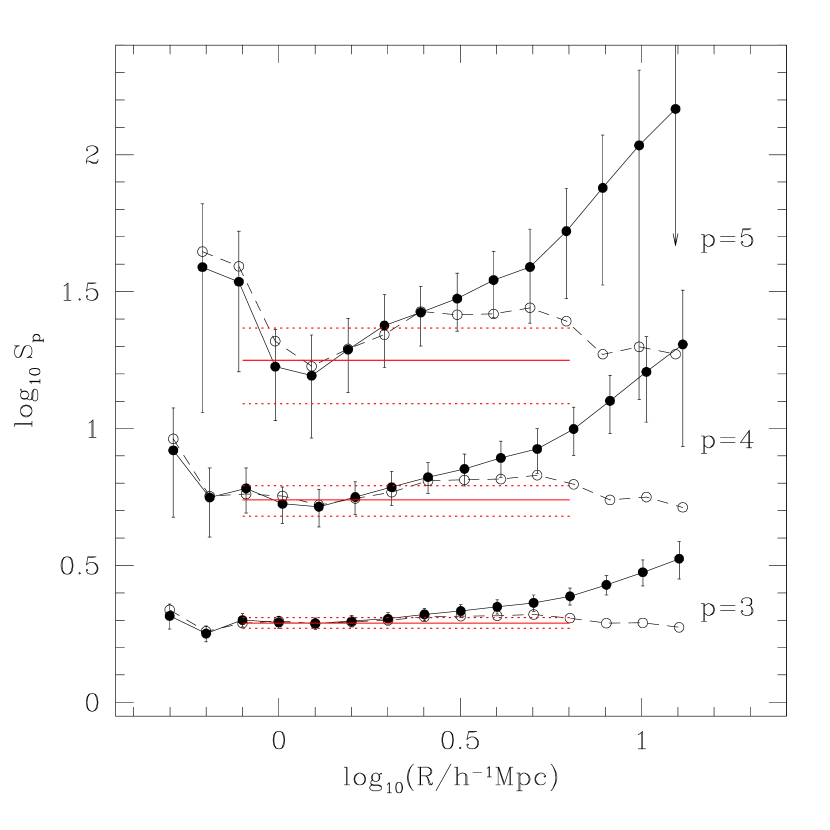
The hierarchical amplitudes, , obtained from the by applying Eq. 1 are plotted as a function of cell radius for orders – in Fig. 3 ( is omitted for clarity). For , is approximately constant for cells with Mpc. At larger , increases with radius. This behaviour is mirrored for , with the upturn in seen at progressively smaller radii as increases. Perturbation theory predicts that, on large scales, the should have only a weak dependence on scale for CDM-like power spectra (Juszkiewicz, Bouchet & Colombi 1993). In redshift space, the hierarchical amplitudes are expected to be approximately independent of scale over an even wider range of scales than those on which perturbation theory is applicable (Hoyle et al. 2000; Bernardeau et al. 2004). We therefore attempt to fit a constant value of to the ratios plotted in Fig. 3. We use a principal component analysis to take into account the correlation between the in neighbouring bins (e.g. Porciani & Givalisco 2002; for further details of our implementation see Croton et al. 2004a). The results of this analysis are given in Table 1. In Fig. 3, the horizontal lines show the best fit constant value for , fitted over the scales . The same range of scales is used to fit the for each order . (The choice of scales is set by the cell radii for which a reliable measurement of is possible.) The dotted lines indicate the uncertainty on the fit. The errorbars plotted in Fig. 3 show only the diagonal component of the full covariance matrix. The amplitudes are extremely correlated, with the principal component analysis showing that the first few eigenvectors contain the bulk of the variance, indicating that there are typically just 2 or 3 independent points. Sample variance leads to measurements which could be coherently shifted either low or high with respect to a fixed value. This therefore drives the best fit value of to lie either below or above a sizeable fraction of the data points. For the sample, we note that neither nor are particularly well described by a constant fit (see the reduced values in Table 1).
For purely illustrative purposes, we have carried out the experiment of removing the two superclusters from the volume limited sample and repeating our measurement of the higher order correlation functions. The corresponding results for the hierarchical amplitudes are plotted using open symbols in Fig. 3. The upturn in the values at large radii is no longer apparent. Rather than being considered as a correction, the results of this exercise simply serve to show the influence of the supercluster regions on our measurements of the . Where the difference matters, it effectively indicates that the volume of even the 2dFGRS is too small to yield a robust higher-order clustering measurement. A further discussion of this test is given by Croton et al. (2004a).
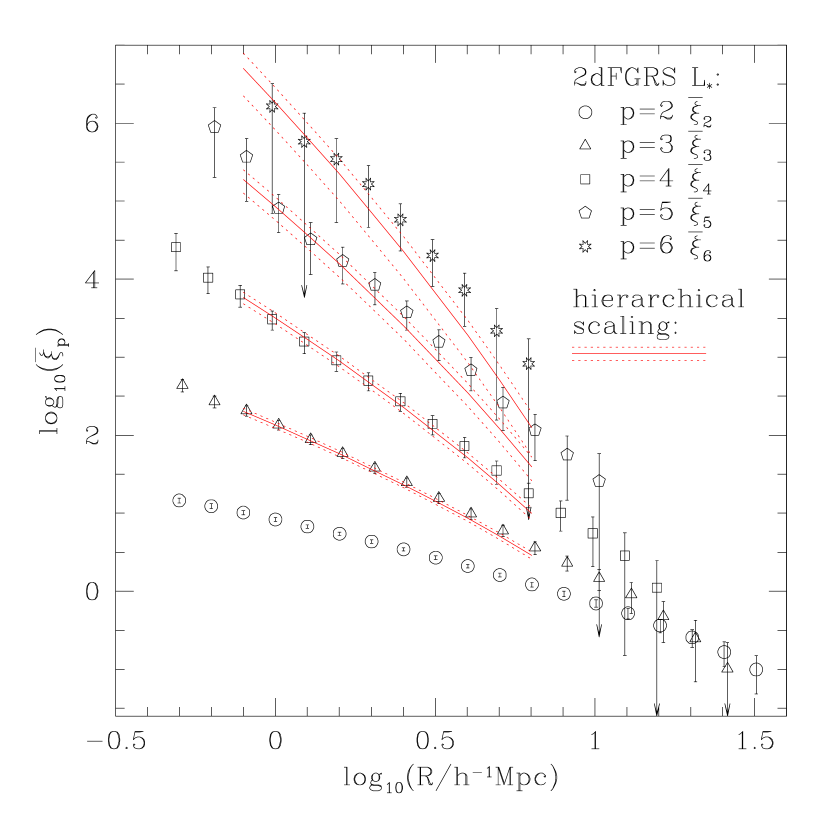
Armed with the best fit values of , the hierarchical model stated in Eq. 1 can be used to make predictions for the form of the higher order correlation functions and compare these with the measurements from the 2dFGRS galaxy sample (symbols in Fig. 4, reproduced from Fig. 2). The solid lines in Fig. 4 show the predicted from the hierarchical scaling relation (Eq. 1), assuming a constant value for the hierarchical amplitudes, , and using the measured variance, . The dotted lines show the uncertainty in the theoretical predictions, derived from the 1 error in the fitted values of the and the error on the measured variance, . The theoretical predictions for the different orders agree spectacularly well with the measured higher order correlation functions over the range of scales for which the are fitted.
| order | |||
|---|---|---|---|
| 3 | 1.95 | 0.18 | 6.1 |
| 4 | 5.50 | 1.43 | 2.8 |
| 5 | 17.8 | 10.5 | 1.9 |
| 6 | 46.3 | 50 | 1.1 |
4 Conclusions
We have measured the higher order correlation functions of galaxies up to sixth order in the 2dFGRS. Previous studies of galaxy clustering in redshift space have been limited to fourth order (e.g. for optically selected samples: Gaztañaga 1992; Benoist et al. 1999; Hoyle et al. 2000: for infra-red selected samples: Bouchet et al. 1993; Szapudi et al. 2000). The volume limited sample of galaxies analysed here contains 100 times more galaxies and covers 10 times the volume of the previous best measurements from an optically selected galaxy redshift survey (Hoyle et al. 2000). The measured correlation functions have a form that is in remarkably good agreement with the predictions of hierarchical scaling, and extend to smaller scales than those for which the perturbation theory predictions are expected to be valid (Bernardeau et al. 2002). A similar conclusion was reached by Croton et al. (2004b), who found hierarchical scaling in the reduced void probability function measured in the 2dFGRS.
On scales larger than about Mpc, there is an upturn in the values of , which we have demonstrated is influenced by the presence of two large superclusters in the 2dFGRS (see Fig. 3). This suggests that finite sampling affects our measurements on these scales. A similar feature was found in the angular Edinburgh-Durham Southern Galaxy Catalogue (EDSGC). Szapudi & Gaztañaga (1998) found that the projected measured from the EDSGC displayed an up-turn for scales larger than degrees, which corresponds to Mpc at the characteristic depth of the survey. The EDSGC covers a similar part of the sky to the 2dFGRS. This feature in was not found, however, in the APM Survey, which covers a four times larger solid angle than the EDSGC (Gaztañaga 1994). This behaviour is not seen in the mock catalogues drawn from the CDM Hubble Volume simulation. Intriguingly, an upturn in the hierarchical amplitudes on large scales is expected in structure formation models with non-Gaussian initial density fields (Gaztañaga & Fosalba 1998; Bernardeau et al. 2002).
Finally, we note that the variance of the distribution of cell counts for galaxies is in excellent agreement with the predictions for CDM, obtained from the Hubble Volume CDM simulation, which includes the effects of peculiar motions on the clustering pattern. However, for cells with radii Mpc the higher order correlation functions of galaxies have significantly lower amplitudes than the dark matter. This implies that the relation between the distribution of galaxies and the underlying dark matter may be more complicated than the popular linear bias model, suggesting that nonlinear contributions to the bias may be important on small and intermediate scales (Fry & Gaztañaga 1993; see also the analyses by Conway et al. 2004 and Wild et al. 2004). We note that on large scales (Mpc), the measured for galaxies agree better with the CDM predictions, supporting the conclusion reached previously, that on these scales, galaxies approximately trace the mass distribution (Gaztañaga & Frieman 1994; Lahav et al. 2002; Verde et al. 2002).
We explore the distribution of galaxy counts in cells for the 2dFGRS in more detail in Croton et al. (2004a), where we study the dependence of the correlation functions on luminosity.
Acknowledgements
The 2dFGRS was undertaken using the two-degree field spectrograph on the Anglo-Australian Telescope. CMB is supported by a Royal Society University Research Fellowship. DC acknowledges a PhD fellowship from the International Max Planck Research School in Astrophysics. EG acknowledges support from the Spanish Ministerio de Ciencia y Tecnologia, project AYA2002-00850 and EC FEDER funding. PN acknowledges receipt of a Zwicky Fellowship.
References
- [Baugh, Gaztañaga & Efstathiou (1995)] Baugh C.M., Gaztañaga E., Efstathiou G., 1995, MNRAS, 274, 1049.
- [Benoist] Benoist C., Cappi A., Da Costa L.N., Maurogordato, S., Bouchet F., Schaeffer R., 1999, ApJ, 514, 563.
- [Benson et al. (2001)] Benson A.J., Frenk C.S., Baugh C.M., Cole S., Baugh Lacey C.G., 2001, MNRAS, 327, 1041.
- [Bernardeau et al. 2002] Bernardeau F., Colombi S., Gaztañaga E., Scoccimarro R., 2002, Phys. Rep., 367, 1
- [Bouchet et al. (1993)] Bouchet F.R., Strauss M.A., Davis M., Fisher K.B., Yahil A., Huchra J.P., 1993, ApJ, 417, 36.
- [Colless et al.(2001)] Colless M., et al. (the 2dFGRS Team), 2001, MNRAS, 328, 1039
- [Colless et al.(2003)] Colless M., et al. (the 2dFGRS Team), 2003, astro-ph/0306581
- [XXX] Conway E., et al. (the 2dFGRS Team), 2004, MNRAS, submitted. (astro-ph/0404276).
- [Aussies17-20England] Croton D., et al. (the 2dFGRS Team), 2004a, MNRAS, submitted. (astro-ph/0401434).
- [XXX] Croton D., et al. (the 2dFGRS Team), 2004b, MNRAS, submitted. (astro-ph/0401406).
- [Eke et al.(2004)] Eke V.R., et al. (the 2dFGRS Team), 2004, MNRAS, 384, 866, (astro-ph/0402567).
- [Erdogdu] Erdogdu P., et al. (the 2dFGRS Team), 2004, MNRAS, submitted. (astro-ph/0312546)
- [Evrard et al.(2002)] Evrard A.E., et al. (the Virgo Consortium), 2002, ApJ, 573, 7.
- [Fry & Gaztañaga(1993)] Fry J. N. & Gaztañaga E., 1993, ApJ, 413, 447
- [Gaztañaga(1992)] Gaztañaga E., 1992, ApJ, 398, L17
- [Gaztañaga(1994)] Gaztañaga E., 1994, MNRAS, 268, 913
- [XXX] Gaztañaga E. & Frieman J., 1994, ApJ, 437, L13
- [Gaztañaga & Fosalba (1998)] Gaztañaga E., Fosalba P., 1998, MNRAS, 301, 524.
- [Hoyle, Szapudi, & Baugh(2000)] Hoyle F., Szapudi I., Baugh C. M., 2000, MNRAS, 317, L51
- [Juszkiewicz et al. (1993)] Juszkiewicz R., Bouchet F.R., Colombi S., 1993, ApJ, 412, L9.
- [Lahav, Itoh, Inagaki, & Suto(1993)] Lahav O., Itoh M., Inagaki S., Suto Y., 1993, ApJ, 402, 387
- [Lahav et al. (2002)] Lahav O., et al. (the 2dFGRS Team), 2002, MNRAS, 333, 961.
- [Norberg et al.(2001)] Norberg P., et al. (the 2dFGRS Team), 2001, MNRAS, 328, 64
- [Norberg et al.(2002b)] Norberg P., et al. (the 2dFGRS Team), 2002, MNRAS, 336, 907
- [Peacock] Peacock J.A., et al. (the 2dFGRS team), 2001, Nature, 410, 169.
- [Peebles(1980)] Peebles P. J. E., 1980, The Large-Scale Structure of the Universe (Princeton Univ Press)
- [Porciani] Porciani C., Giavaliso, M., 2002, ApJ, 565, 24.
- [Saunders] Saunders W., Frenk C.S., Rowan-Robinson M., Lawrence A., Efstathiou G., 1991, Nature, 349, 32.
- [Szapudi Gazta 1998] Szapudi I., Gaztañaga 1998, MNRAS, 300, 493.
- [Szapudi et al. (2000)] Szapudi I., Branchini E., Frenk C.S., Maddox S., Saunders W., 2000, MNRAS, 318, L45.
- [Verde et al.(2002)] Verde L., et al. (the 2dFGRS Team), 2002, MNRAS, 335, 432
- [XXX] Wild V., et al. (the 2dFGRS Team), 2004, MNRAS, submitted. (astro-ph/0404275).