[
Indirect search for dark matter: prospects for GLAST
Abstract
Possible indirect detection of neutralino, through its -ray annihilation product, by the forthcoming GLAST satellite from our galactic halo, M31, M87 and the dwarf galaxies Draco and Sagittarius is studied. -ray fluxes are evaluated for two representative energy thresholds, 0.1 GeV and 1.0 GeV, at which the spatial resolution of GLAST varies considerably. Apart from dwarfs, which are described either by a modified Plummer profile or by a tidally-truncated King profile, fluxes are compared for halos with central cusps and cores. It is demonstrated that substructures, irrespective of their profiles, enhance the -ray emission only marginally. The expected -ray intensity above 1 GeV at high galactic latitudes is consistent with the residual emission derived from EGRET data if the density profile has a central core and 50 GeV, whereas for a central cusp only a substantial enhancement would explain the observations. From M31, the flux can be detected above GeV and 1.0 GeV by GLAST only if 300 GeV and if the density profile has a central cusp, case in which a significant boost in the -ray emission is produced by the central black hole. For Sagittarius, the flux above GeV is detectable by GLAST provided the neutralino mass is below GeV. From M87 and Draco the fluxes are always below the sensitivity limit of GLAST.
]
I Introduction
The nature of dark matter (DM) remains a major unresolved problem in astroparticle physics. Main evidences for dark matter come from astrophysical observations. The rotation curve of a typical spiral galaxy flattens or slowly rises beyond the optical radius which includes most of the galaxy’s luminosity [1, 2]. The flattening of the rotation curves indicates the presence of DM at large radii (a few tens of kpc): a result which is confirmed, up to scales of kpc, by the study of close binary systems [3]. Among other evidences is the confinement of hot X-ray coronae around giant ellipticals which requires a massive dark halo [4, 5]. At the centre of spirals or giant ellipticals, kinematical data indicate a large ratio of the baryon to dark matter density (B/DM) [6, 7, 8]. On the contrary, for dwarf galaxies it seems that the presence of a substantial amount of DM in the very central regions is required to explain the kinematical data [9]. On large scales, the average mass to light ratio (M/L) for galaxy clusters [10], the infall of the Local Group towards the Virgo cluster [11], the velocity dispersion of galaxies [12] and the angular power spectrum of the cosmic microwave background (CMB) radiation [13] have been long providing evidences for dark matter. Various CMB experiments and distances to type Ia supernovae favor a flat universe of total density parameter and the matter density parameter [14, 15]. The total baryonic contribution, fixed either by the primordial nucleosynthesis of light elements or by the secondary acoustic peaks observed by CMB experiments such as WMAP is [13], indicating that on large scales gravitational forces are mainly due to non-baryonic matter. In view of all these evidences, the inevitable question arises : what is dark matter made of?
Most dark matter candidates which arise in the standard model of particle physics are excluded by the present observational constraints. For instance, neutrinos () which decouple relativistically from the primordial plasma and have a high relic abundance are the primary hot dark matter (HDM) candidates. However, in a HDM Universe, small-scale structures, of typical galaxy sizes, are erased by relativistic streaming, hence neutrinos are ruled out as DM candidates. Moreover, WMAP data set a robust upper limit to their density [13]. Supersymmetric (SUSY) extensions of the standard model lead to many more new DM candidates such as s-neutrinos, axions, gravitinos, photinos and cryptons [16]. Presently, the most plausible SUSY dark matter candidate is neutralino () which is the lightest supersymmetric particle. Neutralino is stable and hence is a candidate relic from Big Bang, if -parity quantum number, introduced to avoid a too rapid decay of proton, is conserved as is the case in the Minimal Supersymmetric extension of the Standard Model (MSSM). Neutralino is an electrically neutral Majorana fermion whose mass, , can range from a few GeV to a few hundreds of TeV. A lower limit of about has been set by the LEP accelerator [17], while an upper limit of TeV is favored theoretically to preserve unitarity [18].
In the past few years, major experiments have gone underway for the direct or indirect detection of dark matter particles [19]. Direct-detection experiments, such as DAMA, EDELWEISS, CRESST and IGEX are among many others [20], which basically measure the energy (up to tens of keV) deposited at the detector by the elastic scattering of dark matter particles from the detector nuclei. Direct detection experiments also use the annual modulation of the signal due to the orbital motion of the Earth around the Sun in their DM search. Clearly, the event rate, the search strategy and data analysis strongly depend on the spatial distribution of dark matter and its dynamics in the galactic halo, which are not unfortunately well-understood. For instance, it is not established if dark matter halos are dynamically-relaxed structures or not. Whether dark matter is homogeneously distributed with isotropic velocity distribution or whether there are inhomogeneities such as local streams, e.g. like that manifested through the tidal arms of the Sagittarius dwarf [21, 22] is not entirely clear. The leading trail of Sagittarius could be showering matter down upon the Solar System, affecting the local halo density and perturbing the velocity distribution [23]. The presence of very high density structures such as caustics, if survived up to the present day, could also have dramatic effects on direct searches [24]. Moreover, dark halos are generally not at rest and have considerable angular momentum [25], whose vector direction is probably not the same as those of the present spin axes of (baryonic) disks [26]. If this was the case for the Galaxy, then significant variations in the modulation of the signal would be expected. All of these are just a few of many uncertainties about properties of DM in the halos which overshadow the search experiments.
The indirect detection experiments search for products of self-annihilation of neutralinos such as energetic leptons, hadrons and also particles which would emerge in the follow-up hadronization and fragmentation processes. In addition to -ray lines generated through the annihilation channels and , the annihilation of two neutralinos also produces a -ray continuum as a consequence of the neutral pion decay. Besides these energetic s, neutrinos are also produced either in quark jets ( interactions) or in the decay of leptons and gauge bosons. Neutrinos produced in former process are less energetic than those produced in the latter. Neutralinos can be decelerated by scattering off nuclei and then accumulating at the centre of the Earth and or at the centre of the Sun (or inside any other gravitational potential well), thus increasing the annihilation rate. However, so far different experiments designed to detect decay products like high-energy neutrinos, have only managed to set upper limits on fluxes coming from the Earth centre or from the Sun [27].
The -ray emission on the other hand is expected, for instance, from the galactic centre and other massive dark matter halos. Since the annihilation rate depends on the square of the local density, the distribution of DM in the halo is of crucial importance. The degree of clumpiness, the density profile of a dark matter halo and in particular whether it has a central cusp or not, as well as the presence or absence of a central supermassive black hole (SMBH) could influence the annihilation rate. Other events such as the infall of small satellites, which are not totally disrupted by tidal forces can locally enhance the -ray emission [28].
The prediction of -ray fluxes requires two separate inputs: that coming from particle physics for issues such as the interaction cross section and the number of photons per annihilation, and the input from astrophysics for problems such as the spatial distribution of dark matter in potential sources.
Most studies on indirect DM detection explore various decay channels of neutralino annihilation in the huge parameter space of MSSM, consisting of 91 real parameters and 74 phases (most of them can be absorbed by field redefinitions [29]). In the effective MSSM model, where the low-energy parameters are constrained by accelerator data, seven free parameters still remain (the higgsino mass parameter , the gaugino mass parameter , the ratio of the Higgs vacuum expectation values tan, the mass of the CP-odd Higgs boson , the scalar mass parameter and the trilinear soft SUSY-breaking parameters and ). The computation of SUSY particle spectrum is therefore a difficult and sometimes uncertain procedure, which is often done using publicly available numerical codes like SUSPECT able to explore the full parameter space [33]. In this work, we take a different approach and assume that the number of photons produced per annihilation, , can be evaluated under the assumption that the annihilation process is similar to a QCD jet. In this picture, the evaluation of is rather simple since it depends only on one scale parameter, the neutralino mass.
The astrophysical aspect of the neutralino flux calculation, which concerns the dark matter distribution, remains rather uncertain. Numerical simulations suggest that the density in the central regions of dark halos varies as , where takes on values such as [34] or [36]. However, as we mentioned earlier, a cusp profile is not always supported by the observational data such as the rotation curves of bright galaxies [1]. Moreover, in order to avoid the inevitable divergence of the -ray emission rate calculated from these cusp profiles, various assumptions about the central density or cutoff radius are always made (see for example [28, 37, 38]). As a consequence, the value of the square of the density integrated along the line of sight in the direction of the galactic centre performed by different authors varies by as much as four orders of magnitude (see Table 1). The density profile and the M/L ratio also depends on the type of the galaxy, e.g., as compared to normal spirals, dwarfs seem to have a much higher M/L ratio and do not seem to have a central cusp. Thus, as far as the selection of a suitable source is concerned, many factors such as the possible density profile of the source, the level of background contamination, the distance to the source and the M/L ratio should be taken into account. Different studies have considered the galactic centre direction as a privileged source due to its high column density. However, the -ray emission from our halo is highly contaminated by the local background, mostly produced by cosmic ray interactions with the interstellar environment. Background contamination is less significant for sources outside the galactic plane and extragalactic sources which subtend a small solid angle at the detector. Because of their proximity, the galactic centre and the nearby dwarfs, Draco and Sagittarius, offer unique sites for dark matter detection. Due to their considerably large dark matter content, M31 and in particular M87, are also potential -ray sources. These are the sources that we shall consider in this article. We have calculated -ray fluxes from the Milky Way, M31 and M87 using two different density profiles: the first one is a very steep but non-diverging central profile based on very recent numerical simulations [39], while the second is a core-profile (Plummer profile) chosen because the energy distribution, the density and the potential are known in a closed form. The Plummer profile also leads to a finite mass and the density does not diverge at the centre. For Draco, we have used a density profile resulting from a dynamical model whereas a King profile was adopted for Sagittarius. In addition to these computations, we have simulated halos with clumps in order to verify how substructures affect the predicted -ray fluxes and have found that clumpiness enhances the predicted emission only marginally, in disagreement with some previous claims [37, 66] and in agreement with others [38].
Unlike most previous studies which estimate fluxes mainly for atmospheric Cherenkov telescopes (ACTs) such as CELESTE and VERITAS, in this work, we consider the possibility of detection by the future Gamma-ray Large-Area Space Telescope (GLAST), which has various obvious advantages over ACTs, the more important of which are as follows: i) lower energy threshold, allowing to probe neutralino masses above GeV; ii) the background is mainly due to the diffuse extragalactic emission and iii) the spatial resolution varies with the threshold energy, allowing to probe the halo density profile.
Our results suggest that GLAST may detect M31 at energies above GeV and GeV if the neutralino mass is less than GeV and only if the profile is cusped. Core profiles require neutralino masses lower then upper limits established by accelerator data. Thus GLAST can put constraints not only on the neutralino mass but also on the density profile, combining the different spatial resolution at different energies. According to our computations, in spite of having a very massive halo, emission from M87 cannot be detected either above GeV or GeV. However, for M87, there are enough evidences for the presence of a central SMBH [40, 41] which can form a central dark matter ”spike” and which would consequently boost the -ray flux by a factor of about , producing a detectable signal.
For the dwarf spheroids Draco and Sagittarius, we evaluate the flux and demonstrate that -ray emission from Draco is below the sensibility limit of GLAST, whereas Sagittarius can be detected above GeV energy threshold, if the neutralino mass is GeV.
This article is organized as follows. In Section II, we discuss the -ray emission and the flux equation. The annihilation rate and the number of photons produced per annihilation event are discussed in Section III. In Section IV we discuss the astrophysical parameters required for the flux calculation. In Section V, we present our numerical results for emission from the galactic halo , M31, M87, Draco and Sagittarius. In Section VI, we demonstrate how clumpiness of halos would effect the -ray flux. In Section VII we study flux enhancement effects due to the central SMBH in M31 and M87 and finally in Section VIII, we summarize our results and conclude our work.
II The -ray flux
Let us assume that dark matter halos are constituted by neutralinos: the lightest supersymmetric particle in many SUSY models (for a review of SUSY dark matter see [42]). Neutralino is a linear superposition,
| (1) |
of four mass-eigenstates where and are gauginos (the superpartners of electroweak gauge bosons) and are higgsinos. If the sum 0.9, the neutralino is gaugino type, while it is higgsino type if that sum is less than .
We further assume that in the early universe, neutralinos were in thermal equilibrium with the primordial plasma and that their present density was fixed at the freeze out, i.e., at the temperature when they decoupled from the other particle species. At freeze out, the annihilation rate is comparable to the expansion rate of the Universe and moreover neutralinos are non-relativistic (). After decoupling, neutralinos can annihilate via the following channels
| (2) |
into leptons and anti-leptons (), quarks and anti-quarks (), charged ( and ) and neutral ( and ) bosons respectively.
The decay of neutral pions formed in the hadronization process is the dominant source of continuum -rays. Besides the continuum emission, two annihilation channels may produce -ray lines. The first, , where the photon energy is and the second, , where the photon energy satisfies . The latter process is only important for neutralino masses higher than GeV.
Since neutralinos are Majorana particles, their density is equal to that of anti-neutralinos and hence the annihilation rate per unit volume is
| (3) |
where is the thermally-averaged annihilation rate, is the neutralino mass and is the neutralino matter density. If the source is spatially extended, the radiation intensity , measured at a given projected distance from the centre is
| (4) |
where
| (5) |
is the reduced intensity, is the number of photons above a certain energy threshold produced per annihilation and the integral is carried along the line of sight. The flux within a solid angle subtended by the detector ( for a small angular distance) is
| (6) |
where is the distance to the source and is the point-spread function (PSF) of the detector. In the case of GLAST, we adopt a Gaussian PSF () whose width depends on the energy. The GLAST project specification gives the width at which of the signal is included, which yields and .
III Neutralino annihilation rate : the values of and
In order to compute the -ray flux from (6), different physical and astrophysical parameters should be calculated. First, the average annihilation rate, which will be estimated under the assumptions already mentioned, i.e., that neutralinos are initially in thermal equilibrium and decouple at , when the annihilation rate equals the expansion rate. The latter is determined by the Friedman equation relating the Hubble parameter to the total energy density. As we shall see, neutralinos decouple at temperatures in the range GeV, depending on their assumed mass. Once neutralinos decouple, their comoving number remains almost constant, but their concentration with respect to photons changes, since other particles which decouple later, produce a ”reheating” of the photons due to entropy conservation. In this case, the ratio between the temperature after and before a given decoupling depends on the variation of the effective number of degrees of freedom as , where
| (7) |
and the sum is over all bosons, B, and fermions, F, present in the primordial plasma. For temperatures above GeV and below GeV one would expect that quarks and gluons are present and that the gauge bosons ( and ) have already disappeared. In this case, the main particles contributing to are photons, gluons, the three leptons and their anti-particles (the tauon decouples at ) as well as their associated neutrinos and anti-neutrinos, the six quarks and their anti-quarks.
Under these conditions one obtains (see for instance reference [43]) the balance equations
| (8) | |||||
| (9) |
where and is the Hubble parameter in units of kms-1Mpc-1. From these equations, once the density parameter is fixed, the decoupling temperature and the annihilation rate per particle can be computed for a given neutralino mass. Here we adopt the cosmologically accepted value of and assume that the neutralino mass lies in the range 10 GeV 2000 GeV. In this case, the decoupling temperature parameter varies within the interval , corresponding to the temperature range mentioned above. The mean annihilation rate per particle varies very little, and is comparable to values adopted in other studies [28, 44].
A major difficulty in the calculation of the number of s per annihilation stems from the unclear details of the hadronization and gamma-ray emission in the large-dimensional parameter space of SUSY models. Here, we use an approximation to the numerically computed QCD fragmentation functions taken from [45, 46]. We assume that hadronization and subsequent -ray emission is similar to the decay of QCD jets and that the annihilation of two neutralinos results in two jets, each of energy . Using the fragmentation function of jets into photons, neutrinos and baryons, which is known to a good approximation up to a few TeV [45, 47], the number of photons per annihilation and per jet produced in the energy interval is
| (10) |
where the dimensionless energy is defined as , with being the photon energy. Therefore, the total number of photons per annihilation event above the threshold energy is simply given by
| (11) |
where the factor two takes into account the formation of two jets rather than one, due to momentum conservation.
In Fig. 1, we show the photon production rate in for two threshold energies ( and GeV) as a function of the neutralino mass. The rates, in spite of our simplifying assumptions, are in good agreement with estimates derived from SUSY numerical codes [28, 44]. This is not surprising since the parameters required in SUSY codes are chosen to match the expected relic density. We have taken a reversed approach, i.e., we fix the relic density first and then compute the annihilation rate using the balance equations (8) and (9). As a consequence, both procedures should give comparable results, but our method has the advantage of using only one free parameter, the neutralino mass.
IV Astrophysical parameters: the values of
In the previous section, we have evaluated the annihilation rate and the total number of photons per annihilation event above a given energy threshold, . In this section, we evaluate the reduced intensity , given by (5) whose value is needed for the evaluation of the -ray flux (6). The integral in (5) is often evaluated assuming a density profile of the general form
| (12) |
where and are the characteristic density and radius. If and , one obtains the so-called Navarro-Frenk and White (NFW) profile [34], while if one obtains the so-called Moore profile [36]. Clearly, when integrated along the line of sight passing through the centre, as required by expression (5), both of these two profiles diverge. Various tricks are used to overcome this difficulty. One can impose a finite central density such as , since denser regions will be depleted by high neutralino annihilation rates [37]. High resolution simulations are also used to study the behaviour of the density profile in the very central regions of halos. However, even the highest resolution simulations are presently unable to resolve the very inner structure of halos and different extrapolations are needed to obtain the central density. In order to illustrate this point, Table 1 compares different values of density-squared along the direction of the galactic centre given by the expression (5) estimated by several authors. In fact, these reduced intensities correspond to values averaged over a given solid angle representative of the spatial resolution of the detector.
Table 1. Reduced intensity in the direction of the galactic centre
| (13) | |||||
| (15) | |||||
| (16) | |||||
| (17) | |||||
| (18) | |||||
| (19) | |||||
| (20) |
Simple inspection of Table 1 shows that the integral (5) may vary by four orders of magnitude according to the assumed profile. Consequently, severe uncertainties overshadow the value of the predicted -ray flux.
Rather recently, the inner structure of dark halos in CDM cosmology was revisited [39] and the new ”-profile”
| (21) |
fitting the the numerical results was proposed, which has several advantages over (12). Firstly, the total mass and the central density are finite which solve the aforementioned divergence problem in the evaluation of the central intensity. Secondly, the logarithmic slope decreases inwards more gradually than NFW or Moore profiles. According to simulations, the parameter is restricted to be in the range and here we adopt for M31 and the Milky Way the suggested value of [39]. The two remaining parameters, and , can be estimated if the total halo mass and one other physical quantity such as the maximum circular velocity are known. However, the rotation curve within the effective radius is not dominated by dark matter [25] and so the maximum rotation velocity is not a robust quantity. The halo of M31, as we shall see, is probably similar to our own halo which implies that the dark matter energy density at a distance of about kpc from the centre should be comparable to that observed in the solar vicinity, i.e. GeVcm-3. We use this value together with the total mass of M31 to fix the parameters and .
Present observational data constraining the mass of the halo of M31 are rather poor. For instance, the rotation curve seems to be well-explained with just the baryonic matter in the bulge and the disk, whose mass distributions are traced by the blue light [49]. This does not exclude the existence of a dark matter halo whose contribution to the gravitational force, and hence its effect on the rotation curve, would be more relevant only at distances larger than few tens of kpc. Direct estimates of the halo mass of M31 are based on the peculiar motion of the Local Group (LG) and on the kinematics of its satellites. A new solution for the solar motion which includes the probable members of the Local Group and assumes virial equilibrium, leads to a total mass for the LG of [50]. Using the projected mass method ([51, 52]), the contribution of the M31 subgroup (including only 7 satellites) to the total mass of the LG amounts to [50]. A similar result () was obtained [53], including satellites, distant globular clusters and halo planetary nebulae, while a firm upper bound of was derived from a similar analysis including satellites and new radial velocity data [54]. Using the kinematical data on these satellites and the projected mass estimator [52], we have obtained a mass of for M31. Other indirect estimates based on disk formation and cusp dark matter halo expected for CDM cosmology predict a mass of [55]. We adopt the value , which is compatible with all of these different estimates.
Subsequently, using the mass of M31 and also the local density of GeVcm-3 which we argued for earlier in this section, we obtain the two parameters defining the ”-profile” (21): = and kpc. We emphasize that these parameters give, in terms of the total potential energy , a gravitational radius of kpc, which is a typical value that we have found in our numerical simulations for halos of similar masses [25].
Since the high B/DM ratios observed in the central regions of galaxies is contradictory with a cusp in the DM density profile, we have also considered a profile with a central core to represent the dark matter distribution inside halos. We assumed a Plummer density profile,
| (22) |
and since the central density and total mass are finite, the distribution function depends only on the total energy ( ) and the gravitational potential can also be obtained in a closed form. Using the two constraints mentioned earlier in this section, we obtain the two parameters defining the profile (22) in the case of M31: = and kpc.
For M87, the properties of the gaseous X-ray corona were determined in reference [56]. From the density and temperature profiles of the hot gas, the total mass inside a given radius can be computed under the assumption of hydrostatic equilibrium. After correction for the contribution of baryons (stars and gas) to the gravitational forces, the dark matter distribution can be evaluated [56]. Remarkably, such a distribution can be well-represented by an ”-profile” with the parameters and kpc. Integration of this profile gives a mass of inside a radius of kpc, in agreement with other estimates [56]. However, we cannot exclude that at distances less than a few kpc, such a profile would be inconsistent with observations.
Table 2. Values of the parameters used in the density profiles.
| (24) | |||||
| (26) | |||||
| (29) | |||||
| (31) | |||||
| (33) | |||||
| (35) | |||||
| (39) | |||||
| (41) | |||||
| (45) | |||||
These parameters, summarized in Table 2 (for dSph’s see details in Section V), will be used in our predictions of the expected -ray flux from neutralino annihilation in M31 and M87. In Fig. 2 we show the expected intensity profile for M31 and M87 as a function of the angular distance to the centre. These profiles were derived numerically from (4), for an energy threshold of GeV and GeV. The comparison uses only density profiles with central cusps, defined by the parameters discussed above. Note that although M31 has a less massive halo, its central brightness is expected to be higher than that of M87.
V Numerical results
A Flux from the galactic halo
It is instructive to compare our results with previous estimates of the reduced intensity (5) in the direction of the galactic centre. In our work, the integral of the density squared along the line of sight is if the -profile (21) is adopted. This compares quite well with the value of [37], based on extrapolation from high resolution simulations, but is one order of magnitude higher than those given in a few of the previous works [38, 57], where NFW profiles were adopted. Using the core profile, this integral (5) is equal to , considerably smaller than estimates for profiles with central cusps as would be expected, but still one order of magnitude higher than some others which also consider a core profile (see for example [57] whose estimate of is given in Table 1).
In the energy range GeV, cosmic ray interactions give a substantial contribution to the -ray emission originated from the galactic disk. The electron component produces high energy photons either by inverse Compton scattering or bremsstrahlung, while protons produce -photons via the decay of neutral pions generated in collisions with interstellar matter. In a previous work which uses EGRET data, at high galactic latitudes a significant residual intensity of photons above GeV is claimed even after correction for the expected background of cosmic rays and the diffuse extragalactic emission [58]. These residual intensities although marginal have rather interesting implications for the halo density profile. We computed the expected intensity, averaged over cells of as considered in [58], in the direction . Table 3 gives the expected intensity as a function of the neutralino mass for the -profile (with a central cusp) and the Plummer profile (with a central core).
Table 3. Intensity (in photons ) above 1 GeV in the direction
| (47) | |||||
| (49) | |||||
| (50) | |||||
| (51) | |||||
| (52) | |||||
| (53) | |||||
| (54) |
The results summarized in Table 3 show that at high latitudes, contrary to what is obtained in the direction of the galactic centre, the Plummer profile produces an intensity higher than that derived from the -profile. This is easily understood since the latter profile gives a larger mass concentration near the centre while the former has a shallower mass distribution. Furthermore, Table 3 shows that intensities derived from the -profile are always below the EGRET residual intensity. In this case, an important intensity enhancement by clumps is necessary to explain the EGRET residuals [66, 37]. Intensities derived from the Plummer profile are comparable to EGRET values if 50 GeV, a limit not inconsistent with the lower bound derived from LEP. As we shall see in Section VI, the enhancement of the -ray emission produced by subhalos is rather small, with boost not exceeding a factor of . Presently, a firm conclusion cannot be made since the EGRET residuals are in the sensibility limit of the instrument. This situation is expected to improve greatly with the forthcoming GLAST.
B Fluxes from M31 and M87
The detection of -rays with energies around 50 GeV from M31 was considered by the CELESTE collaboration [30]. Their study shows that the annihilation signal could be detectable by CELESTE for 200 GeV, if the M31 halo is very clumpy and/or if there is a strong accretion onto a central supermassive black hole [30].
M87, the giant elliptical galaxy at the centre of the Virgo cluster, is also a potential source of -rays produced by annihilation [31]. If it is simply assumed that the neutralino mass is TeV and that the photon production rate above the threshold energy of GeV is , the predicted -ray flux from M87 would be below the sensibility of the present ACTs [31]. However, detection by the new generation of ACTs like VERITAS would be possible if there is an enhancement by a factor due to the clumpiness of the halo [31]. In this work, we consider the possibility of detection by GLAST, which has various obvious advantages over the atmospheric Cherenkov telescopes, which we have mentioned in Section I.
The photon production rate above a given energy is
| (56) |
where is the minimum flux above a certain photon energy detectable by GLAST and we have used equations 4 and 6. Values of varies from one -ray experiment to another and here, we use the sensibility curves summarized in [59]. The production rate given by the above expression represents the minimum required value for the production of a detectable signal. In Fig. 3 we plot the minimum photon production rate and the photon production rate derived in Section III as a function of the neutralino mass, for an energy threshold of GeV. The required minimum production rates are shown for both the -profile and the Plummer profile. Numerical calculations were performed adopting a distance of kpc for M31.
Fig. 3 demonstrates that detectable fluxes from M31 can be produced by both density profiles if GeV. In fact, the relatively large acceptance angle of GLAST at MeV, includes a substantial fraction of the halo, reducing the expected differences due to different density profiles. The situation is rather different when the threshold energy is GeV (Fig. 4). In this case, the detector acceptance angle is considerably reduced and only a central cusp would lead to enough projected mass to produce a detectable flux if GeV. These mass limits are slightly smaller than the lower bound derived from LEP [17], but masses as low as GeV have been derived from WMAP data in the frame of an effective MSSM model without gaugino-mass unification at the GUT scale [32]. In Section VII we discuss how these limits are changed by the presence of a central SMBH.
In spite of its extremely massive halo, the predicted fluxes from M87 are about one order of magnitude below the sensibility limit of GLAST in the range GeV, due to its large distance ( Mpc) from us and in spite of the fact that a substantial fraction of a far halo would lie within the acceptance angle of the detector. As in the case of M31, the central SMBH strengthens considerably the emission, producing a detectable signal, as we shall shortly demonstrate in Section VII.
C Fluxes from Dwarf Spheroidals
Accumulating radial velocity data on stars of dwarf spheroidal (dSph) in the past years, have been providing convincing support for a large M/L ratios and hence a substantial amount of dark matter in these galaxies. The possibility of detecting -ray emission from dSph’s due to neutralino annihilation has been considered in some recent works [31, 57], most of which emphasize on the energy range covered by ACTs. In the photon energy range of around GeV, the acceptance angle of GLAST covers a considerable fraction of the galaxy, hence increasing the amplitude of the received signal.
Once again, the predicted flux depends on the dark matter density profile of dSph’s. The light distribution in these systems is well-described by isotropic King models [62]. However, in the case of Draco the velocity dispersion rises slightly with the increasing radius, ruling out the possibility that the DM distribution be similar to that of light [60]. The observed velocity dispersion profile can be reproduced by models in which the dark matter distribution is significantly more extended than light, having also a tangential anisotropy in the velocity dispersion [60]. These models are based on a modified Plummer potential and density family, characterized essentially by three parameters: , and . The first defines the core or the scale radius, the second determines the mass distribution ( = 1 implies that DM follows light) and the third measures the velocity anisotropy.
The potential is given by [61]
| (57) |
where is related to the central matter density by the equation . The central density can also be explicited in terms of the projected central velocity dispersion as [61]
| (58) |
where .
According to [60], the best parameters describing the Draco system are: = 9’.6 (0.2 kpc at a distance of 72 kpc), = -0.34 and = -1.03 (implying tangential velocity anisotropy). Since the observed central projected velocity dispersion is 8.5 km.s-1, from (58) one obtains for the central density g.cm-3.
We have used this modified Plummer model and the parameters above to estimate the -ray flux from Draco. If we adopt = 30 GeV, corresponding to the lower limit derived from accelerator data, the expected -ray flux from Draco above 0.1 GeV is about 1.3 cm-2.s-1, which is about one order of magnitude less than the sensibility of GLAST at this energy threshold. Higher neutralino masses will give still lower fluxes. A similar result is obtained for 1.0 GeV energy threshold.
The situation is more complicated in the case of Sagittarius since this dSph is partially disrupted by the tidal forces. Up to now, the different proposed models are not able to reproduce adequately the age and the observed structure of this dSph. Most of the models suggest that the system is disrupted after 1-2 orbits while observations indicate ten or more.
Numerical simulations aiming to describe the merger history of this dwarf assumed either a Plummer [22] or a King profile [64] for the progenitor. These studies suggest that the mass of the core is in the range [63, 22, 64].
Here we model the mass distribution of Sagittarius by an isotropic King profile, since no significant velocity dispersion gradient is detected across the main body of the galaxy. The tidal radius is ill-defined in this system, but it should be smaller than kpc in order to account for the Gyr old M giants which were formed in the core and then escaped through the tidal boundary. If we take respectively for the tidal and core radii kpc and kpc, the total mass is about , consistent with simulations by [64]. Since the central projected velocity dispersion is 11.4 km.s-1 [63], the resulting central density is . In Fig. 5 we show the minimum photon production rate required for detection and the theoretical rate as a function of the neutralino mass. Emission from Sagittarius can be detected by GLAST above GeV, if the neutralino mass is GeV, but not above GeV, due to the small acceptance angle at these energies.
VI Effects of clumps on the flux
Numerical N-body simulations show that dark matter halos contain a large number of self-bound substructures, which correspond to about of their total mass [35, 65]. These substructures are the consequence of the capture of small satellites, which have not yet been disrupted by tidal forces. Since the -ray emissivity depends on the square of the density, these substructures enhance the -ray flux relative to that expected for a smooth halo. However, whether this enhancement is significant or not is still a matter of debate. In some simulations, an important enhancement of -ray flux due to clumpiness was reported for emission from our halo [37], while other numerical simulations seem to have indicated only a very small boost of the signal [38]. The enhancement due to clumps not only depends on the density profile of the clumps but also on their number density. The predicted number of massive substructures exceed the number of observed satellites of the Milky Way or M31, by at least one order of magnitude, which has been causing severe problems for CDM model. For instance, a number of subhalos with masses above M⊙ as high as has been assumed in recent works [28].
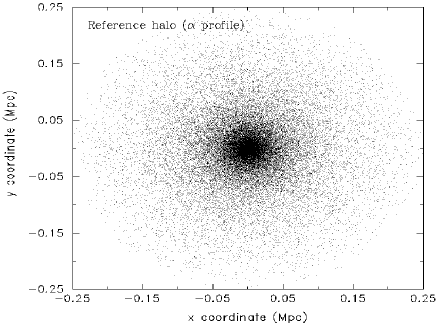
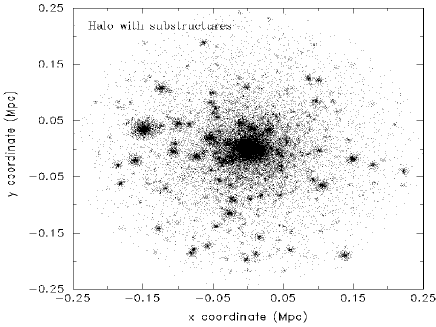
Here, to study the effects of clumpiness and the effects of the density profile of clumps on the flux, we have made many different experiments with many test halos that we have produced numerically. In this way, we have been able to study the effects of clumpiness for halos with very high resolution and with various different profiles. Our test halos have the characteristic parameters of M31, with typical mass of M⊙, constituted by particles, corresponding to a mass resolution of M⊙. In the first experiment, the particles are distributed in a spherical volume of radius kpc, comparable to the gravitational radius expected for halos of such a mass (see [25]), according to -profile. This will be our reference halo. In the next trials, we consider halos with substructures. The number of clumps Ncl in the mass range - + is assumed to obey [35, 38]
| (59) |
The normalization constant is calculated by requiring the total mass in the clumps to be of the halo mass and by assuming subhalos masses in the range – M⊙. The minimum number of particles in the clumps is about , while the more massive ones have particles. These figures correspond to mass bins built as described below. In spite of the low number of particles in the small clumps, our results are not seriously affected, since most of the flux enhancement is due to the massive structures. For numerical convenience, the number of clumps was calculated from (59) within logarithmic bins of width equal to .
Clumps were distributed according to the (normalized) probability distribution , where is assumed to have an -profile, which gives the probability to find a clump at a distance within the volume element . The stripping process caused by tidal forces seems to reduce the density of a clump at all radii and, in particular, in the central regions, producing a density profile with a central core [67]. This result was further confirmed by simulations which found that the inner structure of subhalos are better described by density profiles shallower than NFW [38]. However, other simulations seem to indicate that the central regions of clumps are well-represented by power law density profiles, which remain unmodified even after important tidal stripping [68]. To test the importance of these differences for the flux, we allow for both of these possibilities: we simulate both test halos with clumps having a central core or NFW profile and study how our results would change from one to the other.
We recall that the -ray intensity (4) depends on the the integral along the line of sight of the square of the density. We define the enhancement factor to be the ratio between the reduced intensity calculated for halos with substructures to that calculated for our reference halo (with no substructure).. The numerical evaluation of intensities was performed by dividing the halo volume in a large number of small cubes. The cube volume varies logarithmically, being smaller in the central regions in order to increase the accuracy in the particle density. For angular distances , the number of cubes is about whereas near the centre () this number increases up to . We have checked our algorithm for computing the reduced intensity by comparing from direct integration of (21). Errors are of the order of 2-3 % if the integration is carried along line of sights far from the centre, but can reach values of up to 10% if the integration is performed along directions close to the centre, due to resolution problems. Intensities were calculated in steps of and , with and being respectively the angular distance to the centre and the azimuthal angle around the centre of the galaxy.


In figure 7 we show the maximum enhancement factor as a function of the angular distance to the centre of M31 for some selected trials. In the upper panel clumps have profiles with central cores whereas in the lower panel a profile with central cusp was adopted. We notice that, up to distances of about , higher than the resolution of GLAST, independent of the clump profile, the enhancement is very small (about 10%), in agreement with the previous results (e.g. see [38]). Larger enhancements may be obtained at the outskirts of the halo and, in this case, clumps with central cusps produce a strengthening almost one order of magnitude higher than clumps with cores. However, two points must be emphasized: a) these enhancements are local and when convolved with the PSF of the detector, they will be attenuated; b) as shown in Fig. 2, at from the centre the intensity has already decreased by almost four orders of magnitude. Thus, at the halo boundaries, even with an enhancement factor of , the expected flux received by a detector pointing away from the centre will be below the detectability limit.
VII Effects of central supermassive black holes
Fast-growing observational evidences indicate that most elliptical galaxies and bulges of spirals harbor SMBHs at their centres. In particular, recent spectroscopic data suggest the existence of SMBH in M31, M87 and in the Milky Way [70]. These kinematical data, if interpreted in terms of Keplerian motions, indicate a mass of M⊙ for the SMBH in the centre of M31 [70] and of about M⊙ for that in the centre of M87 [40, 41]. Kinematical data on stars very near Sagittarius A, the radio source supposed to be in the galactic centre, represent the best evidence in favor of the existence of a SMBH in the Milky Way [71], whose mass is M⊙.
If a black hole grows inside a dark matter halo, supposed to be constituted by a dissipationless fluid, the density around it also grows since the gravitational attraction of the black hole causes a shrinking of the orbits inside the sphere of influence, whose radius is given by , where is the initial one-dimensional velocity dispersion of dark matter. If the growth is adiabatic [72], that is if , where is the orbital timescale, the black hole accretion rate and the relaxation timescale, then a central spike will be formed inside the sphere of influence, having a central cusp profile of the form
| (60) |
The value of the exponent depends on the initial state of the matter distribution. On the one hand, if the initial density profile has a central core, then the resulting spike is a power law with = 3/2 [74, 72]. On the other hand, an initial power law profile with an exponent will produce a steeper density profile with an exponent [75].
The adiabatic scenario is questionable: firstly because the predicted accretion rates are considerably higher than the current estimates [73] and secondly, because massive galaxies like M31, M87 and the Milky Way have most probably experienced several merging episodes [25], which may have perturbed or even destroyed the central spike. Nevertheless, we will assume in our calculations that there is a putative spike formed around the SMBH under adiabatic conditions.
For M31, previous simulations [30] gives a spike profile which is formed in less than yrs. According to [30] this profile gives a small enhancement of about 45%, with respect to a NFW profile, of the -ray emission from M31. Here we adopt the following procedure. We assume a smooth transition at from the spike to the background profile , which is given either by the -profile or by the Plummer profile, i.e.
| (61) |
a condition which allows us to determine the constant . Since the power law profile diverges at the centre, we must introduce a cutoff radius fixed either by the self-annihilation rate or by capture into the black hole. Using the former condition, the cutoff radius is given by
| (62) |
where is the age of the SMBH, here taken to be equal to yrs. For M31 the radius of the sphere of influence is about pc. We have first considered a profile with a central core given by the Plummer profile for the background, which results in a spike profile, . The -ray flux was computed as before from (6), using (60) in the interval and the Plummer profile (22) for . No significant enhancement is obtained whether the threshold energy is taken at GeV or at GeV. However a different result is obtained if we use the -profile (21) as the background profile. The spike profile is much steeper (), causing a more rapid increase of the density towards the centre and an important enhancement of the -ray flux. The strengthening of the signal is about a factor of at GeV and increases up to a factor of at GeV, due to the higher spatial resolution of GLAST at higher energies. As a consequence, if the halo of M31 has a profile with a central cusp, the -ray emission can be detected by GLAST at GeV if GeV and at GeV if GeV. These limits are considerably larger than those derived in Section V and open new possibilities to impose bounds on the neutralino mass and/or on the dark matter distribution.
The effects of a central spike are more dramatic in M87, since this galaxy has an extremely massive central black hole. The radius of influence of this SMBH is about pc. As we have seen in Section IV, the dark matter profile of M87 can be quite well represented by the -profile (21). Thus, the central spike has also a profile , but the greater dark matter mass inside the sphere of influence produces an enhancement larger than that obtained for M31. The boost factor is about at 0.1 GeV and at 1.0 GeV. These large factors lead to detectable signals either at GeV if GeV or at GeV if GeV.
VIII Conclusions
Observational results favor a Universe whose main matter content is non-baryonic and dark. Presently, the most plausible DM candidate is neutralino; the lightest stable supersymmetric electrically neutral Majorana fermion. The possibility that neutralinos might be detected indirectly through their annihilation products such as -rays and neutrinos are explored by increasingly more sophisticated experiments which mainly search for energetic neutrinos from the centre of the Earth or the Sun and or for -rays from the galactic halo and various extragalactic sources. Although, the goal of DM detection has not yet been achieved, upper bounds have been set on parameters such as neutralino mass.
In this work, the -ray emission from neutralino annihilation has been studied. Our aim has been to use the results of indirect search experiments mainly GLAST to constrain the neutralino mass and the halo density profiles as best as possible. Hence, we have used a simple description of the annihilation process in which the only free parameter is the neutralino mass. We have estimated the photon production rate by fixing the present relic neutralino density to its equilibrium value at the decoupling temperature ( = 0.26) favored by the latest CMB data and by assuming a QCD jet description of the annihilation process. Photon production rates above and GeV are in the range up to ph cm3s-1 for the considered range of masses ( GeV), consistent with results derived from supersymmetric codes such as DarkSUSY and SUSPECT. The mass interval that is explored here is compatible with the lower bound ( 30 GeV) given by the accelerator data and with the recent upper limit ( 800 GeV) set by the elastic scattering of neutralinos from protons, including constraints imposed by new measurements of the anomalous magnetic moment of the muon (-2) [69].
The DM density profile, was studied in the light of the different spatial resolution of the future experiment GLAST at different energies. Two different dark matter density profiles were adopted in our calculations: a profile with central cusp, in agreement with results of numerical simulations and one with a central core, more representative of the observational data on rotation curves of bright spirals. These profiles are characterized by two parameters determined by the halo mass and by the mass density of dark matter at a given distance to the centre of the halo (in the case of the the Milky Way and M31) or using data on the X-ray emissivity (in the case of M87). For dSphs, a modified Plummer profile, able to account for the observed raising velocity dispersion profile, was adopted for Draco whereas a King profile was assumed for Sagittarius.
We have studied, by generating and experimenting with many different numerically simulated halos, the effect of clumpiness on the -ray emission from M31 and conclude that the enhancement is less than a factor of two for detectors centered on the object and having acceptance solid angles of sr-1. The local enhancement factor can be as large as 40-50 at the boundaries of halos with central cusps. However, the absolute fluxes expected for a detector pointing away from the centre will be, in general, below the limit of detectability. These conclusions are in agreement with studies on the clumpiness effects either in the galactic halo [38, 77] or in M31 [76], where maximum enhancement factors of about a factor of three were obtained.
Our calculations show that if the dark matter halo of the Milky Way has a density profile with a central core, then the expect -ray intensity above 1 GeV in the direction and averaged over a solid angle of , is comparable to the EGRET bounds [58], if 50 GeV. However, a profile with a central cusp gives an expected intensity at least one order of magnitude smaller, requiring an important enhancement due to the halo clumpiness to explain the data. This could be an additional argument in favor of high baryon-to-dark matter ratios in the central regions of bright galaxies, in agreement with analyses of rotation curves.
Different spatial resolution at different energies of GLAST permits us to obtain informations either on the neutralino mass or on the dark matter distribution in the halos. Combining the informations on both energy thresholds, four possibilities arise which are written below.
For M31, including effects of the spike produced by the central SMBH, the following situations may occur:
a) If no detection is made at either energies then one may draw the conclusions that GeV and that the profile has a central core.
b) If detection is made at both energy thresholds then the profile has a central cusp and GeV.
c) If detection is made at GeV but not at GeV then we may conclude that the profile has a central core and GeV.
d) Detection at GeV but not at GeV would result from a central cusp in the density profile and GeV.
A similar analysis for M87 yields:
a) If no detection is made at either energies then one may draw the conclusions that the ”-profile” is not valid at the centre where the density profile probably has a core or GeV.
b) If detection is made at both energy thresholds then the ”-profile” is a good representation of the dark matter distribution near the centre and GeV.
c) If detection is made at GeV but not at GeV then we may conclude that profile has a central core but no limits can be set on the neutralino mass unless an specific density profile is adopted.
d) Detection at GeV but not at GeV would indicate that the ”-profile” is acceptable and GeV.
Because of their high dark matter content and their relative proximity the dSph Draco and Sagittarius are among the most favorable sources of -rays resulting from neutralino annihilation. However, we conclude that in spite of its large M/L ratio, the expected signals from Draco will not be detectable in the energy range of GLAST. On the contrary, our results suggest that an emission detectable by GLAST above GeV is expected for Sagittarius, if the neutralino mass is below GeV, a limit compatible with the LEP lower bound.
S. P. acknowledges PhD fellowship from Université de Nice Sophia-Antipolis (UNSA). R. M. is supported by Marie curie fellowship HPMF-CT 2002-01532. We thank F. Stoehr, S. Profumo and the referee for useful comments which have improved the manuscript.
REFERENCES
- [1] P. Palunas & T.B. Williams, AJ 120 (2000) 2884
- [2] Y. Sofue & V. Rubin, ARA&A 39 (2001) 137
- [3] J.A.de Freitas Pacheco & S. Junqueira, Astrophys. Sp. Sci. 149 (1988) 141
- [4] W. Forman, C. Jones & W. Tucker, ApJ 293 (1985) 102
- [5] G. Fabbiano, ARA&A 27 (1989) 87
- [6] V.G. Ortega & J.A. de Freitas Pacheco, AJ 106 (1993) 899
- [7] V.G. Ortega, G.L. Vieira & J.A. de Freitas Pacheco, Astrophys. Sp. Sci. 262 (1999) 271
- [8] R.P. van der Marel, J.J. Binney & R.L. Davies, MNRAS 245 (1990) 582
- [9] H. Hoekstra, T.S. van Albada & R. Sancisi, MNRAS 323 (2001) 453
- [10] R.G. Carlberg, H.K.C. Yee & E. Ellingson, ApJ 478 (1997) 462
- [11] M. Davis and P.J.E Peebles, ARA&A 21 (1983) 109
- [12] R. Bruno and J.A. de Freitas Pacheco, PASP Conf.Ser. 24 (1992) 173
- [13] D.N. Spergel et al. ApJS 148 (2003) 175
- [14] S.J. Perlmutter et al., ApJ 517 (1999) 565
- [15] A. Riess et al., AJ 116 (1998) 1009
- [16] J.R. Ellis, J.L. Lopez and D.V. Nanopoulos, Phys. Lett. B 247 (1990) 257
- [17] G. Abbiendi et al. Eur.Phys. Jour. C14 (2000) 187
- [18] K. Griest & M. Kamionkowski, Phys. Rev. Lett. 64, (1990), 615
- [19] J.L.Feng, K.T.Matchev & F. Wilczek, Phys.Rev. D63 (2001) 045024
- [20] M. Loidl, astro-ph/0207308 (2002)
- [21] H.J. Newberg et al., ApJ 596 (2003) L191
- [22] S. Majewski et al., ApJ 599 (2003) 1082
- [23] K. Freese, P. Gondolo & H. Jo Newberg, astro-ph/0309279
- [24] P. Sikivie, I.I. Tkachev and Y. Wang, Phys. Rev. D56 (1997) 1863
- [25] S. Peirani, R. Mohayaee & J.A. de Freitas Pacheco, MNRAS 348 (2004) 921
- [26] F.C. van den Bosch, T. Abel, R.A.C. Croft, L. Hernquist & S.D.M. White, ApJ 576 (2002) 21
- [27] J. Ahrens et al., Phys. Rev. Lett. 90 (2003) 251101; astro-ph/0202370
- [28] A. Tasitsiomi & A. Olinto, Phys. Rev.D66 (2002) 083006
- [29] D.J. Chung et al., hep-ph/0312378
- [30] A. Falvard et al., in Proc. Symp. Astronomy, Cosmology and Fundamental Physics, ESO-CERN-ESA, p.438
- [31] E.A. Baltz, C. Briot, P. Salati, R. Taillet & J. Silk, Phys.Rev. D61 (2000) 023514
- [32] A. Bottino, F. Donato, N. Fornengo and S. Scopel, Phys.Rev. D 68 (2003) 043506
- [33] A. Djouadi, J-L Kneur and G. Moultaka, astro-ph/0211331
- [34] J.F. Navarro, C.S. Frenk & S.D.M. White ApJ 462 (1996) 563
- [35] B. Moore et al., ApJ 524 (1999) L19
- [36] B. Moore, F. Governato, T. Quinn, J. Stadel & G. Lake MNRAS 310 (1999) 1147
- [37] C. Calcáneo-Roldán & B. Moore, Phys.Rev. D 62 (2000) 123005
- [38] F. Stoehr, S.D.M. White, V. Springel, G. Tormen & N. Yoshida, astro-ph/0307026
- [39] J. F. Navarro et al. - astro-ph/0311231
- [40] R.G. Harms et al., ApJ 435 (1994)L35
- [41] F. Maccheto et al., ApJ 489 (1997) 579
- [42] G. Jungman, M. Kamionkowski and K. Griest, Phys. Rep. 267 (1996) 195
- [43] E.W. Kolb & M.S. Turner in The Early Universe, Addison-Wesley Publishing Company (1990)
- [44] P. Salati, astro-ph/0207396
- [45] C. Hill, D. Schramm & T. Walker, Phys. Rev. D36 (1987) 1007
- [46] U.F. Wichoski, J.H. MacGibbon & R.H. Brandenberger, Phys. Rev. D65 (2002) 063005
- [47] C. Hill, Nucl. Phys. B224 (1983) 469
- [48] J.R. Ellis et al, astro-ph/0110225
- [49] R. Braun, ApJ 372 (1991) 54
- [50] S. Courteau & S. van den Bergh, AJ 118 (1999) 337
- [51] J.N. Bahcall and S. Tremaine, ApJ 244 (1981) 805
- [52] J. Heisler, S. Tremaine and J.N. Bahcall, ApJ 298 (1985) 8
- [53] N.W. Evans & M.I. Wilkinson, MNRAS 316 (2000) 929
- [54] N.W. Evans, M.I. Wilkinson, P. Guhathakurta, E.K. Grebel & S.S. Vogt, ApJ 540 (2000) L9
- [55] A. Klypin, H. Zhao & R.S. Somerville, ApJ 573 (2002) 597
- [56] J.C. Tsai, ApJ 413 (1993) L59
- [57] N.W. Evans, F. Ferrer and S. Sarkar, astr-ph/0311145
- [58] D.D. Dixon et al., New Astronomy 3 (1998) 539
- [59] C.M. Hoffman, C. Sinnis, P. Fleury and M. Punch, Rev. Mod. Phys. 71 (1999) 897
- [60] J.T. Kleyna, M.I. Wilkinson, N.W. Evans and G. Gilmore, ApJ 563 (2001) L115
- [61] M.I. Wilkinson, J. Kleyna, N.W. Evans and G. Gilmore, MNRAS 330 (2002) 778
- [62] I. King, AJ 67 (1965) 471
- [63] R.A. Ibata, R.F.G. Wyse, G. Gilmore, M.J. Irwin and N.B. Suntzeff, AJ 113 (1997) 634
- [64] A. Helmi and S.D.M. White, MNRAS 323 (2001) 529
- [65] A. Klypin, V.A. Kravtsov, O. Valenzuela and F. Prada, ApJ 522 (1999) 82
- [66] L. Bergstrom, J. Edsjo, P. Gondolo & P. Ullio, Phys.Rev. D 59 (1999) 043506
- [67] E. Hayashi, J.F. Navarro, J.E. Taylor, J. Stadel & T. Quinn, ApJ 584 (2003) 541
- [68] S. Kazantzidis, L. Mayer, C. Mastropietro, J. Diemand, J. Stadel & B. Moore, astro-ph/0312194
- [69] Y.G. Kim, T. Nihei, L. Roszkowski and R.R. de Austri, hep-ph/0208069
- [70] J. Kormendy and K. Gebhardt, Proceedings of the 20th Symposium on Relativistic Astrophysique, ed. H. Martel and J.C. Wheeler, astro-ph/0105230
- [71] A.M. Ghez, M. Morris, E.E. Becklin, A. Tanner, and T. Kremenek, Nature 407 (2000) 349
- [72] P. Young, ApJ 242 (1980) 1232
- [73] A. Klypin, H. Zhao and R.S. Somerville, astro-ph/0110390
- [74] P.J.E. Peebles, Gen.Rel. Grav. 3 (1972) 61
- [75] P. Gondolo and J. Silk, Phys. Rev. Lett. 83 (1999) 1719
- [76] L. Pieri and E. Branchini, astro-ph/0307209
- [77] S.M. Koushiappas, A.R. Zentneer and T.P. Walker, Phys.Rev. D 69 (2004) 043501