The Effect of aberration on polarization position angle of pulsars
Abstract
The linear polarization position angle (PPA) of pulsar emission shows a wide variety of structures, which deviates from the classical rotating vector model. In this study we investigate the effect on the PPA due to emission arising from a range of heights. We demonstrate that by appropriately choosing the emission height we can reconstruct the PPA sweep across the integrated pulse profiles.
1 Introduction
Pulsars exhibit broad-band coherent radio emission ranging from tens of MHz to tens of GHz and is highly polarized. It is usually observed that pulse widths at higher frequencies are smaller than that at lower frequencies (see Mitra & Rankin 2002 for a recent review). This phenomenon is termed as radius to frequency mapping (RFM) according to which emission at progressively higher frequencies arise closer to the stellar surface. The polarization position angle (PPA) of the linear polarization for several pulsars is seen to execute a smooth ‘S-shaped’ curve which has been interpreted as evidence for highly beamed emission arising from dipolar magnetic field lines as per the rotating vector model (RVM) proposed by Radhakrishnan & Cooke (1969). Fitting the RVM model to the PPA traverse can be used to find the geometrical angles of the neutron star namely the angle between the rotation axis and the dipolar magnetic axis and the angle between the rotation axis and the observers line-of-sight. RVM and RFM together has been extensively used to find radio emission heights in pulsars and the shape of the pulsar beam. Canonical values for emission heights are found to be 50 times the stellar radius and the emission beam is thought to be organized in the shape of nested cones of emission, with a central core emission.
Whilst RFM is more commonly observed in pulsars (barring a few exceptions) there are significant deviations from the RVM observed in PPA traverses in pulsars. In some cases across the pulse the PPA traverse is seen to have 90∘ jumps and/or two orthogonal PPA tracks. Careful study has shown that each of the PPA track are in agreement with the RVM (Gil & Lyne 1994). The other kind of deviation is in the form of wiggles and kinks (non-orthogonal departures) observed in the PPA traverse. In this paper we will concentrate on the latter kind of deviation observed and put forward a possible scenario which can explain such deviations.
2 The BCW model and the RVM curve
The RVM model has been further advanced by Blaskiewicz et al. (1991, hereafter BCW) where they included first order special relativistic effects into account. The model predicts that due to aberration and retardation (A/R) effects the PPA traverse depends on the emission height and the pulsar period (in sec) as,
| (1) |
Here and are arbitrary position angle and longitude phase offsets and is the longitude of the pulse. The angle and is the velocity of light. Note that the above equation reduces to the RVM for . It is immediately obvious from the above equation that changes in across the pulse will result in distortion of the PPA traverse. Also if is fixed, then the distortions will be larger for faster pulsars, as expected from the A/R effects.
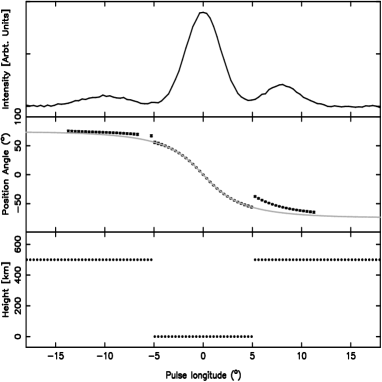
However across the pulse is an unknown. It is thought that the central core emission arises much below the conal emission. In Figure 1 we show an example of how the PPA curve will be distorted if emission from different parts of the pulse originated from two distinctly different heights. To refine the above concept of emission arising from different heights we put forward the following model,
(a) We note a pulse profile can be decomposed as a set of Gaussians (Kramer 1994). Further each Gaussian can be attributed to either cone or core emission. These core and cone can arise from different heights.
(b) For every ith longitude in the pulse, the resultant emission height is an intensity (I) weighted quantity given as,
| (2) |
Here the index refers to the Gaussian component and corresponds to the emission height attributed to that component (which correspond to height of the cone or core component). In Figure 1 we show an example on how the PPA traverse behaves when equation 2 is applied. It should be noted that the PPA traverse strongly depends on the parameters , and which are highly correlated to each other. Distortions of the PPA traverse due to height dependent emission has also been investigated by Xu. et. al. (1997).
 |
 |
3 Application of BCW model to pulsars
Most of the time the distortions in the PPA traverse seem to occur below the central core component in pulsars. While it is seen in a few normal pulsars (NP), it is more commonly seen in millisecond pulsars (MSP). Also in MSP’s the PPA traverse is seen to be flat.
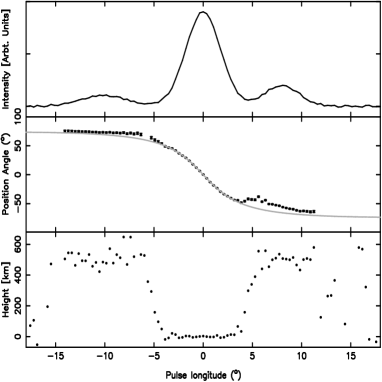
PSR J1022+1001 a millisecond pulsar with a period of 16 msec at 408 MHz is a classical example where the PPA traverse shows distortions below the central core component, as shown in Figure 2 (left plot). The kinky nature of the PPA traverse seen below the central core component. This pulsar can be adequately described by fitting three Gaussians, two outer ones comprising of one cone and the inner core. On the right hand plot of Figure 2 we show simulation of the PPA traverse using equation 2 assuming that the central core emission arises lower than the outer cone emission. This way we are able to generate the kinky feature in the PPA traverse. However we emphasize here that given the simple model that is being used we are only able to match the gross properties of the PPA traverse and do not claim to find the exact solution for , and . For this a more sophisticated model needs to be considered.
 |
 |
4 Conclusion
Using a simple model we have been able to produce the kinkiness in the PPA traverse towards the central region of the pulse profiles which is quite often observed. As a consequence we are able to conclude the following:
(a) The central (or core) emission arises lower than the outer conal emission confirming a suggestion put forward by several people (see for example Rankin 1993).
(b) The PPA traverse results from emission arising over a broad range of heights as has been recently suggested by Mitra & Li (2003).
Recently the central kinky feature seen in PSR J1022+1001 was interpreted as evidence for ‘return currents’ in pulsars by Ramachandran & Kramer (2003). Here we show that by considering height dependent emission regions similar kinky features can be obtained and it is not necessary to invoke return current effects to explain this feature.
References
Blaskiewicz, M., Cordes, J. M., & Wasserman, I. 1991, ApJ, 370, 643
Gil, J. A. & Lyne, A. G. 1995, MNRAS, 276, L55
Gould, D. M. & Lyne, A. G. 1998, MNRAS, 301, 235
Mitra, D. & Li, X. H., 2003, A&A in press
Mitra, D. & Rankin, J. M. 2002, ApJ, 577, 322
Kramer, M. 1994, A&AS, 107, 527
Radhakrishnan, V. & Cooke, D. J. 1969, ApJL, 3, 225
Ramachandran, R. & Kramer, M., 2003, A&A, 407, 1085
Rankin, J. M. 1993, ApJ, 405, 285
Xu, R. X., Qiao, G. J. & Han, J. L., 1997, A&A, 323, 395