CCD photometric study of the open clusters Basel 4 and NGC 7067
Abstract
In this paper we present CCD photometry in the region of two young open star clusters Basel 4 and NGC 7067 for the first time. Our sample consists of 4000 stars down to 21 mag. Stellar surface density profile indicates that radius of Basel 4 and NGC 7067 are about 1.8 and 3.0 arcmin respectively. The versus diagrams indicate that metallicity of NGC 7067 is solar while that of Basel 4 is 0.008. We estimate the mean value of = 0.450.05 and 0.750.05 mag for Basel 4 and NGC 7067 respectively. The analysis of 2MASS data in combination with the optical data in both the clusters yields = 0.300.20 mag and = 1.600.20 mag for Basel 4 while = 0.400.20 mag and = 2.100.20 mag for NGC 7067. Furthermore, colour excess diagrams show a normal interstellar extinction law towards both the clusters.
Using the intrinsic colour-magnitude diagrams of the cluster members, we estimated the
distances of the clusters as 3.00.2 and 3.60.2 Kpc for Basel 4 and NGC 7067
respectively. By fitting the proper metallicity isochrones to
the bright cluster members we estimated the age of the clusters as 20050 and 10025
Myr for Basel 4 and NGC 7067 respectively. The mass function slope which is derived by
applying the corrections of field star contamination and data incompleteness
are and for Basel 4 and NGC 7067 respectively. The
values of mass function slopes are thus not too different from the Salpeter’s (1955) value.
Mass segregation is observed in both the clusters which may be due to the
dynamical evolutions or imprint of star formation processes or both.
keywords:
Star clusters - individual: Basel 4 and NGC 7067 - star: Interstellar extinction, luminosity function, mass function, mass segregation - HR diagram.1 Introduction
Open clusters are ideal objects for the study of Galactic disk. The young open clusters are used to determine spiral arm structure, to investigate the mechanisms of star formation and its recent history, and to constrain the initial luminosity and mass function in aggregates of stars etc. For such studies, it is important to know the basic parameters of the clusters. The Colour-Magnitude (CM) and Colour-Colour (CC) diagrams of an open cluster are valuable tools for obtaining their basic informations, such as its distance and age, and for studying both interstellar extinction in the direction of cluster and stellar evolution. An important aspect for understanding star formation and stellar evolution is the question: how many stars of which masses formed or exist in an ensemble of stars ? A function which described the frequency distribution of stellar masses is called the stellar mass function. Star clusters are suitable objects for mass function determination as members formed (more or less) at the same time and from the same cloud. In addition to this, study of mass segregation in open clusters provides a clue about the spatial distribution of high and low mass stars within the clusters. Generally, it is found that high mass stars are concentrated towards the center of the clusters in comparison to lower mass stars. The cause of such kind of distribution is still not well understood whether it is due to dynamical evolution or imprint of star formation itself.
| Cluster | IAU | OCL | l | b | Trumpler | Radius | Distance | log(age) | |
|---|---|---|---|---|---|---|---|---|---|
| (deg) | (deg) | class | (arcmin) | (Kpc) | (mag) | (yrs) | |||
| Basel 4 | C0545+302 | 455 | 179.23 | 1.20 | II 1p | 2.5 | 5.6 | 0.53 | 7.0 |
| NGC 7067 | C2122+478 | 208 | 91.19 | -1.67 | II 1p | 1.5 | 1.3 | 0.85 | 7.5 |
In the light of above discussions, we conducted CCD stellar photometry in two young open star clusters Basel 4 and NGC 7067 aiming to investigate the cluster’s basic parameters (e.g. reddening, distance and age), mass function and mass segregation etc. The existing basic informations on both the clusters are given in Table 1. The plan of the paper is as follows. In Sec. 2 we summarize the previous studies of Basel 4 and NGC 7067, while Sec. 3 is dedicated on the observation and data reduction strategies. Sec. 4 deals with the determination of clusters basic parameters as well as detail study of interstellar extinction, mass function and mass segregation in the clusters under study. Finally, Sec. 5 summarizes our findings.
2 Earlier investigations
Basel 4: This cluster was studied by Svolopoulos
(1965) photographically first in RGU system. According to him the location of this cluster
coincides with spiral arm +III which could be expected if existing at all
at a similar distance. In any case, it is remarkable that typical
representatives of the galactic disk population are located so far out in the
direction of the galactic anticenter. He classified this cluster as a III 2m. In addition
to this, he also concluded that Basel 4 is 2107 yrs old, and has total
apparent diameter of 6′.4 at a distance of 5.9. To our
knowledge no other studies have been carried out so far.
NGC 7067: This cluster was first studied by Becker (1963). It is a poor young open cluster lying in Cygnus spiral arm. It was again revisited by Becker (1965) and indicated that the earliest spectral type of the cluster member is b0.5. He also estimated the cluster angular diameter of 2′.1, which corresponds to a linear diameter of 2.6 pc. Hassan (1973) also studied this cluster photoelectrically and derived a distance of about 4.4 Kpc having mag and age less than years. Dias et al. (2002) mentioned a distance of 1.3 Kpc for this cluster. The distance determination to the cluster is thus quite uncertain.
3 Optical observations and data reductions
3.1 CCD Photometric observations
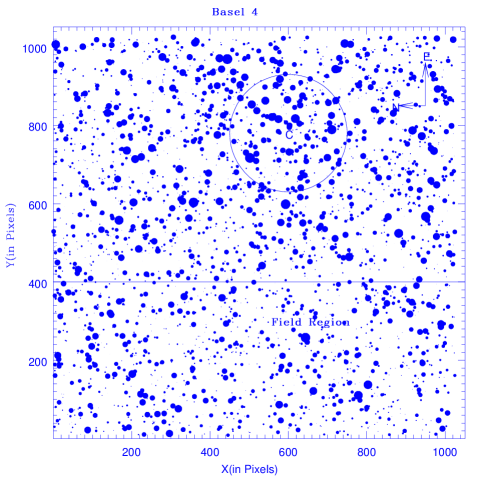
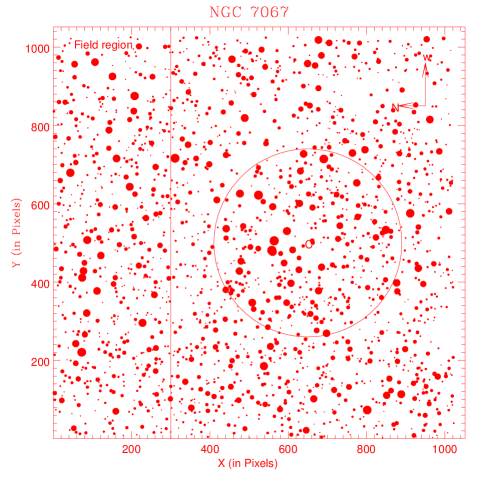
We used CCD imaging to obtain Johnson and Cousins photometry of the stars in the region of the open clusters Basel 4 and NGC 7067 on 02/03 Jan 2000 and 11/12 Oct 2001 respectively. The data were obtained using 2K2K CCD system at the f/13 Cassegrain focus of the 104-cm Sampurnanand telescope of the State Observatory, Naini Tal. Log of CCD observations is given in Table 2. The 0′′.36/pixel plate scale resulted in a field of view of 12′.312. The read-out noise and gain of the CCD are 5.3 e- and 10 e-/ADU respectively. For the accurate photometric measurements of fainter stars, 2 to 3 deep exposures were taken in each passband. Furthermore, observations were taken in 22 pixel binning mode to improve the S/N ratio. An identification map of cluster and field regions for both the clusters are shown in Fig 1. Besides them, a number of standard star field were also observed for calibration purposes. We observed M67 (open cluster) and field PG0231051 of Landolt (1992) for calibrating Basel 4 and NGC 7067 respectively. The mag range of stars used for calibration is 1113 mag in M67 and 1216 mag in PG0231051 while the colour range is 0.51.1 mag in M67 and 0.52.0 in PG0231051. Thus, the standard stars in these fields provide a good magnitude and colour coverage, essential to obtain reliable photometric transformations. The standard field are also observed in at different airmasses to obtain a reliable estimate of the atmospheric extinction coefficients. For correcting the bias level to the image, a number of bias frame were taken during the observations while for the flat field correction, a number of flat frames were taken on the twilight sky in each filter.
| Region | Filter | Exposure Time | Date |
| (in seconds) | |||
| Basel 4 | 18002, 3001 | 02/03 Jan 2000 | |
| 12002, 1801 | ,, | ||
| 9002, 1201 | ,, | ||
| 2403, 601 | ,, | ||
| 2403, 601 | ,, | ||
| NGC 7067 | 18003, 3002 | 11/12 Oct 2001 | |
| 12003, 2402 | ,, | ||
| 9003, 1802 | ,, | ||
| 6003, 1202 | ,, | ||
| 3003, 602 | ,, |
3.2 Data Reductions
The CCD images were processed using IRAF data reduction package. Then, for a given filter, frame of the same exposure time were combined into one, to improve the statistics of the faintest stars. Instrumental magnitudes were derived through Point Spread Function (PSF) fitting using DAOPHOT (Stetson 1987) within MIDAS. During the process of determining PSF, we used several well isolated stars to construct a single PSF for the entire frame on each exposure. The bright stars were measured on the frames with short exposure times, as they were saturated in the longer exposure frames.
For transforming the instrumental magnitude to the standard magnitude, the photometric
calibration equations are as follows:
Where and are the standard magnitudes and and are the instrumental aperture magnitudes normalised for 1 second of exposure time and is the airmass. We have ignored the second order colour correction terms as they are generally small in comparison to other errors present in the photometric data reduction. The errors in zero point and colour coefficients are estimated from the deviation of data points from the linear relation and are 0.01 mag. Using these transformation equation, we calibrated the CCD instrumental magnitudes. For generating the local standards, we selected many well isolated stars in the observed region and used the DAOGROW programme for the construction of an aperture growth curve required for determining the difference between aperture and profile fitting magnitudes. Table 3 gives the photometric errors as a function of magnitude. The internal errors estimated on the S/N ratio of the stars as output of the ALLSTAR mainly produce the scatter in the various CC and CM diagrams of the clusters. It can be noticed that the errors become large ( 0.1 mag) for stars fainter than = 20 mag, so the measurements should be considered unreliable below this magnitude. The final photometric data is available in electronic form at the WEBDA site http://obswww.unige.ch/webda/ and also from the authors. The format of the table is listed in Table 4 for Basel 4 and NGC 7067.
3.3 Comparison with previous photometric study
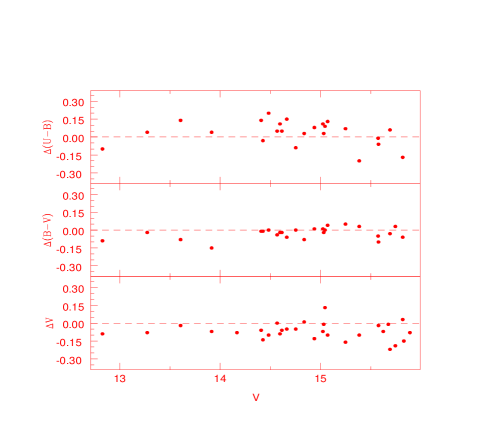
As mentioned in Sec. 2, only NGC 7067 has photoelectric data given by Becker (1965) and we compared our data with this data. Table 5 presents average differences (in the sense: our values minus those of other) along with their standard deviations. The difference in , and are plotted in Fig 2. Table 6 and Fig. 2 indicate that our magnitudes are systematically brighter by 0.05 mag without any dependence on the stellar magnitude. The values show a good agreement with the photoelectric data while show a decreasing trend with the mag.
| Magnitude range | U | B | V | R | I |
|---|---|---|---|---|---|
| 12.0 | 0.01 | 0.01 | 0.01 | 0.01 | 0.01 |
| 12.0 - 13.0 | 0.01 | 0.01 | 0.01 | 0.01 | 0.01 |
| 13.0 - 14.0 | 0.01 | 0.01 | 0.01 | 0.01 | 0.01 |
| 14.0 - 15.0 | 0.01 | 0.01 | 0.01 | 0.01 | 0.01 |
| 15.0 - 16.0 | 0.01 | 0.01 | 0.01 | 0.01 | 0.01 |
| 16.0 - 17.0 | 0.02 | 0.01 | 0.01 | 0.01 | 0.02 |
| 17.0 - 18.0 | 0.03 | 0.02 | 0.02 | 0.02 | 0.03 |
| 18.0 - 19.0 | 0.04 | 0.05 | 0.03 | 0.05 | 0.06 |
| 19.0 - 20.0 | 0.05 | 0.09 | 0.05 | 0.09 | 0.08 |
3.4 Near - IR data
We have used the Two Micron All Sky Survey (2MASS) (1.25 m), (1.65 m) and s(2.17 m) data for both the clusters Basel 4 and NGC 7067. 2MASS data is taken from observations with two highly - automated 1.3-m telescopes one at Mt Hopkins, AZ, and second at Cerro Tolalo Inter-American Observatory (CTIO), Chile. The data are complete up to 16.0 mag in , 15.5 mag in and 15.0 in . The uncertainty is 0.155 mag for a star of 16.5 mag. The magnitudes are converted into magnitude following Persson et al. (1998). 2MASS data is available at web site http://www.ipac.caltech.edu/2MASS/.
| Star | X | Y | Mem | |||||
|---|---|---|---|---|---|---|---|---|
| (pixel) | (pixel) | (mag) | (mag) | (mag) | (mag) | (mag) | ||
| Basel 4 | ||||||||
| 1 | 1.87 | 701.86 | 19.64 | * | * | 0.69 | 1.61 | nm |
| 2 | 2.01 | 519.82 | 18.76 | * | * | 0.40 | 1.17 | nm |
| 3 | 2.71 | 790.32 | 20.66 | * | * | 0.48 | 1.52 | nm |
| 4 | 2.87 | 30.33 | 19.63 | * | * | 0.58 | 1.21 | nm |
| 5 | 3.34 | 877.65 | 20.33 | * | * | 0.33 | 1.34 | nm |
| NGC 7067 | ||||||||
| 1 | 1.69 | 835.80 | 19.37 | * | * | 0.68 | 1.61 | nm |
| 2 | 3.47 | 214.41 | 19.57 | * | * | 0.83 | 1.93 | nm |
| 3 | 3.87 | 116.54 | 17.60 | * | * | 1.24 | 2.91 | nm |
| 4 | 3.94 | 99.46 | 19.33 | * | * | 0.88 | 1.87 | nm |
| 5 | 4.01 | 496.79 | 20.22 | * | * | 0.78 | 1.70 | nm |
| Cluster | Comparison data | range | |||
|---|---|---|---|---|---|
| Mean(N) | Mean(N) | Mean(N) | |||
| NGC 7067 | Becker (1965) | 14.0 | 0.060.03(4) | 0.100.03(4) | 0.070.14(4) |
| 14.0 15.0 | 0.060.04(11) | 0.020.02(10) | 0.070.08(10) | ||
| 15.0 16.0 | 0.070.09(14) | 0.0060.04(10) | 0.060.12(9) |
4 Analysis of the data
4.1 Cluster radius and radial stellar surface density
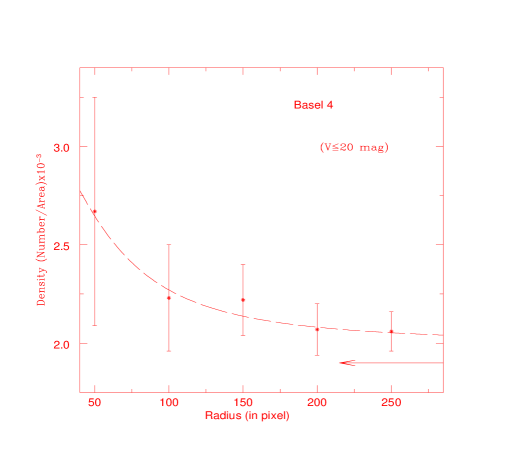
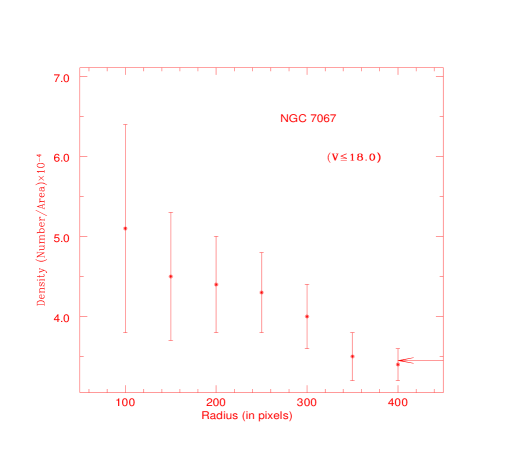
For a reliable determination of cluster parameters it is essential to know about the radial extent of the cluster. According to Mermilliod (1995), Basel 4 and NGC 7067 has a diameter of 5 and 3 arcmin, so our study covers the entire cluster region. To estimate the cluster radius, we derive the surface stellar density by performing star counts in concentric rings around the estimated center of the cluster, and then dividing by their respective areas. The center of the cluster is determined iteratively by calculating average X and Y position of the stars within 300 pixels from an eye estimated center, until they converged to a constant value. The pixel coordinate of the cluster center obtained in this way are (600, 780) and (690, 700) for Basel 4 and NGC 7067 respectively. There may be few tens of pixels error in locating the cluster center. Center of the clusters are marked by ”C” in the identification maps (Fig 1). The radial density profile and the corresponding Poisson error bars are depicted in Fig 3. A clear radius density gradient present in Basel 4 confirms the existence of clustering. In NGC 7067 the density profile decreases with radius slowly up to the limit of the covered region. Following Kaluzny (1992), we describe the (r) of an open cluster as:
where the cluster core radius is the radial distance at which the value of becomes half of the central density . We fit this function to the observed data points in the cluster Basel 4 and use minimization technique to determine and other constants. As can be seen in Fig 3, the fitting of the function is satisfactory for Basel 4. Such fitting could not be done in NGC 7067 due to large errors in the values of . In the cluster Basel 4, values of flatter at larger radii indicating probably the level of field star density in the cluster direction shown by arrow in Fig 3. The field star density thus obtained is per pixel2 for Basel 4. In the case of NGC 7067, the field star density has been estimated as per pixel2 based on the last two data points of its radial density profile in Fig 3. The radius at which the value of becomes approximately equal to the field star density has been considered as the cluster radius. The values determined in this way are 1′.8 and 3′.0 for Basel 4 and NGC 7067 respectively. Present radius estimates is lower with the value listed in Table 1 for Basel 4 while in the case of NGC 7067 our estimated value is larger (see Table 1).
As the observed area is much larger than the cluster area, we have considered stars having more than 2.5 and 1.6 cluster radius as field stars for the cluster Basel 4 and NGC 7067 respectively (see Fig 1). The areas of the field regions are 4.2105 and 3.1105 pixel2 for the cluster Basel 4 and NGC 7067 respectively. For Basel 4, the closest boundary of the field region is about 4′.5 away from the cluster center in the west direction while for NGC 7067, it is about 5′.0 away in the north direction. For the further analysis we have considered the stars laying within cluster radius.
| Basel 4 | NGC 7067 | |||||||||||||
| range | Cluster region | Field region | Cluster region | Field region | ||||||||||
| 12 - 13 | 0 | 2 | 0 | 0 | 0 | 0 | 2 | 0 | 1 | 2 | 0 | 0 | 0 | 1 |
| 13 - 14 | 0 | 2 | 0 | 0 | 0 | 0 | 2 | 0 | 2 | 3 | 1 | 1 | 4 | 1 |
| 14 - 15 | 0 | 4 | 3 | 0 | 0 | 1 | 4 | 0 | 4 | 11 | 0 | 0 | 6 | 4 |
| 15 - 16 | 0 | 8 | 5 | 0 | 2 | 3 | 6 | 0 | 3 | 8 | 0 | 1 | 4 | 2 |
| 16 - 17 | 0 | 11 | 4 | 1 | 5 | 3 | 6 | 0 | 12 | 8 | 0 | 4 | 16 | 8 |
| 17 - 18 | 0 | 16 | 8 | 4 | 7 | 4 | 9 | 0 | 17 | 11 | 1 | 7 | 19 | 10 |
| 18 - 19 | 2 | 17 | 5 | 7 | 9 | 2 | 8 | 5 | 35 | 20 | 2 | 17 | 36 | 18 |
| 19 - 20 | 3 | 22 | 3 | 9 | 9 | 1 | 13 | 18 | 44 | 19 | 10 | 23 | 61 | 21 |
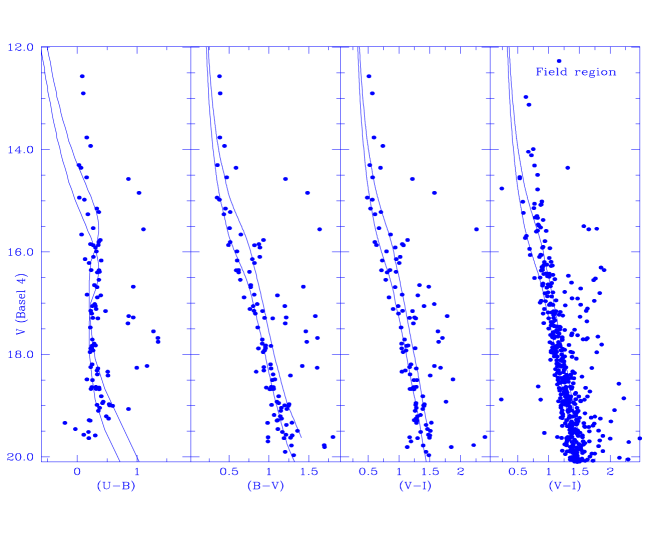
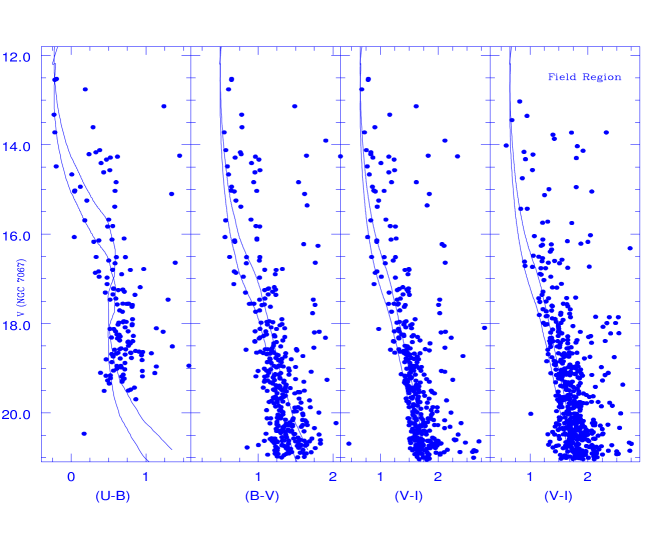
4.2 Apparent CM diagrams of the cluster regions
The apparent CM diagrams of Basel 4 and NGC 7067 for the stars present within the cluster radius are shown in Fig 4. The detection in filter is not as deep as in because of the low quantum efficiency of the CCD detector in region. So, there are large number of stars without any measurements. A well defined cluster MS contaminated by field stars is clearly visible in the CM diagrams of Basel 4 while in NGC 7067 the MS is not so well populated because of the poorness of the cluster. In the cluster NGC 7067, the stars on the red side of the MS appear to form a sequence parallel to the MS and that can be ascribed due to Galactic disk field stars. The field star contamination increases with decreasing brightness. The cluster sequence fainter than 16 mag in Basel 4 and 18 mag in NGC 7067 have larger scatter. This may be due to photometric errors as well as field star contamination. It is difficult to separate field stars from the cluster members. For the separation of cluster members from the field stars, precise proper motion and/or radial velocity measurements of these stars are required. In the absence of such data for these clusters, we selected members by defining the binary sequence. It has been defined by shifting the blue envelope with 0.8 mag vertically which is shown in the CM diagrams of the clusters. Some stars, in spite of their ambiguous positions could not definitively be rejected as likely cluster members. From the , diagram of the field region, statistically expected number of field stars among the photometric cluster members has been given in Table 6. The frequency distribution of the field star contamination in different part of the CM diagram can be estimated from the Table 6. It is thus clear that all photometric probable members can not be cluster members and non-members should be subtracted in the studies of cluster MF etc. However, probable members located within a cluster radius from its center can be used to determine the cluster parameters, as they have relatively less field star contamination and this has been done in the sections to follow.
4.3 Interstellar extinction towards the clusters
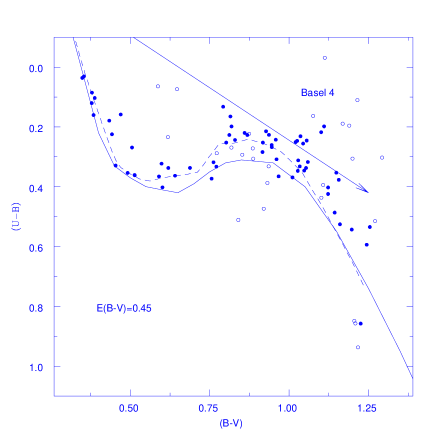
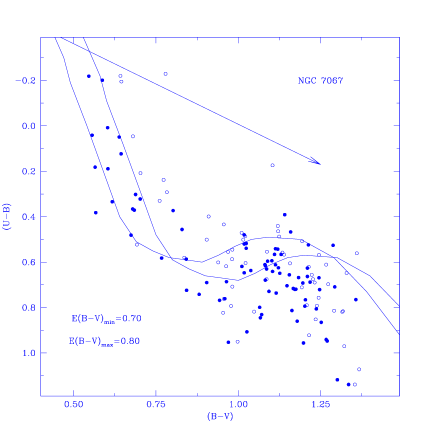
Fig 5 shows the versus diagrams for determining the interstellar extinction using the probable cluster members. We fit the intrinsic zero-age main-sequence (ZAMS) given by Schmidt-Kaler (1982) valid for stars of luminosity class V to the MS stars of spectral type earlier than A0 assuming the slope of reddening as 0.72.
In the cluster Basel 4, ZAMS given by Schmidt-Kaler (1982) is not fitting well for the stars of spectral type A, F and G. Excess in colour is clearly visible for the stars of mag. This indicates that the cluster is metal deficient. The UV excess determined with respect to Hyades MS turns out to be 0.1 mag. Using the [Fe/H] versus relation of Carney (1979) we estimated [Fe/H] which correspond to Z 0.008. To estimating the reddening in the direction of this cluster we therefore fitted the ZAMS given by Schaerer et al. (1993) for Z 0.008 which is shown by short dash lines in the two colour diagram of Basel 4. The ZAMS of Z 0.008 fits nicely and provide the reddening for this cluster which is in agreement with the earlier findings (see Table 1).
Unlike Basel 4, in the cluster NGC 7067, ZAMS given by Schmidt-Kaler (1982) for the solar metallicity fits both early and late type stars. The fitted values of vary from 0.70 to 0.80 mag. The mean value is 0.05 mag. Our mean reddening estimate for the imaged region agree fairly well with values estimated earlier by others (see Table 1).
We investigate the nature of interstellar extinction law towards the clusters, by considering the stars having spectral type earlier than A0. This has been selected from their position in the versus and apparent CM diagrams which reveals that bright stars with 16.0 mag and 0.60 mag in Basel 4 and with 16.5 mag and mag in NGC 7067 are needed stars. The number of such stars are 11 and 12 in Basel 4 and NGC 7067 respectively. The intrinsic colours for these stars have been determined using photometric Q-method (cf. Johnson & Morgan 1953; Sagar & Joshi 1979) and the calibrations given by Caldwell et al. (1993) for , and with . The mean values of the colour excess ratios derived in this way are listed in Table 7 for both the clusters. They indicate that the law of interstellar extinction in the direction of the clusters under discussion is normal.
| Objects | |||
|---|---|---|---|
| Normal interstellar | 0.72 | 0.65 | 1.25 |
| Basel 4 | 0.710.05 | 0.680.04 | 1.330.10 |
| NGC 7067 | 0.690.04 | 0.560.02 | 1.330.08 |
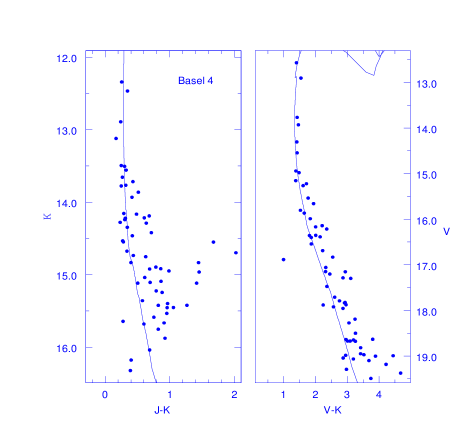
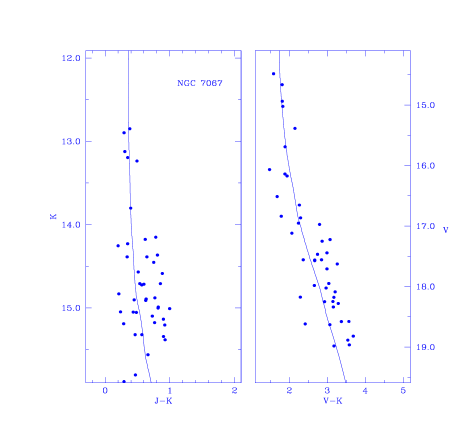
4.3.1 Interstellar extinction in near - IR
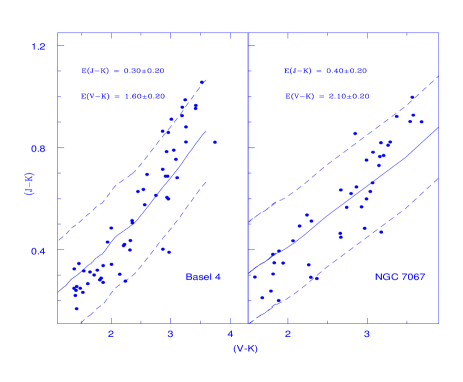
By using the optical and infrared data, we estimated the interstellar extinction for both clusters under study. There are 65 and 44 common stars in the cluster Basel 4 and NGC 7067 within the cluster radius respectively. Fig. 6 shows the vs diagrams and fit a ZAMS for metallicity Z = 0.008 taken from Schaerer et al. (1993) in the cluster Basel 4 and Z = 0.02 taken from Schaller et al. (1992) in the cluster NGC 7067. This gives = 0.300.20 mag and = 1.600.20 mag for the cluster Basel 4 and = 0.400.20 mag and = 2.100.20 mag for the cluster NGC 7067. For both clusters the ratio 0.200.30 is in good agreement with the normal interstellar extinction value 0.19 suggested by Cardelli et al. (1989). However, scattering is larger due to the error size in data.
4.3.2 The law of interstellar extinction
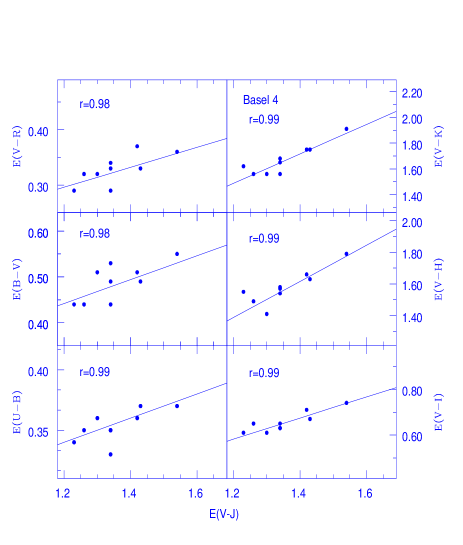
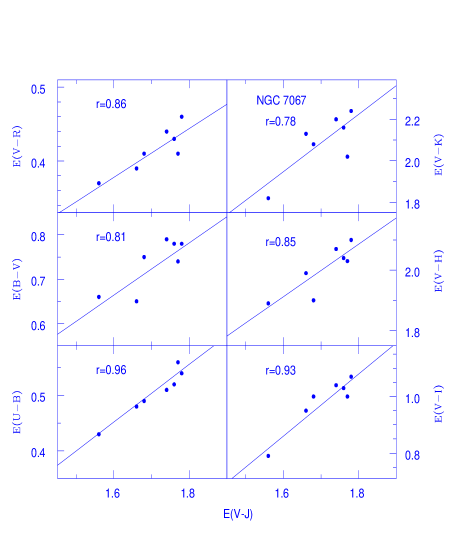
We used the colour excess ratio method described by Johnson (1968) for the study of interstellar extinction law in the direction of both clusters under study. For this we used the stars of spectral type earlier than A0. We determined the colour excesses by comparing the observed colours of the stars with its intrinsic colours derived from the MKK spectral type-luminosity class colour relation given by FitzGerald (1970) for and ; by Johnson (1966) for and ; and by Koornneef (1983) for , and . For normalisation, we selected the colour excess due to reasons described in Yadav & Sagar (2002). In Fig. 7 we plot the colour excess , , , , and against . In this Fig, straight line represents the least square linear fits to the data points. The values of correlation coefficient (r) and fit indicate that the data points are well represented by linear relation. The slopes of these straight lines as given in Table 8 represent reddening directions in the form of colour excess ratios. For comparison, the colour excess ratios given by Cardelli et al. (1989) for the normal interstellar matter are also listed in the Table 8. The present reddening directions agree well with those.
In addition to this we have also estimated the value of R to know about the nature
of interstellar extinction law in the direction of clusters under study. We used
the relation R = 1.1/ (Whittet & Breda 1980) which is generally
used at longer wavelengths. The average values of R = 3.51
0.30 (sd) and 3.040.22 (sd) for Basel 4 and NGC 7067 respectively are not too
different from the value 3.1 for normal extinction law.
In the light of above analysis, we conclude that interstellar extinction law is normal towards both Basel 4 and NGC 7067 in agreement with our earlier result.
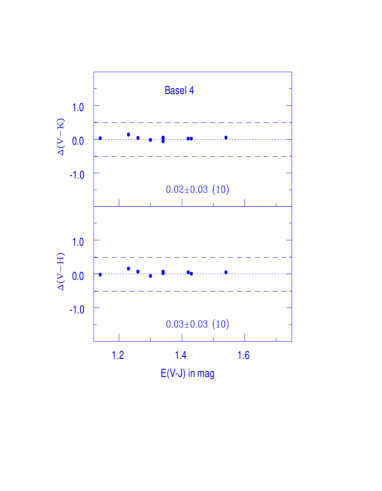
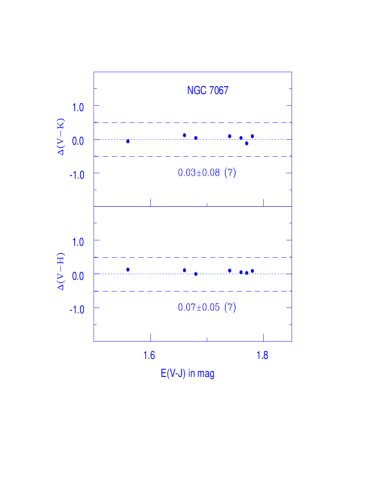
4.3.3 Near-IR excess Fluxes
An infrared excess is produced by the stars which are having their own envelope of gas and dust. To investigate the near-IR flux in the stars of the clusters under study, we plotted and against in Fig 8. The differences between the observed colour excess in and based on spectral classification and the derived colour excess from assuming normal extinction law are calculated. The differences can be considered statistically significant only if their absolute values are larger than 0.5 mag. The short dashed lines in Fig 8 represent the extent of expected errors. Observational uncertainties in magnitudes, inaccuracies in estimation of and errors in spectral classification may play major role in the determination of differences. An inspection of Fig 8 leads that the absolute values of and are close to zero of all the members. This indicate that there is no signature of near-IR excess fluxes.
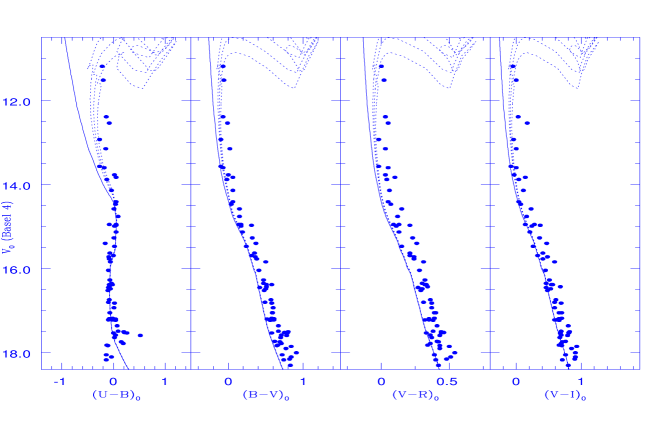
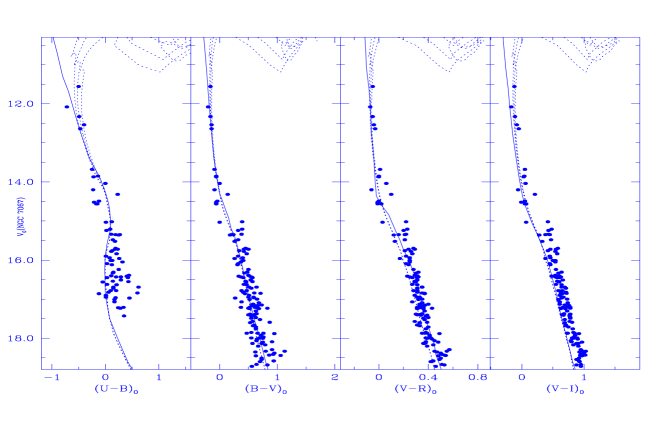
4.4 Distance to the clusters
The ZAMS fitting procedure was employed to derive the distances of the clusters. Fig 9
shows the intrinsic CM diagrams for Basel 4 and NGC 7067 which is plotted by considering
the probable cluster members. For converting apparent magnitude and ,
, and colours into intrinsic one, we used average values of
and following relations for (cf. Kamp 1974; Sagar & Joshi 1979),
Av and (Walker 1987) and (Alcalá et al. 1988).
= [X + 0.05]
where X = 0.62 0.30 for 0 0.09
and X = 0.66 + 0.080 for0
Av = [3.06 + 0.250 + 0.05];
and = [E1 + E2E]
where E1 = 0.6316 + 0.07130
and E2 = 0.0362 + 0.00780;
= 1.25[1 + 0.060 + 0.014]
The ZAMS for Z 0.008 is plotted in , 0; , 0; , 0 and , 0 diagrams of Basel 4 are taken from Schaerer et al. (1993). In , 0 and , 0 diagrams of NGC 7067, we fitted the solar metallicity ZAMS given by Schmidt-Kaler (1982) while that given by Walker (1985) was fitted in , 0 diagram. For , 0 diagram, we have calculated 0 using its relation with given by Caldwell et al. (1993). The good fitting of the ZAMS to the intrinsic CM diagrams was achieved for a distance modulus 0 as 12.40.2 and 12.80.2 mag for Basel 4 and NGC 7067 respectively. The corresponding distances are 3.00.2 Kpc and 3.60.2 Kpc. The fact that we were able to find faint probable cluster members allow us to get a better definition of the cluster lower main sequence which in turn improves the estimation of the distances. The distance of the cluster Basel 4 is estimated as 3.00.2 Kpc, which is smaller than the value 5.6 Kpc given by Svolopoulos (1965) based on RGU photographic photometry. We derived 3.60.2 Kpc distance for the cluster NGC 7067, which is also the value given by Lyngå (1987). The distance of this cluster is 1.3 Kpc given in the catalogue of Dias et al. (2002), which is much smaller than the value estimated by us.
| Objects | |||||||
|---|---|---|---|---|---|---|---|
| Normal value | 0.32 | 0.43 | 0.27 | 0.56 | 1.13 | 1.21 | 0.19 |
| Basel 4 | 0.260.02 | 0.360.02 | 0.250.02 | 0.490.05 | 1.16 0.04 | 1.240.04 | 0.200.30 |
| NGC 7067 | 0.300.01 | 0.430.02 | 0.240.08 | 0.570.03 | 1.17 0.03 | 1.220.05 | 0.200.30 |
4.5 Ages of the clusters
The ages of the clusters are determined with the aid of the isochrones in the intrinsic CM diagrams (Fig 9) of Z = 0.008 taken from Schaerer et al. (1993) for Basel 4 and Z = 0.02 taken from Schaller et al. (1992) for NGC 7067. The isochrones are computed by considering the mass loss and convective core overshooting. By fitting the isochrones to the cluster upper sequence of Fig 9, we found age of 20050 and 10025 Myr for Basel 4 and NGC 7067 respectively. For the clusters Basel 4 and NGC 7067, our estimated values are larger than the values given in Lyngå (1987) and Dias et al. (2002) catalogues.
Using the optical as well as near-IR data, we redetermined the distance and age of both the clusters. Fig 10 represents vs and vs CM diagrams. We have fitted the theoretical isochrones given by Schaerer et al. (1993) (Z = 0.008) of log(age) = 8.3 for Basel 4 and by Schaller et al. (1992) (Z = 0.02) of log(age) = 8.0 for NGC 7067. The apparent distance moduli and turn out to be 13.90.3 and 12.50.3 mag for Basel 4 and 15.00.3 and 13.00.3 mag for NGC 7067 respectively. By using the reddening estimated in the previous section we derive a distance of 3.10.2 and 3.70.2 Kpc for Basel 4 and NGC 7067 respectively. Both age and distance determination for both the clusters are thus in agreement with our earlier estimates. However, the scatter is larger because of the larger errors on the magnitudes.
4.6 Luminosity and Mass function of the clusters
Since, our first aim is to derive the luminosity function from star counts then it is necessary to draw our attention on the completeness of the derived star list. Due to the stellar crowding on the CCD frame and efficiency of the data reduction programmes, not all the stars of the frame may be detected. For deriving the completeness factor (CF) we used vs CM diagram instead of others because it is deepest. Detail procedure of deriving CF is given below.
4.6.1 Determination of photometric completeness
To know about the completeness of our photometric data, we performed experiments with artificial stars using ADDSTAR routine in DAOPHOT II. In this experiment a number of stars are added randomly in different magnitude bin to the CCD original frame. For the band image the added stars have same geometrical positions but differ in brightness according to mean colour of the MS stars. In order to avoid overcrowding on the images by the additional stars, we added only of the number of actually detected stars. The luminosity distribution of the artificial stars has been chosen in such a way that more stars are inserted into the fainter magnitude bins. The photometric routines are run on these images with the same set of parameters as for the original images, and determined the number of the added stars that are found. We estimated the CF as the ratio between the number of artificial stars recovered simultaneously in the and passbands and the number of added stars per one magnitude bin. Table 9 lists the CF values for both cluster under study in band image. For determining the CF a number of methods have been described by various authors (cf. Stetson 1987; Mateo 1988; Sagar & Ritchler 1991; Banks et al. 1995) in a CM diagram. We adopted the procedure of Sagar & Ritchler (1991) as this method recovered the actual LF better with the mean error of 3 % up to CF 0.5 (Mateo 1988).
| mag range | Basel 4 | NGC 7067 |
|---|---|---|
| 13 - 14 | 0.98 | 0.99 |
| 14 - 15 | 0.98 | 0.99 |
| 15 - 16 | 0.97 | 0.98 |
| 16 - 17 | 0.94 | 0.95 |
| 17 - 18 | 0.92 | 0.93 |
| 18 - 19 | 0.90 | 0.91 |
| 19 - 20 | 0.87 | 0.89 |
4.6.2 Determination of Mass Function
To construct the luminosity and mass function of the clusters we need to correct the luminosity distribution of our selected sample for field star contamination. To quantify the contamination we adopted the criterion described in Sec. 4.2. In , CM diagram we defined a strip for the MS of cluster region and same strip was also drawn in the CM diagram of corresponding field region as shown in Fig 4. Further, we determined the number of stars belongs to the strip in the cluster region as well as in the field region in each magnitude bin. In this way we can estimate the number of field stars present in various magnitude bins of the cluster region. The observed LFs of the cluster and field regions were also corrected for data incompleteness as well as for differences in area. True LF for the cluster was obtained by subtracting the observed LF of field region from the observed LF of cluster region. The MF slope has been derived from the mass distribution (). If represents the number of stars in a mass bin with central mass , then the value of slope is determine from the linear relation
log = (1+)log()constant
using the least-squares solution. The Salpeter (1955) value for the
slope of MF is = 1.35.
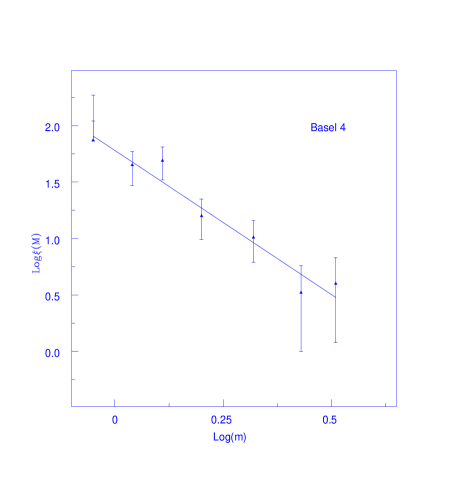
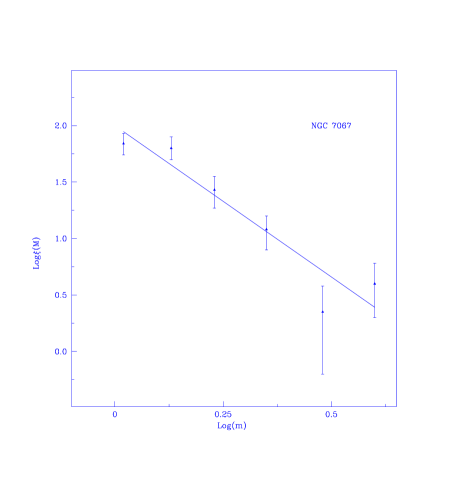
Theoretical models by Schaller et al. (1992) for NGC 7067 and by Schaerer et al. (1993) for Basel 4 along with the cluster parameters derived by us have been used to convert the observed luminosity function to the mass function. The plot of MFs of Basel 4 and NGC 7067 is shown in Fig. 11. The value of the MF slope along with the mass range and error are given in Table 10, where the quoted errors are derived from the linear least square fit to the data points. Our estimated value of MF slope is in agreement with the Salpeter (1955) value within the error for both the clusters. However, the error in MF slope is large due to poor statistics of cluster members.
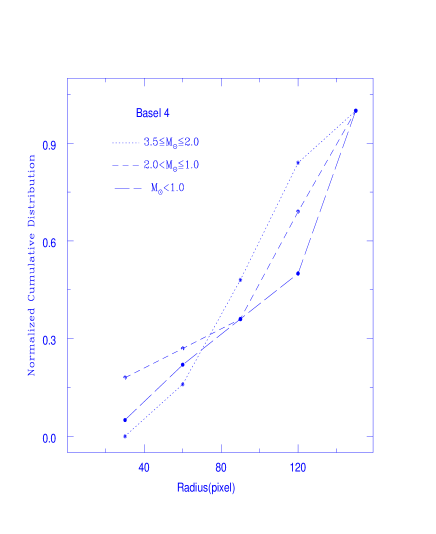
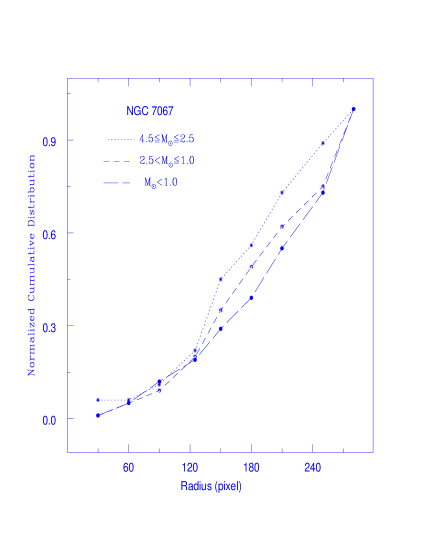
4.7 Mass segregation
In order to investigate the clusters dynamical evolution and mass segregation effect due to energy equipartition, we subdivided the stars into 3 mass range 3.5 M⊙2.0, 2.0 M⊙1.0 and M⊙1.0 for Basel 4 and 4.5 M⊙2.5, 2.5 M⊙1.0 and M⊙1.0 for NGC 7067. In Fig. 12 we present cumulative radial stellar distribution of stars for different masses. An inspection of Fig. 12 shows that both the clusters have mass segregation effect. To check whether these mass distribution represent the same kind of distribution or not we perform the Kolmogorov-Smirnov (K-S) test. This test shows that mass segregation has taken place at confidence level of 65% for Basel 4 and 70% for NGC 7067. Further, it is important to know whether existing mass segregation is due to dynamical evolution or imprint of star formation process.
One of the possible cause of mass segregation is the dynamical evolution
of clusters. Over the lifetime of a star cluster, encounters between its member
stars gradually lead to an increased degree of energy equipartition throughout
the cluster. The most important result of this process is that the higher-mass
cluster members gradually sink towards the cluster center and in the process
transfer their kinetic energy to the more numerous lower-mass stellar component,
thus leading to mass segregation. The time scale on which a cluster will have
lost all traces of its initial conditions is well represented by its relaxation
time . It is given by
where is the number of cluster members, h is the radius containing half of the cluster mass and is the mean mass of the cluster stars (cf. Spitzer & Hart 1971). The number of probable MS stars is estimated using the CM diagrams of the clusters after subtracting the contribution due to field stars and applying the necessary corrections for the data incompleteness. For determining the Rh, we assume that the Rh is equal to half of the cluster radius estimated by us. The angular values are converted to linear values using the cluster distances which are derived here. Inclusion of cluster members fainter than the limiting magnitude will decrease the value of and increase the value of . This will result in higher values of . Hence the values obtained here may be considered as the lower limit.
| cluster | Mass range | Mass Function slope | log TE |
|---|---|---|---|
| M⊙ | () | ||
| Basel 4 | 0.8 - 3.5 | 1.550.25 | 7.0 |
| NGC 7067 | 0.9 - 4.5 | 1.680.47 | 7.1 |
A comparison of cluster age with its relaxation time indicates that the relaxation time is smaller than the age of the clusters. Thus we can conclude that the clusters under study are dynamically relaxed. It may be due to the result of dynamical evolution or imprint of star formation processes or both.
5 Conclusions
In this paper we have presented CCD photometry for the stars in the fields of open
clusters Basel 4 and NGC 7067 for the first time. Using present CCD data in combination with
2MASS data we derive the following results:
(i) Using the versus colour-colour diagram, we determine the cluster metallicity Z 0.008 and 0.02 for Basel 4 and NGC 7067 respectively. The corresponding mean value of = 0.450.05 mag and 0.750.05 mag respectively. Interstellar extinction law has also been studied using optical as well as near-IR data and found that it is normal in the direction of both the clusters. Colour-colour diagram gives the colour excess = 0.300.20 mag and = 1.600.20 mag for Basel 4 and =0.400.20 mag and = 2.100.20 mag for NGC 7067.
(ii) Basel 4 and NGC 7067 are located at a distance of 3.00.2 and 3.60.2 Kpc respectively. The corresponding ages are 20050 and 10025 Myrs respectively. They are determined by fitting the isochrones of Schaerer et al. (1993) for Z 0.008 in Basel 4 and of Schaller et al. (1992) for Z 0.02 in NGC 7067. Using the 2MASS data we also derived the distance and age of both the clusters and they are in agreement with those derived using optical data.
(iii) The radial density profiles show that the radius of Basel 4 and NGC 7067 are 1′.8 and 3′.0 respectively which indicate that the clusters under study are compact. At the cluster distance, they correspond to linear radius of 1.6 and 3.2 pc respectively.
(iv) The values of MF slope are and 1.68 for Basel 4 and NGC 7067 respectively. They are determined by applying the corrections of data incompleteness and field star contamination and are in agreement with the Salpeter (1955) value.
(v) Mass segregation is observed in both Basel 4 and NGC 7067 in the sense that
massive stars tend to lie near the cluster center. The dynamical relaxation time indicate
that both the clusters are dynamically relaxed. Thus mass segregation might have occurred
due to dynamical evolution, or imprint of star formation or both.
Acknowledgments
We thank the referee for valuable comments which have improved the quality of this paper. We are grateful to Dr. Vijay Mohan for helping in data reduction. This study made use of 2MASS and WEBDA.
References
- [1] Alcalá J. M., Ferro A. A., 1988, Rev. Mex. Astro. Astrofis 16, 81
- [2] Banks T., Dodd R. J., Sullivan D. J., 1995, MNRAS 274, 1225
- [3] Becker W., 1963, Z. Astrophycs., 57, 117
- [4] Becker W., 1965, MmSAI, 36, 283
- [5] Caldwell A. R. John, Cousins A. W. J., Ahlers C. C., Wamelen P. van, Maritz E. J., 1993, SAAO Circ. No. 15
- [6] Cardelli J. A., Clayton G. C., Mathis J. S., 1989, ApJ 345, 245
- [7] Carney B. W., 1979, ApJ 233, 211
- [8] Dias W. S., Alessi B. S., Moitinho A., Lépine J. R. D., 2002, A&A , 389, 871
- [9] FitzGerald M. P., 1970, A A, 4, 234
- [10] Hassan S. M., 1973, A&AS, 9, 261
- [11] Johnson H. L., Morgan W. W., 1953, ApJ 117, 313a
- [12] Johnson H. L., 1966, ARAA, 4, 193
- [13] Johnson H. L., 1968, in Nebullae and Interstellar Matter, eds. B. M. Middlehurst and L. H. Aller, Univ. Chicago Press, p. 191
- [14] Kamp L. W., 1974, A&AS 16, 1
- [15] Kaluzny J., 1992, Acta Astron. 42, 29
- [16] Koornneef J., 1983, AA, 128, 84
- [17] Landolt A. U., 1992, AJ 104, 340
- [18] Lyngå G., 1987, in Catalog of open cluster data, Computer Based Catalogue available through the CDS, Strasbourg, France and through NASA Data Center GreenBelt, MaryLand, USA, 5th edition, vol. 4, p. 121
- [19] Mateo M., 1988, ApJ 331, 261
- [20] Mermilliod J. C., 1995, in Information and on - line data in Astronomy, Eds E. Egret and M. A. Albrecht, Kluwer Academic Press, p 227.
- [21] Persson S. E., Murphy D. C., Krzeminski W., Roth M., & Rieke M. J., 1998, AJ 116, 2475.
- [22] Sagar R., Joshi U. C., 1979, Ap&SS 66, 3
- [23] Sagar R. and Richtler T., 1991, A&A 250, 324
- [24] Salpeter E. E., 1955, ApJ 121, 161
- [25] Schaerer D., Meynet G., Maeder A., Schaller G., 1993, A&AS 98, 523
- [26] Schaller G., Schaerer D., Meynet G., Maeder A., 1992, A&AS 96, 269
- [27] Schmidt - Kaler Th., 1982, In: Landolt/Bornstein, Numerical Data and Functional Relationship in Science and Technology, New series, Group VI, Vol. 2b, Scaifers K. & Voigt H. H. (eds.) Springer - Verlog, Berlin, p. 14
- [28] Spitzer L. and Hart M. H., 1971, ApJ 164, 399
- [29] Stetson P. B., 1987, PASP 99, 191
- [30] Svolopoulos S. N., 1965, Z Astrophysics, 61, 97
- [31] Walker A. R., 1985, MNRAS 213, 889
- [32] Walker A. R., 1987, MNRAS 229, 31
- [33] Whittet D. C. B., van Breda I. G., 1980, MNRAS 192, 467
- [34] Yadav R. K. S. and Sagar R., 2002, MNRAS 337, 133