Radio Emission from the Milky Way
Abstract
In the last 5–10 years, wide-field imaging capabilities and effective mosaicing algorithms have made possible a variety of ambitious interferometric surveys of the Galaxy, resulting in images of unprecedented sensitivity and resolution. Here I discuss some of the highlights from these new surveys. Amongst the new results are the identification of many new supernova remnants in confused regions, spectacular low frequency images of the inner Galaxy with the VLA, and some remarkable new insights into the structure of the Galactic magnetic field from linear polarization.
Harvard-Smithsonian Center for Astrophysics, 60 Garden Street MS-6, Cambridge MA 02138, USA
1. Historical Overview
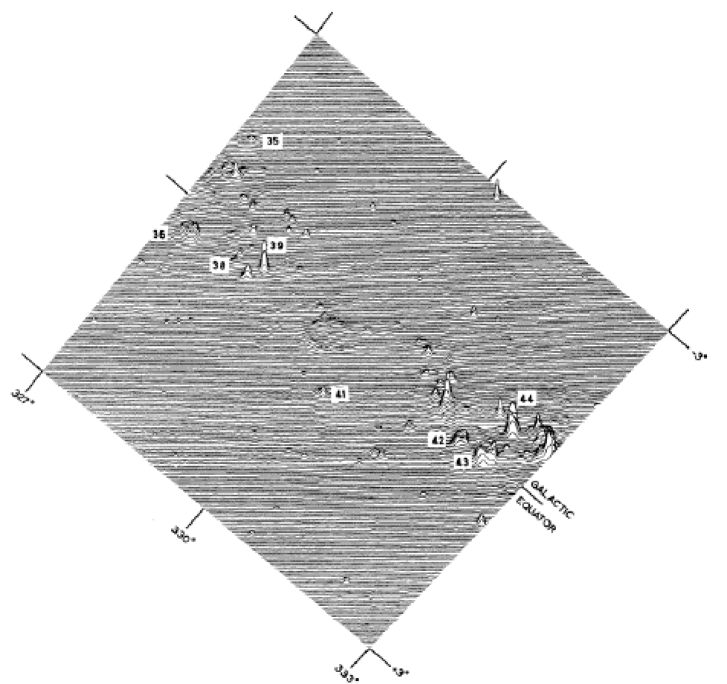
In the 1930s and 1940s, the pioneering efforts of Jansky and Reber demonstrated that the disk of the Milky Way was a strong source of radio emission. In the 1950s, a theoretical framework was developed which argued that this emission was due to the synchrotron process — this was soon confirmed when it was demonstrated that this emission was linearly polarized. Over the next few decades, various groups in both hemispheres proceeded to survey the radio emission from the Milky Way using both single-dish and pencil beam surveys, an example of which is shown in Figure 1. These surveys demonstrated that the radio emission from the Milky Way was comprised of three main components: thermal emission from individual H ii regions, synchrotron emission from discrete supernova remnants (SNRs), all superimposed on diffuse synchrotron emission from the relativistic interstellar medium (ISM).
While these surveys provided a very useful basis for identifying and classifying many Galactic sources, the lack of sensitivity and resolution in these data leaves serious deficiencies in our understanding of the populations of radio sources in our Galaxy. Specifically, since SNRs and H ii both trace massive star formation, these sources tend to be clustered in the same parts of the sky. This makes it difficult to identify both small-diameter (i.e. young) and faint (i.e. old) SNRs, important for understanding SNR birthrates and SNR lifetimes, respectively. Many sources are too compact to be identified as SNRs, H ii regions or background sources on a morphological basis alone, and there are too many of these sources to study each object individually at higher resolution and at other wavelengths. Many interesting objects have thus been overlooked, and only later identified serendipitously (e.g. Duncan & Green 2000; Crawford et al. 2001); no doubt many more such objects are still to be found. The net result is that studies based on the Galactic plane surveys of the 1970s and 1980s have resulted in incomplete catalogues, biased demographics and many overlooked objects (e.g. Helfand et al. 1989; Green 1991).
In the rest of this paper, I will discuss the ways in which new surveys are overcoming the limitations of these earlier efforts.
2. Synthesis Imaging Arrays
The most important advance in studying Galactic radio emission is that there are now high-fidelity synthesis imaging telescopes in both hemispheres. Most of these instruments have now carried out sensitive surveys of the Galactic plane. The immediate advantage of these observations is that one can image the full field of view of a single antenna element, but can obtain the spatial resolution of the longest baseline and the sensitivity corresponding to the total collecting area. Many interferometric surveys map large regions of the sky simply by imaging individual fields, and then “pasting” these fields together.
One of the most extensive such surveys was the Molonglo Galactic Plane Survey (MGPS) (Figure 2; Green et al. 1999), consisting of an 843 MHz image at a spatial resolution of , covering 330 deg2 of the southern Galaxy. While morphology alone does not always distinguish H ii regions from SNRs in such data, a simple comparison with IRAS images allows one to clearly differentiate between H ii regions (which are generally prominent infrared sources) and SNRs (which are usually not detected in IRAS data). In the MGPS, this process enabled the identification of 75 SNRs, 25% of which were newly discovered (Whiteoak & Green 1996). The VLA continuum survey of Becker et al. (these proceedings) is employing a similar approach at higher spatial resolution.
3. Single Dish Combination
While the longest baseline of an interferometric array sets the smallest scale detectable in the image, it is often not appreciated that the shortest baseline of the array sets the largest scale to which the image is sensitive. An image made from interferometer data alone will therefore miss large-scale structure, and the resulting flux densities and spectral index determinations will be incorrect. The only way to correct this problem is to map the same region with a single dish. As shown in Figure 3, the single-dish and interferometric data can then be combined to provide a complete picture of the distribution of radio emission on the sky.
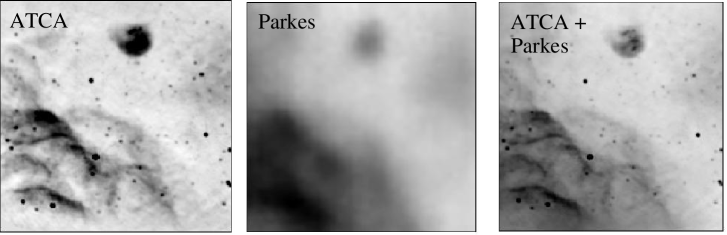
The most important demonstration of this process has been the Canadian Galactic Plane Survey (CGPS; Taylor et al. 2003). The CGPS team have gone to great efforts to ensure that at both 408 and 1420 MHz their synthesis data are properly combined with single-dish maps. With such data, SNRs and H ii regions can be clearly distinguished on the basis of their spectral indices alone, while with the proper imaging of structure on all scales, the relationship between individual objects and diffuse emission becomes clearly apparent.
4. Wide Field Imaging
A key limitation in surveys carried out with synthesis telescopes is the efficiency with which such surveys can cover large parts of the sky — both the MGPS and SGPS took many years to complete. However, several recent developments have greatly enhanced the efficiency and feasibility of such efforts.
First, some interferometers (most notably the ATCA) employ very rapid source switching, which minimises overheads and enables large mosaics. For example, the test region of the SGPS (McClure-Griffiths et al. 2001) consisted of 190 pointings, 40 snapshots per pointing and 30 seconds per snapshot, resulting in arcmin resolution images of the Galactic plane at a mapping speed of 0.5 deg2 per hour. Second, many arrays now offer very compact array configurations. This allows the plane to be quickly filled, minimising the number of snapshots needed per pointing. Finally, rather than covering large areas of the sky just by pasting together individual fields, new algorithms utilise the extra information contained in adjacent pointings, which greatly improves the coverage of the observation (Ekers & Rots 1979). As demonstrated by Cornwell (1988), this technique can be realised through joint deconvolution techniques, resulting in mosasiced images of far greater fidelity than maps generated by the “individual” approach.
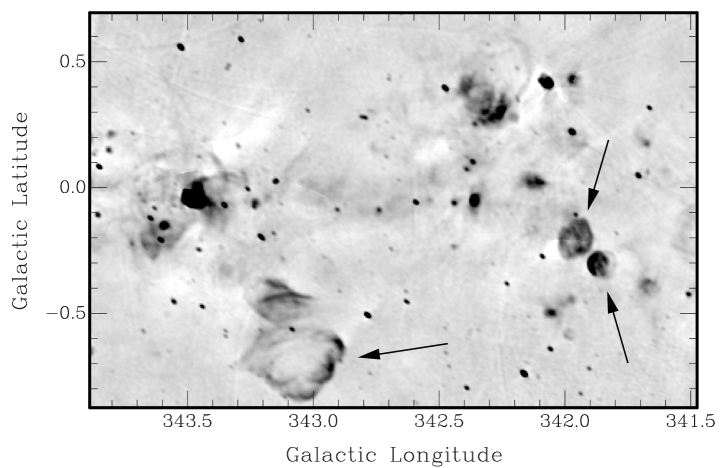
Since the linear diameter of the field of view is proportional to the observing wavelength, another way to map very large areas of the sky is to carry out synthesis imaging at low frequencies. For example, the 74-MHz system at the VLA provides a field of view of deg2 per pointing! Despite this obvious advantage, radio frequency interference, ionospheric distortion of the wavefront and the non-coplanarity of the VLA all make low-frequency imaging extremely challenging. A variety of concerted efforts have now addressed these issues, allowing spectacular wide-field images to be produced of the Galactic Centre and other complicated regions (e.g. LaRosa et al. 2000). This has given us the confidence to embark on a more ambitious 74/327 MHz Galactic plane survey with the VLA, which will ultimately cover the range (e.g. Brogan et al. 2001). Such a project should yield the identification of many new low surface brightness and steep spectrum sources, such as SNRs, pulsars, and high-redshift radio galaxies.
5. Polarimetry
The advent of high polarization purity, flexible correlators, and new algorithms have made it feasible to produce wide-field images of Stokes Q, U and V (e.g. Gaensler et al. 2001; Uyanıker et al. 2003). As shown in Figure 4, these images can appear completely different from the distribution of emission seen in Stokes I.
Not surprisingly, these images detect linear polarization from individual SNRs and from background point sources, the Faraday rotation towards which can be measured and can be used to map out the structure of the Galactic magnetic field (e.g. Brown & Taylor 2001). However, in addition to these features, we also see copious diffuse polarization with no counterpart in total intensity, produced by foreground Faraday rotation of the diffuse synchrotron background by warm ionized gas (Figure 4; Uyanıker et al. 2003). Many regions also show significant depolarization, resulting from small-scale changes in polarization position angle produced by turbulent foreground regions (Gaensler et al. 2001). Finally, several groups now see polarimetric structures corresponding to as yet unidentified magnetoionic structures (Gray et al. 1998). These polarimetric studies are thus enabling an entirely new way of viewing the ISM.
6. Conclusions
A variety of new techniques are now being employed in surveys of the radio emission from the Milky Way. These include:
-
•
Synthesis imaging surveys, which greatly improve on the resolution and sensitivity of earlier efforts.
-
•
Single-dish combination, which improves the spatial dynamic range and provides sensitivity to diffuse structure.
-
•
Mosaicing and low frequency imaging, which generate higher fidelity images and wider fields of view.
-
•
Polarimetric imaging, which is providing a whole new view of the magnetic Milky Way.
Only with the surveys which are consequently emerging are we finally now obtaining a complete picture of Galactic radio emission and its constituent components.
Acknowledgments.
The Australia Telescope is funded by the Commonwealth of Australia for operation as a National Facility managed by CSIRO. I acknowledge the support of the National Science Foundation through grant AST-0307358.
References
Brogan, C. L., Kassim, N., Lacey, C., Nord, M., & Lazio, J. 2001, BAAS, 199, #126.13
Brown, J. C., & Taylor, A. R. 2001, ApJ, 563, L31
Cornwell, T. J. 1988, A&A, 202, 316
Crawford, F., Gaensler, B. M., Kaspi, V. M., Manchester, R. N., Camilo, F., Lyne, A. G., & Pivovaroff, M. J. 2001, ApJ, 554, 152
Duncan, A. R., & Green. D. A. 2000, A&A, 364, 732
Ekers, R. D., & Rots, A. H. 1979, in Image Formation from Coherence Functions in Astronomy, ed. C. van Schooneveld (Dordrecht: Reidel), 61
Gaensler, B. M., Dickey, J. M., McClure-Griffiths, N. M., Green, A. J., Wieringa, M. H., & Haynes, R. F. 2001, ApJ, 549, 959
Gray, A. D., Landecker, T. L., Dewdney, P. E., & Taylor, A. R. 1998, Nature, 393, 660
Green, A. J. 1974, A&AS, 18, 267
Green, A. J., Cram, L. E., Large, M. I., & Ye, T. 1999, ApJS, 122, 207
Green, D. A. 1991, PASP, 103, 209
Helfand, D. J., Velusamy, T., Becker, R. H., & Lockman, F. J. 1989, ApJ, 341, 151
LaRosa, T. N., Kassim, N. E., Lazio, T. J. W., & Hyman, S. D. 2000, AJ, 119, 207
McClure-Griffiths, N. M. 2001, PhD thesis, University of Minnesota
McClure-Griffiths, N. M., Green, A. J., Dickey, J. M., Gaensler, B. M., Haynes, R. F., & Wieringa, M. H. 2001, ApJ, 551, 394
Taylor, A. R. et al. 2003, AJ, 125, 3145
Uyanıker, B., Landecker, T. L., Gray, A. D., & Kothes, R. 2003, ApJ, 585, 785
Whiteoak, J. B. Z., & Green, A. J. 1996, A&AS, 118, 329