GaBoDS: The Garching-Bonn Deep Survey
We report the first confirmation of colour-selected galaxy cluster candidates by means of weak gravitational lensing. Significant lensing signals were identified in the course of the shear-selection programme of dark matter haloes in the Garching-Bonn Deep Survey, which currently covers 20 square degrees of deep, high-quality imaging data on the southern sky. The detection was made in a field that was previously covered by the ESO Imaging Survey (EIS) in 1997. A highly significant shear-selected mass-concentration perfectly coincides with the richest EIS cluster candidate at , thus confirming its cluster nature. Several other shear patterns in the field can also be identified with cluster candidates, one of which could possibly be part of a filament at .
Key Words.:
Cosmology: Dark Matter, Galaxies: Clusters: General, Cosmology: Gravitational Lensing1 Introduction
The search for dark matter haloes by weak gravitational lensing was first proposed by Kaiser, (1995) and Schneider, (1996) (hereafter S96). Using this technique, clusters are detected directly by their mass instead of their luminosity, and no assumptions have to be made about their virial state or the relation between bright and dark matter. In this way, a mass-selected cluster sample can be established, and the cluster population can be probed e.g. for underluminous objects. With moderately sized telescopes, however, this method is restricted to haloes in the intermediate redshift range (up to ), since with an increasing lens distance the population of sheared background galaxies is shifted to higher redshifts, making their shape measurement increasingly difficult.
Kruse & Schneider, (1999) predicted the number density of shear-selectable galaxy clusters with to be of the order of 10 deg-2. This figure is based on optimistic estimates of the width of the ellipticity distribution of galaxies and their accessible number density. With 2m-class telescopes, the number of such clusters per deg-2 is about a factor of 5-10 smaller. Since the advent of wide field imagers, a number of shear-selected dark matter haloes were reported in the literature (see Erben et al., , 2000; Umetsu & Futamase, , 2000; Maoli et al., , 2001; Wittman et al., , 2001, 2002; Miralles et al., , 2002; Miyazaki et al., , 2002; Dahle et al., , 2003; Schirmer et al., , 2003, for example). About half of these objects have optical counterparts, the nature of the others remains unclear.
In this work we present a sample of shear-selected dark matter haloes which (mostly) coincide with colour-selected galaxy cluster candidates. The objects were found in one of the 63 fields of the Garching-Bonn Deep Survey (hereafter GaBoDS), which are currently analysed in this respect. Section 2 summarises the observations and the data reduction, and Sect. 3 presents the mass aperture statistics (see S96) used for the shear selection. The particular detections are presented in Sect. 4, and we draw conclusions in Sect. 5.
2 Observations and data reduction
GaBoDS is a mostly virtual survey, with 80% of the data taken from the ESO archive or contributed by collaborators. It covers a sky area of currently 20 square degrees taken with the Wide Field Imager (WFI) at the MPG/ESO 2.2m telescope. The outstanding image quality of this instrument makes it ideally suited for observations of the weak lensing effect.
The field (“SGP”) under consideration is centred on the South Galactic Pole and was observed during MPG time in the course of the COMBO-17 project (see Wolf et al., , 2003). Observations in -band were carried out in October 1999 and September 2000. The total exposure time amounts to 27 ksec (7.5 hours) dark time, 20 ksec of which were selected for the coaddition due to their sub-arcsecond seeing quality and PSF properties.

The data reduction was performed with the GaBoDS pipeline, which was specifically developed for the reduction of any kind of WFI data. A detailed description of the algorithms involved and their performance can be found in Schirmer et al., (2003). Specific care was taken for the relative astrometric calibration of the individual CCDs. The accuracy obtained is on the order of a th-th of a pixel, thus no artificial anisotropies are introduced into the PSF (Fig. 1) that could mimic a shear signal. The seeing in the coadded image (35 37) is 08, and we reach a limiting magnitude of (Vega) for objects with at least 4 connected pixels above the sky background. The measurement of the galaxy shapes and the correction for PSF effects was performed with the KSB software (Kaiser et al., , 1995). A detailed description and test of our implemented shape measurement approach is given in Erben et al., (2001).
3 The shear-selection method
In the following, standard weak lensing notations are used. For a technical review of this topic see Bartelmann & Schneider, (2001).
The tidal gravitational field of a cluster-sized mass concentration induces a coherent distortion pattern in the images of distant background galaxies. By scanning the field for such characteristic patterns, the causing mass concentrations can be found. For the detection of these shear patterns we use the mass aperture statistics (, see S96). There, is defined as a filtered integral of the projected lens mass distribution inside an aperture. Switching to a different filter function, can be replaced by the tangential shear , for which the observable ellipticities of the background galaxies are an unbiased estimator. On a discrete grid evaluates as
| (1) |
where are the tangential components of the ellipticities of the lensed galaxies. The are individual weighting factors as introduced by Erben et al., (2001), and is the filter function. The noise for is obtained as
| (2) |
so that the ratio directly estimates the signal-to-noise of the shear-selected dark matter halo detection. We call this quantity the S-statistics, and its two-dimensional graphical representation the S-map.
We use a different filter function than the ones proposed in S96 and in Schneider et al., (1998), approximating the expected tangential shear profile of a NFW halo (see Fig. 2).

Note that is not any more directly related to the mass inside the aperture once it is evaluated near the border of the field, or on a galaxy distribution with swiss-cheese topology (e.g. due to masking of bright stars). However, the -statistics itself is unaffected by this and can be used to detect dark matter haloes, since still estimates the amount of shear alignment inside the aperture. More details of this and a thorough discussion of filter functions will be found in Schirmer et al., 2004 (in prep.), in which a shear-selected sample of about 100 mass concentrations based on the 20 square degrees of GaBoDS will be presented.
4 Results
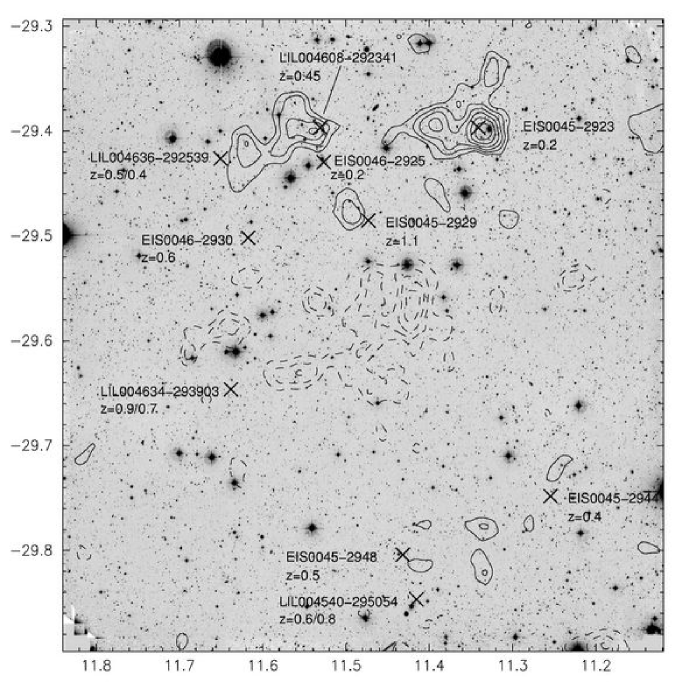
Our weak shear detections in the SGP field are presented in Fig. 4. Shown are the contours of the -map for a filter scale of 20. The number density of galaxies was arcmin-2. The optical counterparts were selected in and by Olsen et al., (1999) (hereafter EIS) and Lobo et al., (2000) (hereafter LIL), both using the EIS Wide Survey Patch B field and the matched filter algorithm by Postman et al., (1996). The authors estimate the redshifts of these candidates based on the colour of their elliptical galaxies.
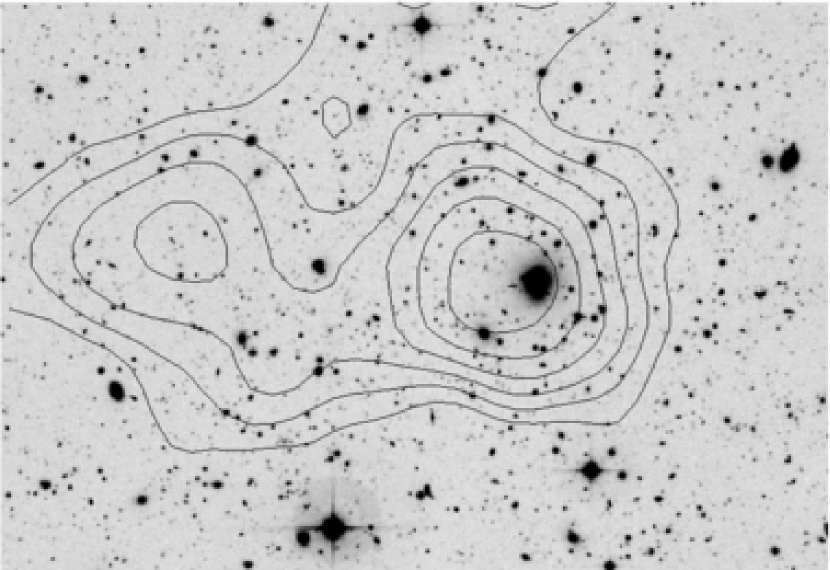
Most prominently, EIS00452923 () is detected at the -level (Fig. 3). This is also the richest cluster candidate as identified by EIS, even though it looks rather poor in the -band image (as do all the other candidates), with a single cD galaxy. From its estimated redshift and the lensing we conclude that this object has a mass of a few . A significant extension to the east (left) is visible, in the middle of which about half a dozen ellipticals at possibly higher redshift are found.
11east of EIS00452923, a -detection coincides with LIL004608292341 (). The galaxies therein form two strongly interacting subgroups. 15 further to the South is EIS00462925 (), which is not seen in any of our -maps. The lensing contours extend towards the East on a significant level for filter scales from 7-20 arcmin. 65 (2.2 Mpc) into this direction we have LIL004636293539 (), falling slightly outside the -contours. If these two clusters are indeed at the same redshift, this could indicate the presence of a filament. For another weak lensing detected filament see for example Gray et al., (2002).
When looking at the -map for the full SGP field, the detections for EIS00452923 and LIL004608292341 stand out remarkably clear over the rest of the field, as well as in their size as in their significance. In Fig. 4 several other EIS and LIL cluster candidates are indicated. The -detection next to EIS00452948 in Fig. 4 rises up to for a smaller filter scale of 63, but is offset by 1to the West. This is consistent with the rms offset we find for other mass concentration/optical counterpart pairs in our survey.
In order to rule out any remaining systematic effects inherent to the data, we split the 68 raw WFI images into two halves. One half contained only images with excellent PSF properties (better than 3% anisotropy), whereas the second one consisted of those with anisotropies up to 6% (mostly due to a slight defocusing of the telescope). The PSFs in the final stacks of the two sets look similar to the one shown in Fig. 1, since the individual anisotropies in defocused exposures rotate by 90 degrees when the detector plane passes through the focal plane, thus they average out in the coaddition. From these two entirely independent data sets we confirm the shear detections of EIS00452923 and LIL004608292341, but with a lower due to the reduced number density ( arcmin-2) of galaxies. The fluctuations of less significant peaks () between the various realisations increase, especially when moving to filter scales below 10.
5 Conclusions
We presented a sample of shear-selected mass concentrations in a deep observation of the South Galactic Pole, which was previously covered by the EIS Wide Survey Patch B field. Two of the mass concentrations found coincide with the colour-selected cluster candidates EIS00452923 and LIL004608292341, taken from the Patch B observations, and thus confirm their cluster nature. There is evidence for a possible filament connecting LIL004608292341 with LIL004636293539. A smaller mass concentration found is probably associated with EIS00452948. For the remaining low- detections no conclusions could be reached. We have shown that the shear-selection method yields very useful results also for less massive clusters.
Acknowledgements.
This work was supported by the BMBF through the DLR under the project 50 OR 0106, by the BMBF through DESY under the project 05AE2PDA/8, and by the Deutsche Forschungsgemeinschaft (DFG) under the project SCHN 342/3–1.References
- Bartelmann & Schneider, (2001) Bartelmann, M., & Schneider, P. 2001, Phys. Rep., 340, 291
- Dahle et al., (2003) Dahle, H., Pedersen, K., Lilje, P. B., Maddox, S. J., & Kaiser, N. 2003, ApJ, 591, 662
- Erben et al., (2000) Erben, T., van Waerbeke, L., Mellier, Y. et al. 2000, A&A, 355, 23
- Erben et al., (2001) Erben, T., van Waerbeke, L., Bertin, E., Mellier, Y., & Schneider, P. 2001, A&A, 336, 717
- Gray et al., (2002) Gray, M. E., Taylor, A. N., Meisenheimer, K., Dye, S., Wolf, C., & Thommes, E. 2002, ApJ, 568, 141
- Kaiser, (1995) Kaiser, N. 1995, ApJ, 439, L1
- Kaiser et al., (1995) Kaiser, N., Squires, G., & Broadhurst, T. 1995, AJ, 449, 460
- Kruse & Schneider, (1999) Kruse, G., & Schneider, P. 1999, MNRAS, 302, 821
- Lobo et al., (2000) Lobo, C., Iovino, A., Lazzati, D., & Chincarini, G. 2000, A&A, 360, 869
- Maoli et al., (2001) Maoli, R., van Waerbeke, L., Mellier, Y. et al. 2001, A&A, 368, 766
- Miralles et al., (2002) Miralles, J.M., Erben, T., Hämmerle, H. et al. 2002, A&A, 388, 68
- Miyazaki et al., (2002) Miyazaki, S., Hamana, T., Shimasaku, K. et al. 2002, ApJ, 580, 97
- Navarro et al., (1996) Navarro, J., Frenk, C., & White, S. 1996, ApJ, 642, 563
- Olsen et al., (1999) Olsen, L. F., Scodeggio, M., da Costa, L. et al. 1999, A&A, 345, 363
- Postman et al., (1996) Postman, M., Lubin, L. M., Gunn, J. E. et al. 1996, AJ, 111, 615
- Schirmer et al., (2003) Schirmer, M., Erben, T., Schneider, P. et al. 2003, A&A, 407, 869
- Schneider, (1996) Schneider, P. 1996, MNRAS, 283, 837
- Schneider et al., (1998) Schneider, P., van Waerbeke, L., Jain, B., & Kruse, G. 1998, MNRAS, 296, 873
- Umetsu & Futamase, (2000) Umetsu, K., & Futamase, T. 2000, ApJ Lett., 539, L5
- Wittman et al., (2001) Wittman, D., Tyson, J.A., Margoniner, V.E. et al. 2001, ApJ, 557, 89
- Wittman et al., (2002) Wittman, D., Margoniner, V. E., Tyson, J. A., Cohen, J. G., Becker, A. C., & Dell’Antonio, I. P. 2003, ApJ, 597, 218W
- Wolf et al., (2003) Wolf, C., Meisenheimer, K., Rix, H.-W., Borch, A., Dye, S., & Kleinheinrich, M. 2003, A&A, 401, 73