Confusion noise at far-IR to millimeter wavelengths
Abstract
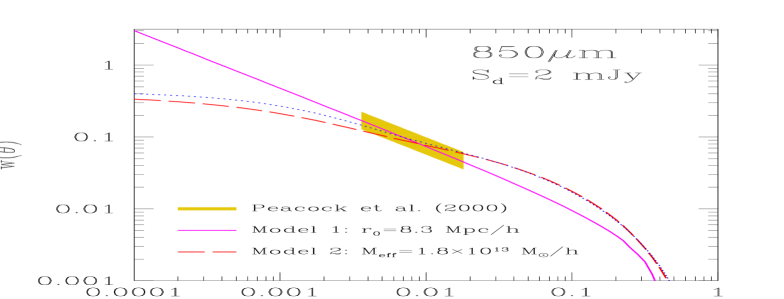
We present detailed predictions for the confusion noise due to extragalactic sources in the far-IR/(sub)-millimeter channels of ESA/ISO, NASA/Spitzer, ESA/Herschel and ESA/Planck satellites, including the contribution from clustering of unresolved SCUBA galaxies. Clustering is found to increase the confusion noise, compared to the case of purely Poisson fluctuations, by 10–15% for the lowest frequency (i.e. lowest angular resolution) Spitzer and Herschel channels, by 25–35% for the m ISOPHOT channel, and to dominate in the case of Planck/HFI channels at GHz. Although our calculations make use of a specific evolutionary model (Granato et al. 2004), the results are strongly constrained by the observed counts and by data on the redshift distribution of SCUBA sources, and therefore are not expected to be heavily model dependent. The main uncertainty arises from the poor observational definition of the source clustering properties. Two models have been used for the latter: a power-law with constant slope and a redshift-independent comoving correlation length, , and the standard theoretical model for clustering evolution in a CDM universe, with a redshift-dependent bias factor. In both cases, the clustering amplitude has been normalized to yield a unit angular correlation function at – for m sources fainter than 2 mJy, consistent with the results by Peacock et al. (2000). This normalization yields, for the first model, Mpc/h, and, for the second model, an effective mass of dark matter haloes in which these sources reside of M⊙/h. These results are consistent with independent estimates for SCUBA galaxies and for other, likely related, sources.
keywords:
galaxies: evolution - far-IR/sub-millimeter - clustering: models1 Introduction
Our knowledge of the early galaxy evolution has significantly improved in the last years thanks to the observations performed in the sub-millimeter waveband, in particular with the 450-850m Sub-millimeter Common User Bolometric Array (SCUBA) camera (Holland et al. 1999). The sources detected by SCUBA likely represent the progenitors of the local giant elliptical galaxies whose properties indicate that the bulk of their star formation activity occurred at high redshift and in a relatively short time (Thomas et al. 2002; Romano et al. 2002). SCUBA galaxies are in fact located at high () redshifts (Dunlop 2001; Ivison et al. 2002; Chapman et al. 2002, 2003) and display an enormous star formation rate (1000 M⊙/yr), which allows masses in stars of the order of 1011 M⊙ to be assembled in times shorter than 1 Gyr (Smail et al. 2002; Aretxaga et al. 2003; Chapman et al. 2003; Saracco et al. 2003).
For dark matter to stellar mass ratios typical of massive ellipticals (see, e.g., Marinoni & Hudson 2002; McKay et al. 2002), the dark matter haloes in which the sub-millimeter galaxies reside have masses of M⊙. Since these massive haloes sample the rare high-density peaks of the primordial dark matter distribution (Kaiser 1984; Mo & White 1996), SCUBA sources are expected to exhibit a strong spatial clustering, similar to that measured for Extremely Red Objects (EROs; Daddi et al. 2001, 2003), for which similar masses have been inferred (Moustakas& Somerville 2002).
Direct measurements of clustering properties of SCUBA galaxies are made difficult by the poor statistics and by the fact that they are spread over a wide redshift range, so that their clustering signal is strongly diluted. However, tentative evidences of strong clustering with a correlation length of –13 Mpc/h, consistent with that found for EROs, have been reported (Webb et al. 2003; Smail et al. 2003). Peacock et al. (2000, henceforth P00), after having removed all sources brighter than 2 mJy, found, in the arcmin2 850m map by Hughes et al. (1998) in the Hubble Deep Field, some evidence for clustering of the background source population consistent with an angular correlation function of the form with –.
As first pointed out by Scott & White (1999), the clustering signal may provide the dominant contribution to the power spectrum of small-scale fluctuations due to extragalactic sources at (sub)-millimeter wavelengths. Detailed calculations were carried out by Haiman & Knox (1999), Knox et al. (2001), Magliocchetti et al. (2001), and Perrotta et al. (2003). The general conclusion is that the amplitude of the clustering signal on sub-degree scales is comparable to that from the cosmic microwave background at m, and quickly overwhelms it at shorter wavelengths.
We address this issue from a different point of view, i.e. we analyze the effect of clustering in increasing the confusion noise (and therefore the detection limit) in far-IR/sub-millimeter surveys. The effect is particularly relevant for confusion limited surveys with poor spatial resolution, since, for small enough angular scales, the ratio of Poisson-to-clustering fluctuations decreases with increasing angular scale (De Zotti et al. 1996).
In particular, we consider the surveys in the ISOPHOT m channel, in the Spitzer (formerly SIRTF) MIPS m channel, and those performed with Herschel/SPIRE, and with Planck/HFI. Essentially all current estimates of the confusion noise for these instruments (Blain et al. 1998; Dole et al. 2001; Xu et al. 2001; Franceschini et al. 2001; Rowan-Robinson 2001; Lonsdale et al. 2003; Lagache et al. 2003; Dole et al. 2003; Rodighiero et al. 2003) do in fact only take into account the Poisson contribution. An attempt to allow also for the effect of clustering was worked out by Toffolatti et al. (1998), with reference to the Planck mission.
For our calculations we adopt the model by Granato et al. (2004, henceforth GDS04), which successfully reproduces the observed counts and the available information on the redshift distribution of SCUBA sources. The data actually tightly constrain the volume emissivity of these sources as a function of cosmic time, one of the key ingredients to derive the amplitude of the fluctuations. As mentioned above, the other key ingredient, namely the correlation function, is only poorly known, although some observational hints exist.
The layout of the paper is as follows. In Section 2 we describe the formalism. Section 3 summarizes the main aspects of the model by Granato et al. (2004). In Section 4 we illustrate the models for the two-point spatial correlation function of SCUBA sources. In Section 5 we present and discuss our main results.
Throughout the paper we will assume a flat cold dark matter (CDM) cosmology with and , in agreement with the first-year WMAP results (Spergel et al. 2003).
2 Confusion noise due to clustered sources: the formalism
The autocorrelation function, , of intensity fluctuations due to sources fainter than the detection limit , as a function of the angular separation , writes (see De Zotti et al. 1996):
| (1) |
Here is the luminosity distance, is the K-correction for monochromatic observations at the frequency , the vectors and represent the two directions of observation separated by an angle , and is the fluctuation around the mean number density of sources with luminosity and redshift :
| (2) |
being the comoving volume element, and the luminosity function. The angles (, ) and (, ) are measured from the axes and , respectively.
The integration in redshift is made within the interval [], where the sources are expected to exist. The integration over runs over the interval [], where and are the maximum and minimum intrinsic luminosities, and corresponds to the flux density at the redshift .
The spatial response function of the detector, , is assumed to be axially symmetric and Gaussian:
| (3) |
where relates to the beam FWHM through
| (4) |
If the luminosities of the sources are statistically independent of their positions, we get (Dautcourt 1977):
| (5) |
being the Dirac function. The first term on the right-hand side corresponds to a Poisson distribution of point sources, while the second one is due to clustering with a two-point spatial correlation function .
The variance of intensity fluctuations within the telescope beam, whose square root, , will be referred to as confusion noise, is obtained setting :
| (6) |
and is the quadratic sum of the Poisson term:
| (7) | |||||
and of the clustering contribution, which, in the small angle approximation (i.e. ) and assuming that the maximum scale of appreciable clustering is much smaller than the Hubble radius, , writes:
| (8) |
where is a comoving scale and is the effective comoving volume emissivity at redshift contributed by sources with fluxes :
| (9) |
In Eq. (8) describes the time evolution of the Hubble parameter [], is the comoving linear distance corresponding, at a given redshift , to an angular separation in the sky111In the small angle approximation: . The upper limit of integration over , , is the comoving scale at which the correlation vanishes; we adopt Mpc/h, i.e. approximately three times the measured clustering radius (see Section 4).
The detection limit, , for a confusion limited survey, is defined by:
| (10) |
where the parameter is usually chosen in the range [3,5].
3 The evolutionary model
According to the GDS04 model, SCUBA sources are interpreted as spheroids observed during their major episode of star-formation, whose evolution and duration, shorter for more massive objects, is substantially affected not only by supernova feedback, but also by the growth of a central super-massive black hole (SMBH), and by the ensuing QSO activity. The relative importance of the QSO feedback, compared to supernovae, increases with the galaxy mass. This scenario, already explored in a phenomenological way by Granato et al. (2001), has been substantiated by GDS04 in a model which follows, using simple semi-analytic prescriptions, the evolution of baryons within dark matter haloes with total mass , forming at at the rate predicted by the canonical hierarchical clustering scenario. The mass and redshift cuts are meant to crudely filter out the haloes associated with disk and irregular galaxies, whose formation is not quantitatively addressed by GDS04. However, disk and irregular galaxies are envisaged as associated to haloes virializing at lower redshifts, eventually incorporating most of the less massive haloes which virialized at earlier times and may become galactic bulges.
We note that according to GDS04 (see also Granato et al. 2001), the high-redshift QSO activity marks and concurs to the end of the major episode of star formation in spheroids. Thus, there is a clear evolutionary link between SCUBA sources and high-redshift QSOs. Also, in the mass and redshift range considered, the model implies a one-to-one correspondence between haloes and spheroidal galaxies, consistent with the available data on the clustering of Lyman-break galaxies (Bullock et al. 2002) and SCUBA galaxies (Magliocchetti et al. 2001)
The GDS04 model predicts a local SMBH mass function and a relationship between black hole and spheroid mass (in stars) which is in excellent agreement with the observational data. Also, when coupled with the most updated version of GRASIL (whose original version is described by Silva et al. 1998), the code which computes in a self-consistent way the chemical and spectro-photometric evolution of galaxies from far-UV to radio, it yields predictions which are fully consistent with a number of observables extremely challenging for all other semi-analytic models, including the sub-millimeter number counts and redshift distribution of spheroidal galaxies, as well as the epoch-dependent K-band luminosity function.
High-redshift star-forming spheroids are not the only important class of objects in the far-infrared and sub-millimeter wavebands. We also need to take into account late-type, normal galaxies and starburst galaxies which in fact dominate the bright tail of the counts. To deal with these sources, we adopt, as usual, a phenomenological approach (e.g. Franceschini et al. 2001; Takeuchi et al. 2001; Rowan-Robinson 2001; Gruppioni et al. 2002; Lagache et al. 2003), which consists in simple analytic recipes to evolve their m local luminosity functions (Saunders et al. 1990) and appropriate templates for the spectral energy distributions (SED) to extrapolate the models to different wavelengths. The prescriptions adopted here are those defined by Silva et al. (2004), which provide reasonable fits to the results of IRAS and ISO surveys. Briefly, normal late-type galaxies are assumed to undergo a pure luminosity evolution described by and to have the SED of the Sc galaxy NGC. The SED of the galaxy NGC is adopted for starburst galaxies and the luminosity function of these objects, , is assumed to evolve both in luminosity and in density: . The evolutionary laws for both populations were assumed to apply up to ; then the luminosity functions were kept constant up to .
Spiral and starburst galaxies are relatively weakly clustered (Fisher et al. 1994; Loveday et al. 1995; Guzzo et al. 1997; Madgwick et al. 2003), so that their contributions to the confusion noise turn out to be dominated by Poisson fluctuations. In the following we will therefore neglect their contribution to .
At millimeter wavelengths the composition of the bright counts drastically changes since flat spectrum radio sources take over. Their Poisson fluctuations have been estimated by extrapolating the 15 GHz differential counts, (Waldram et al. 2003), with a spectral index equal to zero (i.e. assuming a flux density constant with frequency), consistent with the WMAP results (Bennett et al. 2003). This choice for the spectral index is likely to increasingly overestimate the counts with increasing frequency, as the radio-source spectra steepen both because emitting regions become optically thin and because of electron ageing effects. However, this has little impact on our results since at sub-millimeter wavelengths radio sources are anyway a minor component.
Although radio sources are rather strongly clustered (Magliocchetti et al. 1998; Blake & Wall 2002a,b; Overzier et al. 2003, Magliocchetti et al. 2004), their clustering signal is highly diluted due to the broadness of their luminosity function (e.g. Dunlop & Peacock 1990) to the effect that their is small when compared to , and can be neglected (Argüeso et al. 2003; Toffolatti et al. 1998).
4 The two-point correlation function of SCUBA galaxies
P00 carried out a power-spectrum analysis of the m map of the northern Hubble Deep Field by Hughes et al. (1998), after subtracting sources brighter than mJy. They found, for multipole numbers in the range , some evidence of power in excess of the sum of instrumental noise and of estimated Poisson fluctuations due to unresolved sources. Such excess power can be accounted for by source clustering described by an angular correlation function of the form:
| (11) |
with in the range – arcsec. As made clear by P00, however, the estimated amplitude of Poisson fluctuations is rather uncertain due to our poor knowledge of the m counts below 2 mJy, and the possibility that they account entirely for the detected confusion noise cannot be ruled out. The more recent data on the faint m counts (Chapman et al. 2002; Smail et al. 2002; Knudsen & van der Werf 2003) are in good agreement with the analysis by P00 and do not allow firmer conclusions on the amplitude of the clustering signal. On the other hand, as shown below, an angular correlation function with the amplitude suggested by P00 is consistent with a number of other data on clustering of SCUBA galaxies themselves (although, again, the significance of the clustering detection is not very high) and of other populations which are closely linked to such galaxies, such as EROs. We thus conclude that Eq. (11) with – provides the current best guesstimate for the normalization of our models.
The spatial correlation function, , can be obtained by inverting the Limber’s (1953) equation:
| (12) |
with mJy. The quantity is the 850m background intensity produced by sources fainter than . The other symbols have the same meaning as in Eq. (8). As mentioned in the Introduction, SCUBA galaxies are interpreted by GDS04 as forming massive spheroidal galaxies. The model yields erg/s/cm2/Hz/sr.
In the following, we will consider both a phenomenological, power-law model for (Model 1) and a physically motivated model (Model 2). Both models are normalized to Eq. (11) with – in the range of scales probed by P00 (see Fig. 1).
.
4.1 Model 1
Our first model assumes the usual power-law shape:
| (13) |
In view of the tight connection between spheroidal galaxies and active nuclei at their centers, entailed by the GDS04 model, we further assume that the correlation length, , is constant in comoving coordinates, as suggested by quasar data (Croom et al. 2001; Outram et al. 2003) at least in the redshift interval –3.
Then, from Eq. (12), we find that the range of values of corresponding to – is:
| (14) |
very close to the range of values found for bright 2QZ quasars (; Croom et al. 2002), and fully consistent with the tentative estimate of the correlation length of SCUBA galaxies obtained by Smail et al. (2003): Mpc/h. The above value of the comoving correlation length is also compatible with the ones measured for bright local elliptical galaxies (Loveday et al. 1995; Guzzo et al. 1997; Norberg et al. 2002; Madgwick et al. 2003), supporting the link between these objects and the population of SCUBA sources.
| FWHM | ||||||||
| (m) | (GHz) | (arcsec) | (mJy) | (mJy) | (mJy) | (mJy) | (mJy) | (mJy) |
| ISOPHOT | ||||||||
| 175 | 1714 | 94.0 | 20 | 29 | 2 | 40 | - | 264 |
| 21 | 29 | 2 | 40 | 45 | 350 | |||
| 21 | 29 | 2 | 40 | 38 | 327 | |||
| Spitzer/MIPS | ||||||||
| 160 | 1875 | 35.2 | 5.0 | 9.1 | 0.4 | 11.2 | - | 76.4 |
| 5.3 | 9.3 | 0.4 | 11.5 | 8.2 | 88.3 | |||
| 5.1 | 9.3 | 0.4 | 11.4 | 6.0 | 83.2 | |||
| Herschel/SPIRE | ||||||||
| 250 | 1200 | 17.4 | 2.0 | 3.9 | 0.1 | 4.6 | - | 31.7 |
| 2.1 | 4.1 | 0.1 | 4.8 | 2.6 | 35.7 | |||
| 2.1 | 4.0 | 0.1 | 4.7 | 1.8 | 33.7 | |||
| ——————————————————————————————— | ||||||||
| 350 | 857 | 24.4 | 2.5 | 5.0 | 0.2 | 6.9 | - | 44.2 |
| 2.6 | 5.1 | 0.2 | 7.3 | 4.1 | 50.6 | |||
| 2.5 | 5.0 | 0.2 | 7.1 | 3.1 | 47.9 | |||
| ——————————————————————————————— | ||||||||
| 500 | 600 | 34.6 | 1.7 | 3.3 | 0.2 | 5.8 | - | 34.6 |
| 1.7 | 3.3 | 0.3 | 6.0 | 3.8 | 40.1 | |||
| 1.7 | 3.3 | 0.3 | 6.0 | 3.2 | 38.6 | |||
| Planck/HFI | ||||||||
| 350 | 857 | 300 | 45 | 65 | 7 | 116 | - | 705 |
| 50 | 66 | 10 | 116 | 250 | 1439 | |||
| 51 | 66 | 10 | 116 | 266 | 1510 | |||
| ——————————————————————————————— | ||||||||
| 550 | 545 | 300 | 18 | 29 | 5 | 55 | - | 323 |
| 19 | 29 | 7 | 55 | 117 | 671 | |||
| 19 | 29 | 8 | 55 | 137 | 757 | |||
| ——————————————————————————————— | ||||||||
| 850 | 353 | 300 | 5 | 9 | 3 | 20 | - | 115 |
| 6 | 9 | 5 | 20 | 42 | 241 | |||
| 6 | 9 | 5 | 20 | 53 | 288 | |||
| ——————————————————————————————— | ||||||||
| 1380 | 217 | 300 | 1.2 | 2.2 | 1.9 | 4.9 | - | 29.2 |
| 1.3 | 2.2 | 2.5 | 4.9 | 10.1 | 59.0 | |||
| 1.3 | 2.2 | 2.8 | 4.9 | 13.3 | 73.2 | |||
| ——————————————————————————————— | ||||||||
| 2100 | 143 | 426 | 0.5 | 0.7 | 2.0 | 1.8 | - | 13.9 |
| 0.5 | 0.7 | 2.6 | 1.8 | 4.2 | 26.5 | |||
| 0.5 | 0.7 | 2.8 | 1.8 | 5.7 | 33.5 | |||
| ——————————————————————————————— | ||||||||
| 3000 | 100 | 552 | 0.2 | 0.3 | 2.5 | 0.7 | - | 12.9 |
| 0.3 | 0.3 | 2.8 | 0.7 | 1.8 | 17.1 | |||
| 0.3 | 0.3 | 3.0 | 0.7 | 2.6 | 20.0 | |||
4.2 Model 2
The spatial correlation function of visible galaxies can be described as the product of the correlation function of dark matter, , with the bias parameter which relates the distribution of light to that of the matter (Matarrese et al. 1997; Moscardini et al. 1998). is determined by the cosmology and by the primordial density perturbations (Peacock & Dodds 1996; Smith et al. 2003), for which we have adopted a CDM spectrum, with an index , a shape parameter and a normalization (see e.g. Lahav et al. 2002, Spergel et al. 2003). We will use the practical fitting formula by Peacock Dodds (1996) to evolve the dark matter power spectrum into the non-linear regime. For the cosmological model adopted here, the angular correlation function obtained using the improved treatment by Smith et al (2003) is only slightly different and is intermediate between those yielded by our two models (Fig. 1).
Under the assumption of a single object per halo, which is expected to hold for massive objects at high redshift () and is implicit in the GDS04 model, the bias parameter, , can be written as a function of an effective dark-matter halo mass, (which is close to the minimum halo mass, cf. Moscardini et al. 1998), and of redshift (see, e.g., Mo & White 1996; Sheth & Tormen 1999). We can then write the spatial correlation function of star-forming spheroids as
| (15) |
The effective mass is determined by the condition that, in the range of angular scales probed by P00, the model correlation function matches the measured one. Using the analytic formulae by Sheth & Tormen (1999) for the bias factor and by Peacock & Dodds (1996) for we find:
| (16) |
consistent with the estimates by Moustakas & Somerville (2002) for ERO halo masses (the minimum mass of ERO dark matter haloes is estimated to be , while the galaxy number-weighted average halo mass is ). We recall that EROs are either massive dusty galaxies like SCUBA galaxies, or evolved giant ellipticals, a later evolutionary phase of SCUBA galaxies, in the scenario discussed by GDS04.
For a virialization redshift , GDS04 predict a ratio , where is the present-day mass in stars of spheroids (see Figure 5 of their paper). Thus corresponds to a mass in stars of M⊙, compatible with values for the stellar masses inferred for SCUBA galaxies (Smail et al. 2003) and for high- galaxies with very red near-IR colours (Saracco et al. 2003).
As a last remark, we note that (as also illustrated by Fig. 1) Models 1 and 2 widely differ on small angular scales. The small scale flattening of implied by Model 2 is due to the fact that at high redshift () density perturbations are close to the linear regime, even on very small scales.
5 Results and discussion
Table 1 gives our estimated contributions to the confusion noise and the corrisponding detection limits for all the populations previously described (obtained by adopting in Eq. (10)), in the case of:
-
i)
the m channel of the Imaging Photo-Polarimeter of the ESA’s ISO satellite (ISOPHOT);
-
ii)
the longest wavelength channel (m) of the Multiband Imaging Photometer (MIPS) of NASA’s Spitzer (formerly SIRTF) satellite, launched last August;
-
iii)
all channels (250, 350 and 500m) of the Spectral and Photometric Imaging REceiver (SPIRE) of the ESA’s Herschel satellite scheduled for launch in 2007;
-
iv)
all channels (350, 550, 850, 1380, 2100, and m) of the High Frequency Instrument (HFI) of the ESA’s Planck satellite, to be launched jointly with Herschel.
The values for the angular resolutions (FWHM) have been taken from Dole et al. (2001; ISOPHOT), Lonsdale et al. (2003; MIPS/Spitzer), Griffin et al. (2000; SPIRE/Herschel), and Lamarre et al. (2003; HFI/Planck).
As discussed above, forming spheroidal galaxies are the only population, among those considered here, whose fluctuations are dominated by clustering. We have therefore only presented in Table 1 results for the instruments and the wavelengths where this population gives an important contribution to the confusion noise. For each channel, the first line corresponds to pure Poisson fluctuations while the second and the third lines include the contributions of clustering based on Model 1 and 2, respectively. The increment of Poisson fluctuations when we allow for the effect of clustering is obviously due to the increment of .
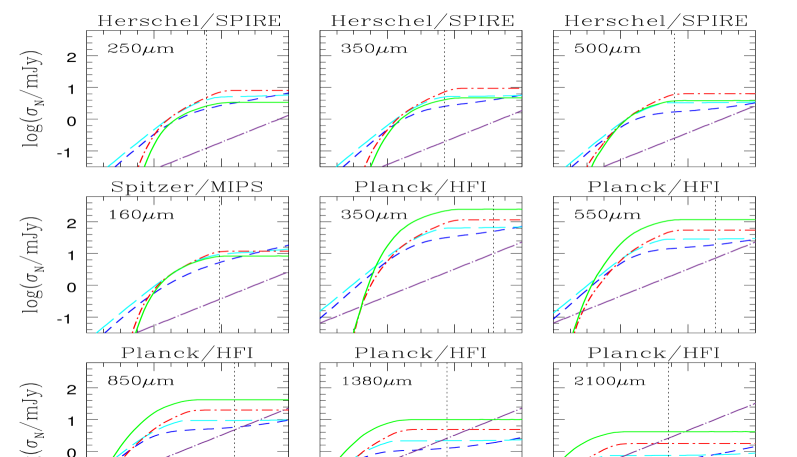
The relative importance of contributions from each class of objects as a function of the flux limit is illustrated in Fig. 2 by the function [see Eq. (6)]. The flattening of the function at bright flux densities follows from the fact that the main contribution does not come from sources just below the detection limit, as is frequently the case for Poisson fluctuations, but from sources at redshifts where the effective volume emissivity, [see Eq. (8)], is maximum.
For power-law differential counts, , if . This power-law behaviour, obeyed by because of our adoption of the power-law representation of the counts by Waldram et al. (2003), must break down at faint flux densities, where counts must converge, and must flatten at bright flux densities (Jy), where the slope of the counts approaches the Euclidean value (Bennett et al. 2003). Since the survey by Waldram et al. (2003) covers the flux density range 10–1000 mJy, we may have somewhat overestimated fluctuations due to radio sources, if the counts start converging not far below 10 mJy.
The slope of the bright counts of normal late-type galaxies is close to the Euclidean value (), while that of starburst galaxies is somewhat steeper, due to their relatively strong evolution. Correspondingly, for both populations is a flatter function of than in the case of radio galaxies, and is flatter for starburst than for normal galaxies.
On the other hand, the bright tail of the counts of forming spheroidal galaxies is extremely steep (), as a consequence of the combined effect of strong evolution and negative K-correction. Thus, the main contribution to comes from relatively faint sources and this quantity is essentially constant for large enough values of .
Clustering accounts for 10–20% of the total confusion noise, depending on the assumed model for , for the m MIPS channel and the SPIRE channels, but its contribution increases up to 35–40% of the total confusion noise for the m ISOPHOT channel, and dominates the fluctuations due to extragalactic sources in the case of Planck/HFI, except in the longest wavelength channel where Poisson fluctuations due to radio sources take over. However, higher resolution surveys can be used to subtract such sources down to flux densities well below the estimated , thus decreasing their contribution to fluctuations. We note that a similar task is much more difficult in the case of forming spheroidal galaxies since the main contribution to their clustering fluctuations comes from very faint flux densities.
As noted above, the ratio of clustering-to-Poisson fluctuations increases with decreasing angular resolution. In fact [see Eq. (7)], while, if with , (De Zotti et al. 1996). It may also be noted that, as a consequence of the different dependence of on angular scale (see Fig. 1), the values of implied by Model 1 (shown in Fig. 2) exceed those given by Model 2 for higher resolution surveys, while the opposite happens for lower resolution surveys, such as those of Planck/HFI.
Our estimates – obtained with the inclusion of the clustering contribution – of the confusion noise for the m ISOPHOT channel are in good agreement with the observational determination by Dole et al. (2001) in the FIRBACK survey fields, once we allow for the different flux limit. These authors find a confusion noise of mJy when adopting a detection limit of mJy, while we adopt a limit of 327–mJy (see Table 1, bearing in mind that increases with ). The possibility of a significant contribution from clustering in the m FIRBACK survey was discussed by Perrotta et al. (2003) and Dole et al. (2003).
In spite of the different models used and of the different criteria adopted to define the limiting flux densities, our estimates of Poisson fluctuations are in reasonable agreement with those by Rowan-Robinson (2001), Dole et al. (2003) and Xu et al. (2003) for MIPS/Spitzer and by Lagache et al. (2003) for SPIRE/Herschel and HFI/Planck. At the wavelengths (160 and 850m) where the models are tightly constrained by the data, differences are generally within 20–30 per cent, our predictions being on the high side. At other wavelengths, our estimates tend to be higher than those of other authors by up to 50 per cent.
A preliminary attempt to allow for the effect of clustering of evolving dusty galaxies was carried out by Toffolatti et al. (1998), who assumed and constant clustering in physical coordinates (stable clustering model: , in comoving coordinates). They further adopted an Einstein-de Sitter universe and set Mpc/h. Their model yields a comoving correlation scale length at , Mpc/h, i.e. about a factor of 2 smaller than indicated by current data (see Sect. 4). Correspondingly, they have probably substantially underestimated the clustering fluctuations.
Recently, Takeuchi & Ishii (2003) have estimated the effect of clustering with reference to the forthcoming ASTRO-F surveys. They find that, between 60 and 170m, clustering increases by per cent the detection limit derived by only considering Poisson fluctuations. Their result is thus compatible with our estimate for the MIPS/Spitzer 160m channel.
Finally, it must be stressed that we have only considered fluctuations due to extragalactic point sources. Additional contributions of varying importance (depending on the wavelength and on the position in the sky of the surveyed area) come from Galactic (synchrotron, free-free, interstellar dust) and zodiacal emissions. At millimeter wavelengths the graininess of the sky is actually dominated by fluctuations of the cosmic microwave background. Further fluctuations may be produced by Sunyaev-Zel’dovich effects in groups and clusters of galaxies. Last, but not least, to determine the sensitivity of a survey we also have to allow for instrumental noise. Therefore, the values of quoted in Table 1 must be regarded as lower limits.
ACKNOWLEDGMENTS
Work supported in part by ASI and MIUR. We warmly thank G. Rodighiero for useful discussions and the anonymous referee for comments that helped improving the paper.
References
- [Aretxaga et al. 2003] Aretxaga I., Hughes D.H., Chapin E.L., Gaztanaga E., Dunlop J.S., Ivison R., 2003, MNRAS, 342, 759
- [\citeauthoryearArgüeso, González-Nuevo, & Toffolatti2003] Argüeso F., González-Nuevo J., Toffolatti L., 2003, ApJ, 598, 86
- [Bennett et al. 2003] Bennett C.L. et al., 2003, ApJS, 148, 97
- [Blain et al. 1998] Blain A.W., Ivison R.J., Smail I., 1998, MNRAS, 296, L29
- [\citeauthoryearBlake & Wall2002] Blake C., Wall J., 2002a, MNRAS, 329, L37
- [\citeauthoryearBlake & Wall2002] Blake C., Wall J., 2002b, MNRAS, 337, 993
- [Bullock et al. 2002] Bullock J.S., Wechsler R.H., Somerville R.S., 2002, MNRAS, 329, 246
- [Chapman et al. 2002] Chapman S.C., Blain A.W., Ivison R.J., Smail I.R., 2003, Nat, 422, 695
- [Chapman et al. 2002] Chapman S.C., Scott D., Borys C., Fahlman G.G., 2002, MNRAS, 330, 92
- [\citeauthoryearCroom et al.2002] Croom S.M., Boyle B.J., Loaring N.S., Miller L., Outram P.J., Shanks T., Smith R.J., 2002, MNRAS, 335, 459
- [Croom et al. 2001] Croom S.M., Shanks T., Boyle B.J., Smith R.J., Miller L., Loaring N.S, Hoyle F., 2001, MNRAS, 325, 483
- [Daddi et al. 2001] Daddi E., Broadhurst T., Zamorani G., Cimatti A., Rottgering H., Renzini A., 2001, A&A, 376, 825
- [Daddi et al. 2003] Daddi E. et al., 2003, ApJ, 588, 50
- [Dautcourt 1977] Dautcourt G., 1977, Astronomische Nachrichten, 298, 141
- [De Zotti et al. 1996] De Zotti G., Franceschini A., Toffolatti L., Maffei P., Danese L., 1996, ApL&C, 35, 289
- [Dole et al. 2003] Dole H., Lagache G., Puget J.-L., 2003, ApJ, 585, 617
- [Dole et al. 2001] Dole H. et al., 2001, A&A, 372, 364
- [Dunlop 2001] Dunlop J.S., 2001, NewAR, 45, 609
- [Dunlop Peacock 1990] Dunlop J.S., Peacock J.A., 1990, MNRAS, 247, 19
- [Fisher et al. 1994] Fisher K.B.; Davis M., Strauss M.A., Yahil A., Huchra J., 1994, MNRAS, 266, 50
- [Franceschini et al. 2001] Franceschini A., Aussel H., Cesarsky C.J., Elbaz D., Fadda D., 2001, A&A, 378, 1
- [Granato et al. 2004] Granato G.L., De Zotti G., Silva L., Bressan A., Danese L., 2004, ApJ, 600, 580 (GDS04)
- [Granato et al. 2001] Granato G.L., Silva L., Monaco P., Panuzzo P., Salucci P., De Zotti G., Danese L., 2001, MNRAS, 324, 757
- [Griffin et al. 2000] Griffin M.J., Swinyard B.M., Vigroux L.G., 2000, Proceedings of the SPIE, 4013, 184
- [Gruppioni et al. 2002] Gruppioni C., Lari C., Pozzi F., Zamorani G., Franceschini A., Oliver S., Rowan-Robinson M., Serjeant S., 2002, MNRAS, 335, 831
- [Guzzo et al. 1997] Guzzo L., Strauss M.A., Fisher K.B., Giovanelli R., Haynes M., 1997, ApJ, 489, 37
- [Haiman Knox 2000] Haiman Z., Knox L., 2000, ApJ, 530, 124
- [Holland et al. 1999] Holland W.S. et al., 1999, MNRAS, 303, 659
- [Hughes et al. 1998] Hughes D. et al., 1998, Nat, 394, 241
- [Ivison et al. 2002] Ivison R.J. et al., 2002, MNRAS, 337, 1
- [Kaiser 1984] Kaiser N., 1984, ApJ, 264, L9
- [Knox et al. 2001] Knox L., Cooray A., Eisenstein D., Haiman Z., 2001, ApJ, 550, 7
- [] Knudsen K.K, van der Werf P.P., 2003, proc. conf. “Multiwavelength Cosmology”, Mykonos, June 2003, astro-ph/0309184
- [Lagache et al. 2003] Lagache G., Dole H., Puget J.-L., 2003, MNRAS, 338, 555
- [Lahav et al. 2002] Lahav O., et al. (2dFGRS Team), 2002, MNRAS, 333, 961
- [Lamarre et al. 2003] Lamarre J.-M. et al., 2003, Proceedings of the SPIE, 4850, 730
- [\citeauthoryearLimber1953] Limber D.N., 1953, ApJ, 117, 134
- [Lonsdale et al. 2003] Lonsdale C.L. et al., 2003, PASP, 115, 897
- [Loveday et al. 1995] Loveday J., Maddox S.J., Efstathiou G., Peterson B.A., 1995, ApJ, 442, 457
- [Madgwick et al. 2003] Madgwick D.S. et al., 2003, MNRAS, 344, 847
- [Magliocchetti et al. 1998] Magliocchetti M., Maddox S.J., Lahav O. Wall J.V., 1998, MNRAS 300, 257
- [Magliocchetti et al. 2001] Magliocchetti M., Moscardini L., Panuzzo P., Granato G.L., De Zotti G., Danese L., 2001, MNRAS, 325, 1553
- [Magliocchetti et al. 2004] Magliocchetti M. et al., 2004, MNRAS accepted, astro-ph/0312160
- [Marinoni Hudson 2002] Marinoni C., Hudson M.J., 2002, ApJ, 569, 101
- [\citeauthoryearMatarrese et al.1997] Matarrese S., Coles P., Lucchin F., Moscardini L., 1997, MNRAS, 286, 115
- [McKay et al. 2002] McKay T.A. et al., 2002, ApJ, 571, L85
- [Mo White 1996] Mo H.J., White S.D.M., 1996, MNRAS 282, 347
- [\citeauthoryearMoscardini et al.1998] Moscardini L., Coles P., Lucchin F., Matarrese S., 1998, MNRAS, 299, 95
- [Moustakas Somerville 2001] Moustakas L.A., Somerville R.S., 2002, ApJ, 577, 1
- [Norberg et al. 2002] Norberg P. et al., 2002, MNRAS, 332, 827
- [\citeauthoryearOutram et al.2003] Outram P.J., Hoyle F., Shanks T., Croom S.M., Boyle B.J., Miller L., Smith R.J., Myers A.D., 2003, MNRAS, 342, 483
- [\citeauthoryearOverzier et al.2003] Overzier R.A., Röttgering H.J.A., Rengelink R.B., Wilman R.J., 2003, A&A, 405, 53
- [Peacock Dodds 1996] Peacock J.A., Dodds S.J., 1996, MNRAS, 280, L19
- [Peacock et al. 2000] Peacock J.A. et al., 2000, MNRAS, 318, 535 (P00)
- [Perrotta et al. 2003] Perrotta F., Magliocchetti M., Baccigalupi C., Bartelmann M., De Zotti G., Granato G.L., Silva L., Danese L., 2003, MNRAS, 338, 623
- [\citeauthoryearRodighiero et al.2003] Rodighiero G., Fadda D., Gregnanin A., Lari C., Franceschini A., 2003, proc. conf. “Exploiting the ISO Data Archive. Infrared Astronomy in the Internet Age”, eds. C. Gry et al., ESA SP-511, 321
- [Romano et al. 2002] Romano D., Silva L., Matteucci F., Danese L., 2002, MNRAS, 334, 444
- [Rowan-Robinson 2001] Rowan-Robinson M., 2001, ApJ, 549, 745
- [Saracco et al. 2003] Saracco P. et al., 2003, A&A in press, astro-ph/0310131
- [Saunders et al. 1990] Saunders W., Rowan-Robinson M., Lawrence A., Efstathiou G., Kaiser N., Ellis R.S., Frenk C.S., 1990, MNRAS, 242, 318
- [Scott White 1999] Scott D., White M., 1999, A&A, 346, 1
- [Sheth Tormen 1999] Sheth R.K., Tormen G., 1999, MNRAS, 308, 119
- [Silva et al. 1998] Silva L., Granato G.L., Bressan A., Danese L., 1998, ApJ, 509, 103
- [Silva et al. 2004] Silva L., De Zotti G., Granato G.L., Maiolino R., Danese L., 2004, astro-ph/0403166
- [Smail et al. 2003] Smail I., Chapman S.C., Blain A.W., Ivison R.J., 2003, preprint, astro-ph/0311285
- [Smail et al. 2002] Smail I., Ivison R.J., Blain A.W., Kneib J.-P., 2002, MNRAS, 331, 495
- [Smith et al. 2003] Smith R.E. et al., 2003, MNRAS, 341, 1311
- [Spergel et al. 2003] Spergel D.N. et al., 2003, ApJ, 148, 175
- [Takeuchi Ischii 2003] Takeuchi T.T., Ishii T.T., 2004, ApJ, 604, 40
- [\citeauthoryearTakeuchi et al.2001] Takeuchi T.T., Ishii T.T., Hirashita H., Yoshikawa K., Matsuhara H., Kawara K., Okuda H., 2001, PASJ, 53, 37
- [\citeauthoryearThomas, Maraston, & Bender2002] Thomas D., Maraston C., Bender R., 2002, Ap&SS, 281, 371
- [Toffolatti et al. 1998] Toffolatti L., Argüeso Gómez F.A., De Zotti G., Mazzei P., Franceschini A., Danese L., Burigana C., 1998, MNRAS, 297, 117
- [Waldram et al. 2003] Waldram E.M., Pooley G.G., Grainge K.J.B., Jones M.E., Saunders R.D.E., Scott P.F., Taylor A.C., 2003, MNRAS, 342, 915
- [Webb et al. 2003] Webb T.M., Eales S.A., Lilly S.J., Clements D.L., Dunne L., Gear W.K., Ivison R.J., Flores H., Yun M., 2003, ApJ, 587, 41
- [Xu et al. 2001] Xu C., Lonsdale C.J., Shupe D.L., O’Linger J., Masci F., 2001, ApJ, 562, 179
- [\citeauthoryearXu et al.2003] Xu C.K., Lonsdale C.J., Shupe D.L., Franceschini A., Martin C., Schiminovich D., 2003, ApJ, 587, 90