Chandra Observations of the X-ray Environs of SN 1998bw/GRB 980425
Abstract
We report X-ray studies of the environs of SN 1998bw and GRB using the Chandra X-Ray Observatory 1281 days after the GRB. Eight X-ray point sources were localized, three and five each in the original error boxes - S1 and S2 - assigned for variable X-ray counterparts to the GRB by BeppoSAX. The sum of the discrete X-ray sources plus continuous emission in S2 observed by CXO on day 1281 is within a factor of 1.5 of the maximum and the upper limits seen by BeppoSAX. We conclude that S2 is the sum of several variable sources that have not disappeared, and therefore is not associated with the GRB. Within S1, clear evidence is seen for a decline of approximately a factor of 12 between day 200 and day 1281. One of the sources in S1, S1a, is coincident with the well-determined radio location of SN 1998bw, and is certainly the remnant of that explosion. The nature of the other sources is also discussed. Combining our observation of the supernova with others of the GRB afterglow, a smooth X-ray light curve, spanning days, is obtained by assuming the burst and supernova were coincident at 35.6 Mpc. When this X-ray light curve is compared with those of the X-ray “afterglows” of ordinary GRBs, X-ray Flashes, and ordinary supernovae, evidence emerges for at least two classes of lightcurves, perhaps bounding a continuum. By three to ten years, all these phenomena seem to converge on a common X-ray luminosity, possibly indicative of the supernova underlying them all. This convergence strengthens the conclusion that SN 1998bw and GRB took place in the same object. One possible explanation for the two classes is a (nearly) standard GRB observed at different angles, in which case X-ray afterglows with intermediate luminosities should eventually be discovered. Finally, we comment on the contribution of GRBs to the ULX source population.
1 Introduction
One of the most exciting developments in the study of gamma-ray bursts (GRBs) was the discovery, in 1998, of a GRB apparently in coincidence with a very unusual supernova of Type Ic (Galama et al. 1998). This coincidence of SN 1998bw and GRB offered compelling evidence that GRBs are indeed associated with the deaths of massive stars, and that, at least in some cases, GRBs go hand in hand with stellar explosions (Woosley 1993; MacFadyen & Woosley 1999). The large energy release inferred for the supernova also suggested a novel class of explosions, called by some “hypernovae” (Paczyński 1998), having unusual properties of energy, asymmetry, and relativistic ejecta.
However, this identification was challenged on two grounds. First, there were two variable X-ray sources identified with BeppoSAX in the initial 8.0′ radius GRB error box; one was not the supernova. Second, if it were associated with the nearby supernova, GRB was a most unusual burst with gamma-ray energy per solid angle roughly four orders of magnitude less than typical. Further, the BeppoSAX decay of the SN 1998bw associated X-ray source was much slower than the typical GRB X-ray afterglow decay (Pian et al. 2000). Interestingly, observations (Pian et al. 2003) of the two sources in March 2002 with the X-ray Multi-Mirror (XMM) telescope revealed that the X-ray emission of the SN 1998bw associated BeppoSAX error box had decreased at a faster pace than expected by a simple extrapolation of the earlier measurements. Moreover, the second XMM source was found to consist of a number of faint point-like sources, whose integrated emission was consistent with the average brightness measured with BeppoSAX (Pian et al. 2000).
Strong support for the GRB-SN association came from the very recent spectroscopic detection (Hjorth et al. 2003; Stanek et al. 2003) of a supernova (SN 2003dh) in the optical light curve of GRB 030329. In this case, the SN detection was obscured by the extreme optical brightness of the GRB afterglow. While the models of MacFadyen and Woosley (1999) suggest that there can be adequate 56Ni to make the GRB-supernova bright, it is now becoming evident that we must also account for the potentially much brighter optical afterglow of the GRB itself.
Here we report the results of a study of the environs of SN 1998bw and GRB using the Chandra X-Ray Observatory (CXO) 1281 days after the GRB. This study had several goals. First, given the intervening three years, has the evidence strengthened for the GRB-SN association? We believe that it has (§ 4.1). Second, how does the X-ray light curve of GRB 980425, measured across 1300 days, compare with those of other GRBs and with other kinds of high energy transients - in particular X-ray flashes (XRFs; Heise 2003) and supernovae? What does the comparison tell us about the nature and origin of GRBs? We find that it provides evidence for a common theme underlying all these events - a powerful asymmetric supernova with relativistic ejecta along its polar axes and an observable event that varies depending upon the viewer’s polar angle (§ 4 and § 5).
Finally, we are interested in the environs of SN 1998bw. Aside from the one supernova, does this region show evidence for unusual stellar activity as might characterize a vigorously star forming region (§ 3.1)? SN 1998bw offers the best opportunity to study a GRB site up close, and one should take every advantage of that.
2 Prompt Observations of GRB and SN 1998bw
GRB triggered the Burst And Transient Source Experiment (BATSE ) on board NASA’s Compton Gamma-Ray Observatory (CGRO) on 1998 April 25, 21:49:09 UT; the event was simultaneously detected by the BeppoSAX Gamma-ray Burst Monitor (GRBM) and Wide Field Camera (WFC). The burst consisted of a single peak of s duration, with peak flux and fluence (24-1820 keV) of erg/cm2 s, and erg/cm2, respectively. Galama et al. (1998) observed the WFC 8.0′ error box with the New Technology Telescope (NTT) at the European Southern Observatory (ESO) on April 28.4 and May 1.3 UT and, in the error box of GRB , they found supernova SN 1998bw, located in an HII region in a spiral arm of the face-on barred spiral galaxy ESO G, at z=0.0085, corresponding to a distance of 38.5 Mpc (Galama et al. assumed a Hubble constant, km/s Mpc, but in the following we use km/s Mpc as measured by Freedman et al. (2003), placing SN 1998bw at 35.6 Mpc).
On 1998 April 26-28, ten hours after the GRB, the BeppoSAX Narrow Field Instruments (NFI) observed (Pian et al. 2000) the WFC error box and revealed two previously unknown, weak X-ray sources, 1SAX J (hereafter S1) and 1SAX J (hereafter S2) with an uncertainty radius of 1.5′ each. S1 included the SN 1998bw, but S2 was away. Both sources were observed two more times with the NFI resulting, in the case of S2, in two detections and two upper limits. In contrast, during the six month interval spanned by all NFI observations, the flux, , of S1 followed a power-law temporal decay (Pian et al. 2000): erg/cm2 s, a much flatter trend than the one observed for other GRB X-ray afterglows, but a decaying trend nevertheless.
At 35.6 Mpc the apparent isotropic energy of GRB ( erg) was about four orders of magnitude smaller than that of ‘normal’ GRBs (Bloom et al. 2003). Moreover, independent of its connection with a GRB, SN 1998bw was extraordinary in many ways. Its light curve resembled a Type Ia supernova in brilliance, but the spectrum was more like Type Ic (H, He, and Si lines absent, but the spectrum was peculiar even for Ic). Thus, the two phenomena together presented a very interesting scientific puzzle whose solution required the combined superb resolution of the Hubble Space Telescope (HST) and CXO.
3 CXO Observations at Day 1281
CXO observed S1 and S2 on 2001 October 27, for a total time on source of 47.7 ks. S1 fell completely on ACIS-S3 (a back-illuminated CCD) and S2 only partially, with most of the error region falling on ACIS-S2 (a front-illuminated CCD), both operating in Time Exposure (TE) mode. The data were processed using the CIAO (v3.0.1)111http://asc.harvard.edu/ciao/ and CALDB(v2.34)222http://asc.harvard.edu/caldb/ software. More specifically, we used the CIAO tool acis-process-events to ensure that the latest gain corrections were applied (those corresponding to our observation date). Further, we removed the standard pixel randomization, applied CTI corrections, filtered the data to include events with ASCA grades = 0,2,3,4, and 6, and applied standard GTIs. We corrected the systematic offset in the aspect using the fix-offset thread333http://cxc.harvard.edu/cal/ASPECT; this results in an offset of and . To improve the ACIS-S3 spatial resolution we use the method described by Mori et al. (2001) and Tsunemi et al. (2001) to adjust the event locations. These studies conclude that by defining the event location on a pixel as a function of the event grade (rather than placing the event at the pixel center) one can achieve improvements in spatial resolution. During our observation the X-ray background increased by with variations on time scales of a few kiloseconds. Since the point source emission is not significantly masked by such slow background variations, we chose to include all the data in our analysis to preserve our (limited) source counts.
3.1 S1 and S2: Source Identification, Locations and Energetics
We used the source-finding method originally described in Swartz et al. (2002), accepting as detections all sources with a minimum signal-to-noise ratio (S/N) of 2.6. For source detection purposes we searched images consisting of data between keV to avoid the ACIS high energy background. We discuss below the sources within the radius () NFI error circles of S1 and S2 only.
3.1.1 S2
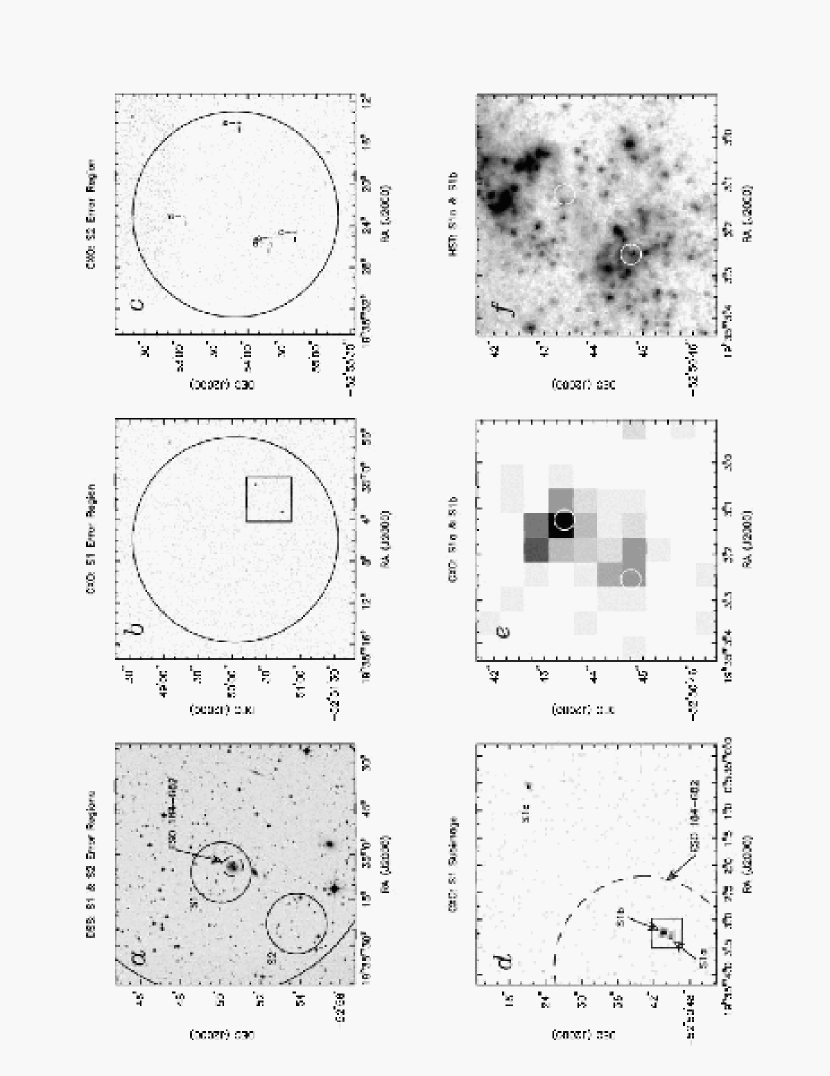
S2 was resolved into five sources (S2abcde; Figure 1c and Table 1). Given the very limited count number per source, we combined four of them in one spectral fit with a power law function and a hydrogen column density, cm-2 (corresponing to the Galactic absorption in the line of sight to GRB ; Schlegel, Finkbeiner & Davis 1998). Here we assume a spectral similarity between these sources to mitigate the difficulty of fitting individual spectra of very few counts each. This order of magnitude approximation is acceptable within our source statistics (see also Figure 2, where rudimentary count spectra are presented for S1abc, and S2ce). However, one source (S2d), fell into the gap between the ACIS CCDs S2 and S3 and its total counts had to be adjusted taking into account the reduced gap exposure time. Using the spectral index of -1 from the fit, we applied a conversion factor of erg/cm2 s ( keV) per count/sec ( keV) to the S2d counts and finally estimated the total (combined) flux in S2 ( keV) to be erg/cm2 s (here and in Table 1 the numbers in parentheses correspond to the errors in the last digit).
The BeppoSAX flux for S2 was, however, calculated for a much larger extraction radius (3) to account for the extreme faintness of the detection within a 1.5 radius, which was at the level of the NFI confusion limit (Pian et al. 2000). Only of this larger error circle is covered with CXO. Using the same source-finding algorithim criterion described above, we found a total of 18 sources within the enlarged area, with a total flux of erg cm-2 s. This is roughly the flux to be compared to the BeppoSAX S2 value at day 1. Subsequently we re-calculated the total BeppoSAX flux within S2 at day 1, using the same spectral function derived with CXO and found it to be erg/cm2 s (with significance). Taking into account the partial coverage with CXO of the NFI error circle of S2, we estimate that the day 1281 CXO flux value is within a factor of 1.5 of the detection limit of BeppoSAX, indicating that at best there was no siginificant variation of the sources within S2 over the last 3.5 years. This result is consistent with the XMM observations of S2 (Pian et al. 2003). We further discuss the evolution of the light curve of S2 in § 4.1.
3.1.2 S1
We initially identified two sources apart within the S1 (1.5) error region444Here we are only considering the area corresponding to the NFI half power radius of , as most of the BeppoSAX signal for S1 at day 1 was within this area (Pian et al. 2000). An enlarged radius region (3) for S1 results in a total flux of erg cm-2 s, almost half the BeppoSAX value at day 1, one of which coincided with the location of SN 1998bw. However, further inspection of the latter resolved this source into two with a radial separation of (Figure 1b). We fitted these sources simultaneously with two 2-D circular Gaussians to better estimate their centroids and found that they are both consistent with point sources. Hereafter we designate the X-ray sources detected within the S1 error region as S1a (corresponding to SN 1998bw), S1b, and S1c. We have fitted a power law to each unbinned non-background subtracted source spectrum, assuming the same as for S2. Our fit parameters are derived using the C-statistic (Cash 1979), appropriate for low count data (Table 1).
Further, we reanalyzed all archival HST and ESO/Very Large Telescope (VLT) observations of ESO G82, the host galaxy of SN 1998bw, concentrating on the immediate environment of the supernova. The small field of view of HST/STIS ( 50 ″) contains only the sources S1a and S1b. In order to obtain accurate astrometry we, therefore, registered both the CXO and HST images independently to an R-band observation obtained at the VLT on 1999 April 18. The field of the VLT image contained three additional X-ray sources with apparent optical counterparts which we used to align the two fields. Finally, we aligned the HST and VLT images using eight, non-saturated point sources present in each image (both alignments were performed using IRAF and the tasks geomap & geoxytran). We were then able to project the relative position of S1a and S1b onto the HST field with a positional accuracy of 03. This is shown schematically in Figures 1e,f, where we zoom in the region around S1a and S1b for both the CXO and HST data. It is obvious in the HST image that while there is a clearly identified optical counterpart to the SN 1998bw, there is no variable counterpart within the 03 CXO error circle ( radius) of S1b; we do however, see a variable source just outside the error region. Levan et al. (in preparation) present a detailed study of this source together with three more transients within a radius of of the SN 1998bw as well as narrow field spectroscopy of the SN 1998bw environment. A counterpart search for the other six sources in S1 and S2 in all available catalog data555http://heasarc.gsfc.nasa.gov/db-perl/W3Browse/w3browse.pl failed to identify any known objects at their positions.
| Table 1: CXO Sources Within S1 and S2 | |||||||
| ID | RA | DEC | Countsa | S/N | Indexb | Fluxc | Luminosityc,d |
| (hms) | () | erg cm-2 s-1 | erg s-1 | ||||
| S1a | 19 35 3.31 | -52 50 44.8 | 24 | 4.53 | 1.0(3) | ||
| S1b | 19 35 3.23 | -52 50 43.4 | 52 | 6.47 | 1.6(2) | ||
| S1c | 19 35 0.56 | -52 50 21.2 | 27 | 4.69 | 0.5(3) | – | |
| S2ae | 19 35 25.75 | -52 54 19.0 | 10 | 2.75 | – | – | |
| S2be | 19 35 25.22 | -52 54 21.2 | 7 | 2.66 | – | – | |
| S2c | 19 35 24.65 | -52 54 40.7 | 22 | 4.46 | 1.7(4) | – | |
| S2df | 19 35 23.15 | -52 53 5.6 | 9 | 2.82 | – | – | |
| S2e | 19 35 14.03 | -52 53 51.9 | 23 | 4.19 | 0.7(3) | – | |
abetween keV, bfor an energy spectrum of , cbetween keV, dassuming the source is in ESO G82 at 35.6 Mpc, efluxes for sources with less than 20 counts are derived using a PL index of -1.0, and a conversion factor of ergs s-1 cm-2 ( keV) per 1 count/s ( keV), fsource flux corrected for decreased exposure
From Table 1, we notice that the X-ray luminosities of S1a and S1b marginally exceed the Ultra Luminous X-ray source (ULX) threshold luminosity of erg/s (Fabbiano 1989).666Here we are not discussing the nature of S1c as there is no clear evidence for the association of this source with ESO G82 Further, inspection of the S1b light curve in Figure 2 reveals that the source was ‘on’ during the first 20 ks of our CXO observation, remained ‘off’ for the following ks and possibly turned on again during the last 2 ks of the observation. Counting the GRB-SN source also as a ULX, we then have two of these sources in ESO G82. What is the probability that S1b resides in ESO G82, how common are ULXs in galaxies and what is the nature of S1b, this ultraluminous X-ray transient?
To address the first question we use the log -log relation for the hard X-ray sources by Giacconi et al. (2001): sources/deg2 (the one for the soft sources is smaller, so we use this as a conservative upper limit). Substituting for erg/cm2 s, we find sources/deg2. Correspondingly, we expect 0.01 source within a radius of 10″. We conclude that S1b is most likely associated with the spiral arm of ESO G82 and is not a background source.
There are two extensive studies of ULX populations in normal galaxies (Roberts and Warwick 2000; Humphrey et al. 2003) based on data from Rosat and CXO, respectively. While both studies find substantial evidence for a correlation between the ULX count number with star forming mass, the Rosat survey tends to underestimate their count numbers by a factor of with respect to the CXO. We have, therefore, used the Rosat luminosity distribution DN/dLL, normalized to a -band luminosity of L⊙ to calculate the expected number of ULXs in ESO G82, multiplied by a factor of 10 as indicated by the CXO survey. We derive a total corrected expected number of 0.28 ULXs in ESO G82, a factor of less than the actual observed number of 2. We conclude that if S1a and S1b are both in ESO G82, there is a somewhat unusual concentration of ULXs in this galaxy. Finally, ESO G82 is one of 5 members of a galaxy group. In the CXO data, which covers all members, we do not detect any other X-ray sources from this galaxy cluster. This practically means that, assuming that all members are at the distance of ESO G82, we detect only 2 ULXs from the whole cluster (one of which is a GRB/SN afterglow), both within a radius of . We discuss the results of narrow band photometry of ESO G82 together with the properties of other unusual transients found in the HST data in the SN 1998bw environment in detail in Levan et al. (in preparation).
To test S1b for variability we extracted the source lightcurve in 1000 s bins and performed a Kolmogorov-Smirnov test against a constant flux distribution; this is the prefered method for the low number of counts () which are seen in the source. We derive (where is the probability that the source is constant); thus S1b is consistent with being variable at the 95% confidence level. The transient nature and the energetics of S1b indicate a possible microquasar similar to e.g., GRO J1915105 in our own Galaxy (Mirabel & Rodriguez 1994; Greiner, Morgan & Remillard 1996). This superluminal source exhibits transient behavior in a wide variety of time scales and intensities, and has an apparent (isotropic) X-ray luminosity of erg s-1, well above its Eddington limit (Greiner, Cuby & McCaughrean 2001). Fabbiano et al. (2003) have found in a study with CXO of the ULX sources in the Antennae galaxies that seven out of the nine ULXs are time variable, most likely accreting compact X-ray binaries. Interestingly, the average co-added spectrum of the Antennae ULXs resembles that of Galactic microquasars (Zezas et al. 2002). We conclude that most likely S1b is a microquasar in ESO G82.
4 Systematics of the X-ray light curves of High Energy Transients
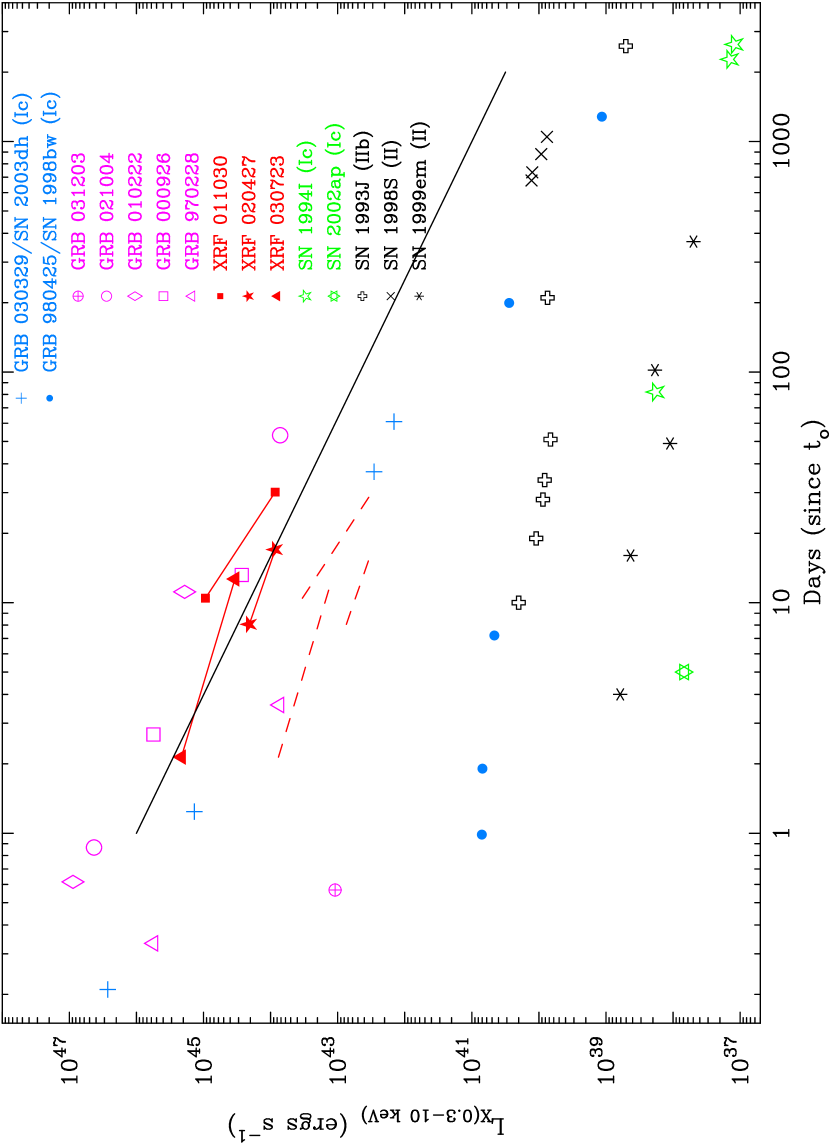
Figure 3 shows, on a common scale, all GRB afterglows with measurements covering several tens of days. There are, unfortunately, only a few curves because such measurements can only be made on GRBs that are relatively nearby, but their light curves should be illustrative. For GRB , we used data points from both the Rossi X-Ray Timing Explorer (RXTE) and XMM reported by Tiengo et al. (2003). The original four points of GRB were reported by Pian et al. (2000); the fifth point is the CXO observation of this paper. For GRBs 021004, 010222, 000926, and 970228, we used data from Sako & Harrison (2002ab), Björnsson et al. (2002), Harrison et al. (2001), and Costa et al. (1997), respectively. We reanalyzed all data, calculated the fluxes in the same energy interval ( keV) and then converted them into (equivalent isotropic) luminosities using a cosmology of , and km s-1 Mpc-1 to eliminate the distance dependence. As has been noted many times, GRB and its early afterglow falls orders of magnitude below the “ordinary” GRBs.
We then compared these curves with both those of supernovae of all types and with XRFs. We collected, reanalyzed and converted flux data to luminosities as described above for the Type IIb SN 1993J (Uno et al. 2002; Swartz et al. 2002), the Type Ic supernovae 1994I and 2002ap (Immler et al. 2002; Sutaria et al. 2003) and the Type II supernovae 1998S and 1999em (Pooley et al. 2002). Each source is indicated with a different symbol in Figure 3. Finally we added the three XRF afterglow light curves available (011030, 020427, and 030723; Bloom et al. 2003; Butler et al. 2003) assuming a redshift of for each of them (there are no redshift measurements for any of these sources). The slopes of the XRF afterglows agree well with those of the typical GRBs and their luminosities are comparable for the distances assumed. Recently, Soderberg et al. (2003b) have reported the counterpart identification of XRF 020903 at a redshift . To reflect this lower distance scale for XRFs, we plot on Figure 3 another set of light curves (dashed lines) corresponding to the luminosities all XRFs mentioned above would have, when placed at a distance of . They still fall well within the ‘typical’ GRB range; thus XRFs would have to be extremely nearby for their X-ray light curves to be distinct from the generic GRB X-ray afterglow.
The resulting plot is striking in several ways. Despite the huge disparity in initial appearance, there are compelling indications of a common convergence of all classes of phenomena plotted - GRBs, GRB , XRFs, and the most energetic supernovae - to a common resting place, L erg s-1 about three to ten years after the explosive event. GRB , being the closest by far of any GRB ever studied, has the virtue of being followed all the way to the “burial ground”, but a simple logarithmic extrapolation of the GRB and XRF light curves places them squarely in this region as well. As the collapsar model has predicted (MacFadyen & Woosley 1999) and observations of SN 2003dh/GRB 030329 have unambiguously confirmed for one case (Hjorth et al. 2003; Stanek et al. 2003), an energetic supernova is expected to underly all GRBs of the long soft variety (Kouveliotou et al. 1993). Zhang, Woosley & Heger (2003) have also predicted that a similar supernova will underly all XRFs.
We proceed now to a wider GRB X-ray afterglow comparison with those plotted on Figure 3. We have often observed GRB afterglows with temporal decays which cannot be described by a single power law. Rather, these afterglows initially decay as or a bit steeper, and at later times the decay index becomes approximately . This steepening is attributed to the fact that the ultrarelativistic outflow is initially collimated within some angle (typically thought to be of order 10 degrees, Frail et al. 2001; see also Van Paradijs et al. 2000, and references therein). The transition to a steeper power law marks the time when the outflow begins to expand laterally, which occurs around the time when , where is the Lorentz factor of the blast wave. Typically, the ‘break time’ when this happens is around days after the burst, but a few cases have much later breaks, if any (e.g., GRB 970508, 000418; Frail et al. 2001). If this is also true for the X-ray afterglows shown in Fig. 3, then they should be extrapolated to later times with a steeper power law than the average of the data shown. In that case, they would reach the luminosity level of SNe sooner, and after that evolve like the SNe, because the blast wave will have become non-relativistic. Thereafter, the system may simply evolve like an X-ray supernova with an energy that has been augmented with that of the initially relativistic blast wave. However, it is tantalizing that a few systems, e.g., GRB 030329 do not yet show such a steep decay even at 30-40 days, possibly indicating that other mechanisms than the standard collimated afterglow contribute to the emission. For example, it has been proposed that the outflows of GRBs are structured (e.g., Mészáros et al. 1998, Rossi et al. 2002, Ramirez-Ruiz et al. 2002), i.e., they eject material with ever lower Lorentz factors at ever larger angles from the jet axis, and this slower material affects the afterglow at ever later times, making it decay more slowly. In this context, it is interesting to note that in GRB 030329 there is evidence for two jet breaks, one at 0.5 days and one at about one week (Berger et al. 2003) from radio to X-ray data. Moreover, WSRT radio data at GHz indicate that there is probably an even wider outflow of yet slower material (Rol et al. in preparation). It is not clear however, that this material produces enough X-ray emission to explain the slow late decays, and so the cause of these may be altogether different.
From Figure 3 alone, it is not clear whether ordinary GRBs and GRB are two distinct classes of events with different X-ray light curves, or they form the boundaries of a continuum of high energy transients that will eventually fill in the entire left side of the figure. A simple theoretical interpretation discussed in § 5 favors a continuum of events. As we discuss, at early times an off-axis observer sees a rising light curve, peaking when the jet Lorentz factor is , and approaching that seen by an on-axis observer at late times. This leads us to believe that the low X-ray luminosity of the recently discovered GRB 031203 may have also been due to its having being viewed substantially off-axis.
4.1 The X-Ray Light Curve of Sources S1 and S2
Figure 4 summarizes the X-ray observations of sources S1 and S2. The first four data points (or upper limits) up to day 200 are from BeppoSAX (Pian et al. 2000) and do not resolve individual sources within S1 and S2; our CXO observations on day 1281 do resolve the sources. We consider two hypotheses: 1) that SN 1998bw and GRB were the same event, both happening within S1, and 2) that GRB occurred within the error box of S2 at a cosmological distance and was thus a more ordinary GRB. Hence the S2 observations are plotted at distance, , such that the afterglow luminosity on day 1 is comparable to ordinary GRBs (see also § 4). The S1 observations are plotted with an assumed distance of 35.6 Mpc, the distance to the supernova. The subtraction of the known fluxes of sources S1b and S1c on day 1281 from the four BeppoSAX points reduces their values by , which is less than the size of the symbols used in the plot. We chose instead to plot the sum of all three S1 sources in Figure 4 (S1sum) to indicate the “expected” flux from extrapolation of the BeppoSAX X-ray light curve of S1 and compare it with the flux of the S1a (the SN 1998bw) point only.
In contrast to the curve for S1 or ordinary GRBs (Figure 3), the curve for S2 shows random variability and is nearly flat (assuming S(3) for the CXO flux of S2 on day 1281). It is consistent with a collection of variable X-ray sources, probably distant AGNs, whose sum sometimes exceeds and at other times falls below the BeppoSAX threshold. The total flux of the CXO observations of the sources within the larger (3 radius) error circle of S2 is within a factor of 1.5 of the brightest flux ever detected by BeppoSAX for S2 (day 1) and the two upper limits given by BeppoSAX on days 2 and 200. If the GRB occurred within S2 it either declined more rapidly than any other GRB ever studied before, in which case the observations of S2 offer no supporting evidence for the connection, or it created a most unusual afterglow that has not declined, in over three years. Moreover, the afterglow on day 1281 would have a luminosity orders of magnitude greater than other GRBs after day 50 (Figure 3). The simplest conclusion is that S2 did not contain GRB and that the BeppoSAX detection was a collection of variable background sources.
The light curve of S1, on the other hand, shows a gentle decline to day 200, followed by a rapid fading, by factor of about 12 to erg s-1, by day 1281 (here we compare the BeppoSAX value at day 1 to S1sum). This last data point is consistent with the light curves of other particularly luminous supernovae, e.g., SN 1993J, that may have had high mass loss rates, but one must take care because SN 1998bw was a Type Ic supernova, which presumably occurred in a Wolf-Rayet star. Such stars are known to have a high wind velocity, and hence a low circumstellar density. Bregman et al. (2003) have recently discussed the X-ray emission of young supernovae and find that most have an X-ray luminosity in the keV energy band less than erg s-1. They do point out exceptional cases - SN 1978K, SN 1996J, SN 1998Z, SN 1995N, and SN 1998S - that have X-ray luminosities from 1039.5 to 1041 erg s-1 even a decade after the event, but these were all Type II. Given the exceptionally large kinetic energy inferred for SN 1998bw (Iwamoto et al. 1998; Woosley et al. 1999), perhaps it is not surprising that its luminosity after three years should place, e.g., about an order of magnitude above common Type Ic supernovae like SN 1994I.
The simplest conclusion here is that the brilliant emission of S1a during the first days was the X-ray afterglow of the relativistic ejecta that made GRB . By day 1281 however, we were seeing the energetic, but not especially relativistic ejecta of SN 1998bw colliding with the presupernova mass loss of its progenitor star. This hypothesis is discussed further in § 5.
5 Theoretical Interpretation
The X-ray afterglow emission of ordinary GRBs is generally attributed to synchrotron emission from shocks as the blast encounters the interstellar or circumstellar medium. Some useful scaling relations for blast waves in which each particle emits a fixed fraction, , of the energy it gains in the shock, have been given by Cohen, Piran & Sari (1998).
| (1) |
with
| (2) |
Fundamentally, and , so that to . This expression is for constant density. Chevalier & Li (2000) also give expressions for the power law scaling of afterglow light curves and find for a medium with ,
| (3) |
with 1.75 to 2.17 for radiative blast waves and 1.38 to 1.75 for adiabatic blast waves if the index of the electron power distribution, , is between 2.5 and 3.0. The curve erg s-1 is plotted in Figure 3, and provides a reasonable description of the early X-ray afterglow lightcurve (when most of the energy is emitted at these frequencies). At observer times longer than a week, the blast wave would, however, be decelerated to a moderate Lorentz factor, irrespective of the initial value. The beaming and aberration effects are thereafter less extreme. If the outflow is beamed, a decline in the light curve is expected at the time when the inverse of the bulk Lorentz factor equals the opening angle of the outflow (Rhoads 1997). If the critical Lorentz factor is less than 3 or so (i.e. the opening angle exceeds 20∘) such a transition might be masked by the transition from ultrarelativistic to mildly relativistic flow, so quite generically it would be difficult to limit the late-time afterglow opening angle in this way if it exceeds 20∘. For reasonable conditions then, the power law declines of both XRFs and luminous GRBs, given in Figure 3, are what might be expected from very relativistic ejecta slowing in either a constant density medium or a circumstellar wind.
However, the very slow decline of SN 1998bw needs a different explanation. GRB , or at least that portion directed at us, was very weak. The total energy of its relativistic ejecta has been estimated as no more than erg (Li & Chevalier 1999) and most of that probably was not directed toward us. Wieringa, Kulkarni & Frail (1999) discuss the possibility of two shocks associated with SN 1998bw, a relativistic one from the GRB and a slower moving, more powerful shock from the supernova, but until very late times when the blast reaches the termination of the presupernova wind, the thermal emission from the supernova itself is expected to be weak because of the low density of the wind (Chevalier 2000).
Two possibilities can be considered. First, that GRB was an “ordinary” (or somewhat subluminous) GRB observed off-axis. This has been suggested many times (e.g. Woosley, Eastman & Schmidt 1999; Nakamura 1999; Granot, Panaitescu, Kumar & Woosley 2002; Yamazaki, Yonetoku & Nakamura 2003; Zhang, Woosley & Heger 2003) with different underlying assumptions regarding the angular distribution of the ejecta. Nakamura (1999) assumes that the jet has sharp edges and the peripheral emission comes from scattering. Woosley et al. (1999) assume that there is a distribution of ejecta energies and Lorentz factors and that, during the burst, we see only the low energy wing moving toward us. The other possibility is that GRB was deficient in energetic gamma-rays at all angles. This is not incompatible with the fact that it may have ejected erg of mildly relativistic () material, but concerns only the very relativistic ejecta, , thought responsible for harder GRBs.
The X-ray light curve can help to distinguish these two possibilities. First, energetic as it may be, at early times the X-ray emission of the underlying subrelativistic supernova is probably negligible. Though the mass loss rate of the Wolf-Rayet star progenitor may have been high, the wind velocity was also large implying a low circumstellar density and inefficient supernova emission (Chevalier 2000). Type Ib and Ic supernovae are typically weak X-ray emitters (Figure 3; Bregman 2003). If we attribute the X-ray emission during the first 200 days to a weak, but on-axis GRB, then the X-ray afterglow should have faded with a power law not too different from the other GRBs. The fact that its decay is nearly flat is inconsistent with any relativistic blast wave in which the electrons emit a constant fraction of the energy gained in the shock (Cohen, Piran & Sari 1998), even in a constant density medium, and argues against an explosion with a single energy and Lorentz factor seen pole on.
The data may be more consistent with a powerful burst seen off-axis (Granot et al. 2002). Even along its axis, the burst may have been weaker than most, but the energy per solid angle could still have been orders of magnitude greater than along our line of sight, accounting for most of the erg inferred from the radio (Li & Chevalier 1999). Because of relativistic beaming, initially we see only the low energy material moving toward us, but as the core of the jet decelerates, its afterglow is beamed to an increasing angle so that more and more energetic material becomes visible along our line of sight. Depending on the geometry, the afterglow luminosity could even temporarily increase. Granot et al. (2002) consider the appearance of GRB at various angles and conclude that the viewing angle needs to have been with the half angle of the most energetic part of the jet, otherwise the optical afterglow would have contaminated the supernova light curve unacceptably. One expects that the X-ray light curve would look similar to some of the plots of Granot et al. with the critical addition of low energy wings of ejecta as calculated by Zhang, Woosley & Heger (2003). This material would raise the luminosity at early times when almost nothing is seen of the central jet. A calculation of this sort must be a high priority for the community.
As time passes, beaming becomes less important and the entire decelerating jet becomes visible, followed a little later by the underlying supernova. The light curve should then decline, as it did between days 200 and 1281 in Figure 3. One can estimate the time scale for when beaming becomes unimportant. For a circumstellar density distribution Waxman, Kulkarni & Frail (1998), assuming typical mass loss and GRB parameters, estimate a radius
| (4) |
and a corresponding time
| (5) |
when the explosion has swept up a rest mass comparable to the initial relativistic ejecta. Here, g cm-1, corresponding to a fiducial mass loss rate of M☉ yr-1 for a wind velocity of km/s, and E52 is the relativistic energy in erg s-1. One thus expects that for times of order several years the relativistic energy will have been radiated away and the emission will become isotropic. We can define this as the onset of the supernova stage.
Evidence of a close association of the early X-ray emission to the overall GRB phenomenon is also presented by Berger, Kulkarni & Frail (2003). They have studied a sample of 41 GRB X-ray afterglows and they find a strong correlation between their X-ray isotropic luminosities () (normalized to hours after trigger) and their beaming fractions. We plot as a function of the GRB isotropic equivalent ray energy, (Figure 5). The data are taken from Berger, Kulkarni & Frail (2003) and we have added data for GRBs 031203, 030329 and 980425, as indicated on the plot. Several points are striking in this empirical relation: GRBs 031203 and 980425 fall well within the overall correlation and extend the association by roughly three orders of magnitude. We have fitted the data without (dashed line) and with (solid line) all the outliers (980425, 031203,000210, 990705), with a power law of index 0.61 and 0.72, respectively; we conclude that the data are consistent with a trend extending roughly six orders of magnitude in X-ray luminosity. Parenthetically, the two outliers in the plot correspond to GRB 000210 (a ‘dark’ GRB) and GRB 990705 (a very bright GRB), and indicate that it may be possible to distinguish GRB subclasses by simply using their X and ray properties, as also pointed out by Berger, Kulkarni & Frail (2003).
Note that the convergence to a “supernova” at three to ten years here does not require all XRFs and GRBs to have a bright optical supernova following the GRB. Bright optical emission is a statement about the radioactivity the supernova made. X-ray emission at 3 years is about its kinetic energy. If the variation in GRB energy and X-ray light curve is simply an effect of viewing angle, then one expects the empty parameter space in Figures 3 and 5 to fill in with future observations. The recent GRB 031203 (Figures 3, 5) may well be the first of these ‘gap’ events (Rodriguez-Pascual et al. 2003; Soderberg et al. 2003a) if the reported redshift of (Prochaska et al. 2003) is confirmed.
6 Conclusions
Our study resulted in the detection, on day 1281, of multiple X-ray point sources in the two BeppoSAX error boxes S1 and S2 originally given (Pian et al. 2000) for the variable X-ray counterpart to GRB (§ 3.1). Based upon the accurately known radio location, the source S1a is definitely the supernova. The sum of all sources in S2 on day 1281 is similar to the maximum observed for this error box by BeppoSAX by a factor that is smaller than 1.5. This is consistent with the hypothesis that S2 did not contain the GRB, but instead some variable X-ray sources that have not disappeared. S1, however, has been consistently observed to decline for days. We conclude that the source S1 contained the GRB and that SN 1998bw and GRB were the same explosion.
Additional insight comes when we compare the X-ray light curve of GRB with the broader family of high energy transients (§ 4). Comparison of published X-ray light curves for GRB, XRF and SNR supports a unification hypothesis, similar to that proposed for AGN. Under this hypothesis all of these sources are associated with standard supernova explosions of massive stars. We can also distinguish a strong unification hypothesis in which the properties of the external medium are also standardized. There is considerable, though still inconclusive, evidence that the strong unification hypothesis is false, though it is still worth testing. These explosions are conjectured to produce an anisotropic, beamed component associated with a decelerating, ultrarelativistic outflow and an unbeamed, isotropic component associated with the slowly expanding stellar debris. The flux associated with the beamed component depends upon the observer direction and declines rapidly with observer time; the closer to the axis the larger the flux and the more rapid is the onset to the typical afterglow decline. As the beamed component decelerates to become entirely non-relativistic, the observed flux will become independent of orientation. Under the strong unification hypothesis a one-parameter (inclination) family of X-ray light curves will be produced, converging asymptotically to a single variation when the beamed component becomes non-relativistic. If only the unification hypothesis is true, we should still be able to observe these trends and estimate the inclination. Indeed, this is roughly what we observe when we plot the isotropic luminosities of GRB, XRF and SNR on a common scale (Fig. 3). It appears that after three years all explosions are subrelativistic, with X-ray luminosity dominated by the stellar debris, erg s-1. We therefore tentatively identify GRB, XRF and SNR as similar objects observed with small, medium and large inclination respectively. More specific to this paper, the observation that SN 1998bw and GRB follow a smooth light curve, which fits this pattern supports the claim that they are the same source.
In § 5 we discussed two possible interpretations of these light curves based upon either a standard phenomenon viewed at different angles or explosions that eject variable amounts of relativistic ejecta. We conclude that the observations, especially the slow initial decline rate, are more consistent with the “off-axis model” in which GRB was a much more powerful GRB seen at an angle greater than about three times the opening angle of the central jet. Emission at early times does not come from this central jet but from wings of less energetic material. After about three years the emission of all these high energy transients becomes isotropic and we see the sub-relativistic ejecta of the supernova interacting with the circumstellar wind. Thus all high energy transients have a common luminosity at three years due to their non-relativistic ejecta, but they follow different decay rates, depending upon the viewing angle, to reach there.
Further, we discussed the stellar environment in that region of the galaxy ESO G where the supernova occurred. The supernova is one member of an X-ray doublet, both of which seem to be in the galaxy and to have spend part of their life cycles as ULXs. The projected distance between the two X-ray sources is pc, which is suggestive of some sort of a very active star forming region.
Finally, we would like to stress that the existence of a relation between the decline rate of the X-ray light curve during the first few weeks and its brightness implies that such measurements might be useful for diagnosing the character and subsequent evolution of a given high energy transient as well as constraining its distance. However, the sparse coverage of the current X-ray afterglow data does not allow us to address fundamental questions such as: Did the rapid decline of GRB continue? Did it/will it level out above or in the vicinity of other Type Ib/c supernovae? At what point does SN 1998bw become like ordinary supernovae? The current data enable us to make a prediction on the unification of the GRB-SN phenomena, which can only be vindicated with further observations, obviously of SN 1998bw, but also of the nearest XRFs and GRBs to fill in the missing parameter space. We strongly encourage, therefore, followup observations of nearby GRBs and XRFs for as long as the available instrumentation allows; we also encourage the calculation of off-axis models of the X-ray light curves, especially for a variable distribution of Lorentz factors and energies.
References
- Berger, Kulkarni, & Frail (2003) Berger, E., Kulkarni, S. R., & Frail, D. A. 2003, ApJ, 590, 379
- Berger et al. (2003) Berger, E. et al., 2003, Nat 426, 154
- Björnsson, Hjorth, Pedersen, & Fynbo (2002) Björnsson, G., Hjorth, J., Pedersen, K., & Fynbo, J. U. 2002, ApJ, 579, L59
- Bloom et al. (1999) Bloom, J. et al. 1999, Nature 401, 453
- Bloom et al. (2003) Bloom, J. et al. 2003, astro-ph/0303514
- Bregman et al. (2003) Bregman, J. N., Houck, J. C., Chevalier, R. A., & Roberts, M. S. 2003, ApJ, 596, 323
- Butler et al. (2003) Butler, N. et al. 2003, GCN #2347
- Cash (1979) Cash, W. 1979, ApJ, 228, 939
- Chevalier (1990) Chevalier, R. A. 1990, in Supernovae, ed. A. G. Petschek, Springer Verlag, p. 91
- Chevalier & Li (2000) Chevalier, R. A. & Li, Z. 2000, ApJ, 536, 195
- Cohen, Piran, & Sari (1998) Cohen, E., Piran, T., & Sari, R. 1998, ApJ, 509, 717
- Costa et al. (1997) Costa, E. et al. 1997, Nature 387, 783
- Frail et al. (2001) Frail, D.A., et al. 2001, ApJ 562, L55
- Fabbiano (1989) Fabbiano, G. 1989, ARA&A, 27, 87
- Fabbiano et al. (2003) Fabbiano, G. et al. 2003, ApJ, 584, L5
- Frail et al. (1997) Frail, D. et al. 1997, Nature 389, 261
- Freedman, Kennicutt, Mould, & Madore (2003) Freedman, W. L., Kennicutt, R. C., Mould, J. R., & Madore, B. F. 2003, A decade of Hubble Space Telescope science. Proceedings of the Space Telescope Science Institute Symposium, held in Baltimore, MD, USA, April 11-14, 2000, edited by Mario Livio, Keith Noll, Massimo Stiavelli. Space Telescope Science Institute symposium series, Vol. 14. Cambridge, UK: Cambridge University Press, ISBN 0-521-82459-1, 2003, p. 214 - 221, 214
- Galama et al. (1998) Galama, T. et al. 1998, Nature 395, 670
- Galama et al. (2000) Galama, T., et al. 2000, preprint
- (20) Giacconi, R. et al. 2001, ApJ, 551, 624
- Granot, Panaitescu, Kumar, & Woosley (2002) Granot, J., Panaitescu, A., Kumar, P., & Woosley, S. E. 2002, ApJ, 570, L61
- Greiner, Morgan, & Remillard (1996) Greiner, J., Morgan, E. H., & Remillard, R. A. 1996, ApJ, 473, L107
- Greiner, Cuby & McCaughrean (2001) Greiner, J., Cuby, J.G. & McCaughrean, M.J. 2001, Nature, 414, 522
- Harrison et al. (2001) Harrison, F. A. et al. 2001, ApJ, 559, 123
- Heise (2003) Heise, J. 2003, American Institute of Physics Conference Series, 662, 229
- Hjorth et al. (2003) Hjorth, J. et al. 2003, Nature, 423, 847
- Humphrey et al. (2003) Humphrey, P. J., Fabbiano, G., Elvis, M., Church, M. J., & Bałucińska-Church, M. 2003, MNRAS, 344, 134
- Iwamoto et al. (1998) Iwamoto, K., et al. 1998 Nature 395, 672
- Kouveliotou et al. (1993) Kouveliotou, C. et al. 1993, ApJ, 413, L101
- Kulkarni et al. (1998) Kulkarni, S. et al. 1998, Nature 395, 663
- Li & Chevalier (1999) Li, Z. & Chevalier, R. A. 1999, ApJ, 526, 716
- MacFadyen & Woosley (1999) MacFadyen, A. & Woosley, S. 1999, ApJ, 524, 262
- Meszaros et al. (1998) Meszaros, P., Rees, M.J., Wijers, R.A.M.J., 1998, ApJ, 499, 301
- Mirabel & Rodriguez (1994) Mirabel, I. F. & Rodriguez, L. F. 1994, Nature, 371, 46
- Mori et al. (2001) Mori, K., Tsunemi, H., Miyata, E., Baluta, C. J., Burrows, D. N., Garmire, G. P., & Chartas, G. 2001, in ASP Conf. Ser. 251, New Century of X-Ray Astronomy, Yokohama Symp. (San Francisco: ASP), 576
- Nakamura (1999) Nakamura, T. 1999, ApJ, 522, L101
- Paczyński (1998) Paczyński, B. 1998, ApJ, 494, L45
- Pian et al. (2000) Pian, E. et al. 2000, ApJ, 536, 778
- (39) Pian, E. et al. 2003, astro-ph/0304521
- Pooley et al. (2002) Pooley, D. et al. 2002, ApJ, 572, 932
- Portegies Swart, Pooley & Lewin (2002) Portegies Zwart, S.F., Pooley, D. & Lewin, W.H.G. 2002, ApJ, 574, 762
- Prochaska et al. (2003) Prochaska, J. et al. 2003, GCN #2482
- Ramirez-Ruiz et al. (2002) Ramirez-Ruiz, E., Celotti, A., Rees, M. J. 2002, MNRAS, 337, 1349
- Rhoads (1997) Rhoads, J. E. 1997, ApJ, 487, L1
- Rodriguez-Pascual et al. (2003) Rodriguez-Pascual, P., Santos-Lleo, M., Gonzalez-Riestra, R., Schartel, N., & Altieri, B. 2003, GCN #2474
- Rossi et al. (2002) Rossi, E., Lazzati, D., Rees, M.J. 2002, MN 332, 945
- Sako & Harrison (2002a) Sako, M. & Harrison, F.A. 2002a, GCN #1624
- Sako & Harrison (2002b) Sako, M. & Harrison, F.A. 2002b, GCN #1716
- Schlegel, Finkbeiner, & Davis (1998) Schlegel, D. J., Finkbeiner, D. P., & Davis, M. 1998, ApJ, 500, 525
- Soderberg et al. (2003a) Soderberg, A.M. et al. 2003a, GCN #2483
- Soderberg et al. (2003b) Soderberg, A.M. et al. 2003b, astro-ph/0311050.
- Soffitta et al. (1998) Soffitta, P. et al. 1998, IAUC 6884
- Stanek et al. (2003) Stanek, K. Z. et al. 2003, ApJ, 591, L17
- Swartz et al. (2003) Swartz, D. A., Ghosh, K. K., McCollough, M. L., Pannuti, T. G., Tennant, A. F., & Wu, K. 2003, ApJS, 144, 213
- Swartz et al. (2002) Swartz, D. A., Ghosh, K. K., Suleimanov, V., Tennant, A. F., & Wu, K. 2002, ApJ, 574, 382
- (56) Tsunemi, H., Mori, K., Miyata, E., Baluta, C. J., Burrows, D. N., Garmire, G. P., & Chartas, G. 2001, ApJ, 554, 496
- Tiengo et al. (2003) Tiengo, A., Mereghetti, S., Ghisellini, G., Rossi, E., Ghirlanda, G., & Schartel, N. 2003, A&A, 409, 983
- Townsley et al. (2002) Townsley, L. et al. 2002, APS Meeting Abstracts, 17061
- Uno et al. (2002) Uno, S. et al. 2002, ApJ, 565, 419
- Wieringa, Kulkarni, & Frail (1999) Wieringa, M. H., Kulkarni, S. R., & Frail, D. A. 1999, A&AS, 138, 467
- Woosley (1993) Woosley, S. E. 1993, ApJ, 405, 273
- Woosley, Eastman, & Schmidt (1999) Woosley, S., Eastman, R., & Schmidt, B. 1999, ApJ, 516, 788
- Waxman, Kulkarni, & Frail (1998) Waxman, E., Kulkarni, S. R., & Frail, D. A. 1998, ApJ, 497, 288
- Yamazaki, Yonetoku, & Nakamura (2003) Yamazaki, R., Yonetoku, D., & Nakamura, T. 2003, ApJ, 594, L79
- Zezas et al. (2002) Zezas, A., Fabbiano, G., Rots, A.H., & Murray, S. 2002, ApJ, 577, 710
- Zhang, Woosley, & Heger (2003) Zhang, W., Woosley, S. E., & Heger, A. 2003, ApJ, in press, astro-ph/0308389