An XMM-Newton observation of the nova-like variable UX UMa: spatially and spectrally resolved two-component X-ray emission
Abstract
In the optical and ultraviolet regions of the electromagnetic spectrum, UX Ursae Majoris is a deeply eclipsing cataclysmic variable. However, no soft X-ray eclipse was detected in ROSAT observations. We have obtained a 38 ksec XMM-Newton observation to further constrain the origin of the X-rays. The combination of spectral and timing information allows us to identify two components in the X-ray emission of the system. The soft component, dominant below photon energies of 2 keV, can be fitted with a multi-temperature plasma model and is uneclipsed. The hard component, dominant above 3 keV, can be fitted with a keV plasma model and appears to be deeply eclipsed. We suggest that the most likely source of the hard X-ray emission in UX UMa, and other systems in high mass transfer states, is the boundary layer.
keywords:
Stars: binaries: eclipsing — stars: novae, cataclysmic variables — stars: individual (UX UMa) — X-rays: stars.1 Introduction
In non-magnetic cataclysmic variables (CVs), a white dwarf primary star is accreting material, via an accretion disc, from a low mass quasi-main sequence secondary star. The disc instability theory predicts a limit cycle behavior when the mass input rate from the secondary is low: mass gradually accumulates in the disc at low optical brightness (quiescence), then rapidly accretes onto the white dwarf during outburst when the disc is hot and bright in the optical and in the UV (see a recent review by Lasota 2001). This is widely accepted as the underlying cause of the dwarf nova phenomenon that is seen in the majority of CVs. In contrast, the mass input rate may be high enough in some CVs for the accretion disc to achieve a steady state. This is thought to be the explanation for nova-like systems, which resemble dwarf novae in outburst at all times.
Simple models suggest that the boundary layer between the primary and the accretion disc should be extremely luminous, emitting up to half the accretion energy. Since most of this is expected to be in X-rays (Pringle, 1977), X-ray observations have become an essential tool for the study of accretion discs in CVs. It was discovered early on that dwarf novae in quiescence were moderately bright hard (2–10 keV) X-ray sources. In outburst, however, the hard component generally became weaker, and sometimes bright soft (1 keV) emission was observed. Combining extensive Einstein X-ray data on CVs with theoretical considerations, Patterson & Raymond (1985a, b) linked this to the optical depth in the boundary layer. For low accretion rates (appropriate for dwarf novae in quiescence), the boundary layer is hot (kT10 keV) and optically thin, cooling via hard X-ray bremsstrahlung emission, while for high accretion rates (dwarf novae in outburst and nova-like systems), it becomes optical thick, emitting a blackbody-like spectrum with kT10–50 eV. Optically thin, outer regions of the boundary layer can explain the residual hard X-ray emission. The recent X-ray, EUV, and optical observations of SS Cygni through an outburst (Wheatley et al., 2003) are a recent confirmation of this basic picture.
Timing observations of eclipsing systems are invaluable as a method for determining the source of the X-ray emission. Observations of high inclination dwarf novae in quiescence have shown evidence for a compact X-ray source that is eclipsed with the white dwarf (Wood et al., 1995a; van Teeseling, 1997; Mukai et al., 1997; Pratt et al., 1999a; Ramsay et al., 2001), although the X-ray emission in OY Car may be from a polar region rather than from an equatorial boundary layer (Wheatley & West, 2003). However, the soft X-ray emission from the dwarf nova OY Car in superoutburst111For the purpose of this paper, normal outbursts and superoutbursts can be considered together. was found to be uneclipsed (Naylor et al., 1988). Based on a comparison with lower inclination (non-eclipsing) systems, they advocated a two-component origin for the soft X-ray emission from dwarf novae in outbursts: a compact region, presumably the boundary layer, and an extended region, possibly due to the scattering of emission from the former in an accretion disc corona or a wind. Naylor et al. (1988) argued that the white dwarf photosphere and the boundary layer are hidden from our view at all orbital phases in OY Car in superoutburst, due to the thickened rim of the accretion disc. Later observations of OY Car in superoutbursts confirm the lack of eclipse and strengthen the scattering interpretation (Pratt et al., 1999b; Mauche & Raymond, 2001).
XMM-Newton provides several key advantages in the study of eclipsing CVs, such as the high effective area of the EPIC instruments both at low and high energies. We have chosen the nova-like system, UX UMa, as our target for this study, which avoids the logistical complication of scheduling an observation at short notice during an outburst of a dwarf nova. UX UMa is the brightest eclipsing nova-like system in the optical and in the X-rays, and has been well studied in ultraviolet in recent years. From UV data, Baptista et al. (1995) claimed the detection of a white dwarf eclipse, which however has been brought into question by Froning et al. (2003). A ROSAT PSPC observation by Wood et al. (1995b) showed no soft X-ray eclipse.
2 Observation
| Instrument | Start | End | Data Mode |
|---|---|---|---|
| MOS 1&2 | 01:07 | 14:33 | Thin Filter, Full Frame |
| pn | 01:30 | 14:23 | Thin Filter, Full Frame |
| RGS 1&2 | 01:06 | 14:40 | Spectro+Q |
| OM | 01:37 | 14:10 | UV Grism 1 |
All times in TT on 2002 June 12.
UX UMa was observed with XMM-Newton on 2002 June 12 for approximately 45 ks (see Table 1 for details). Periods of high background in the EPIC data due to soft proton solar flares were removed using the method described in Pratt & Arnaud (2003). There is one large flare in the middle of the observation, otherwise the data are relatively clean222 Unfortunately, this flare causes us to lose one of the 3 eclipses covered by these data.. Useful exposure times after cleaning were 37895s, 38412s and 28736s for MOS1, MOS2 and pn, respectively.
For the MOS cameras, PATTERNs 0–12 were selected; we use only the well-calibrated single events (PATTERN 0) in the pn analysis. In addition, we select FLAG=0 to exclude events at CCD edges and around bad pixels.
EPIC source light curves were extracted in 1s bins from a circular region of radius . The background light curves were accumulated in 1s bins from an annular region centred on UX UMa, with inner and outer radii of and , respectively. Other sources were identified by eye and removed before the background products were accumulated. The EPIC spectra were extracted in the same regions as described above. Response and effective area files were produced using the SAS tasks rmfgen and arfgen.
For the RGS data, the standard pipeline-produced spectra and response matrix files were used. The ‘fluxed’ RGS1+RGS2 spectrum shown in Figure 2 was produced from these files using the SAS task rgsfluxer.
3 Results
3.1 EPIC spectral characteristics
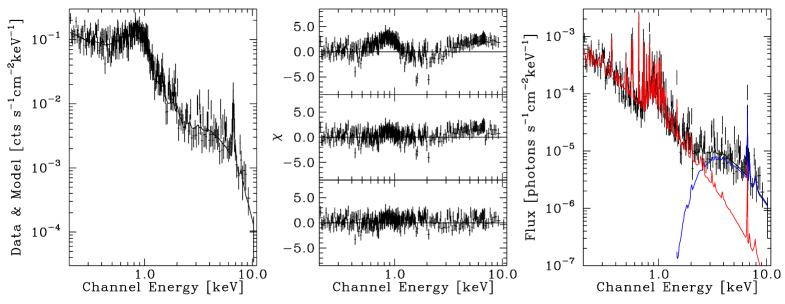
The EPIC spectra of UX UMa are shown in Figure 1. It is clear that the underlying emission is line-rich: the Fe K line is clearly visible, so is the “bump” around 1 keV indicative of the unresolved Fe L complex and other lines. Since we wish to optimise the choice of spectral bands for the extraction of the light curves (Sect. 3.3), we will characterise the orbit-averaged spectrum of the system with the simplest plausible model and use this as a constraint for the choice of light curve bands.
In view of the line-rich nature of the spectrum, we start with a single-temperature mekal model (Mewe et al., 1985, 1986; Liedahl et al., 1995) for thermal emission from collisionally excited plasma. This model fails to fit the data (=3.6), and predicts more flux than observed around 2 keV and less flux than observed in the 1 keV bump and at high energies. Even a multi-temperature plasma does not fit well: with a cemekl (Singh et al., 1996) model, in which the differential emission measure is a power-law of plasma temperature, we obtain =1.6 for 563 degrees of freedom (i.e., formally unacceptable). Moreover, this fit is achieved with best-fit abundances of 3.9 times Solar. While there is no compelling reason to believe UX UMa has exactly Solar abundances, a factor of 3.9 seems too extreme to be believable. Additionally, systematic residuals are evident (see middle panel of Figure 1) even with the overabundant cemekl model.
| Energy Range | /D.O.F. | NH | kT | Norm. |
|---|---|---|---|---|
| (keV) | (cm-2) | (keV) | ||
| 5–10 | 1.25/ 54 | 1.0 | 5.6 | 4.2 |
| 4–10 | 1.04/ 90 | 6.9 | 5.5 | 4.8 |
| 3–10 | 1.06/125 | 5.6 | 5.5 | 4.4 |
| 2–10 | 1.12/171 | 3.8 | 6.0 | 3.8 |
| 1.5–10 | 1.48/216 | 1.7 | 7.7 | 2.8 |
| 1.0–10 | 2.51/318 | 0.0 | 9.8 | 1.8 |
We have therefore investigated the soft and hard parts of the spectrum separately. The strength of the Fe K line at 6.7 keV suggests a strong contribution from thermal plasma with kT in the 1–10 keV range (where Fe is mostly He-like). We thus experimented with the low energy cutoff when fitting a single temperature mekal model to the hard part of the spectrum. When the low energy cutoff 2 keV (Table 2), the fit becomes acceptable: including energies below this threshold leads to a rapid deterioration in the goodness of the fit, and a drastic change in the parameter values. With =3 keV, the best fit values (90% confidence level errors) are NH= cm-2, kT= keV, with a normalization of , and a 3–10 keV flux of 3.2 ergs s-1cm-2 (Solar abundances assumed). Note the high value of NH, which would indicate little contribution of the hard component below 2 keV. The temperature is constrained by the high energy cut-off and by the dominance of the 6.7 keV line.
A single-temperature, solar-abundance mekal model fails to fit the spectrum of UX UMa in the soft (0.2–2 keV) range (=3.5 for 394 degrees of freedom). Although it does much better (=1.5) when abundances are allowed to vary, the required abundances are 0.08 Solar, a value that would make fitting of the hard range extremely problematic. A better solution might be to use multiple-temperature plasma models. Here we have adopted cemekl, resulting in =1.2 (393 degrees of freedom) with NH= cm-2, power law index (for differential emission measure distribution) , kTmax= keV, a normalization of , with a 0.2–2.0 keV flux of 2.3 ergs s-1cm-2 (Solar abundances assumed).
| Comment | NH | kT/kTmax | Flux (10-13 ergs s-1cm-2) | |||
|---|---|---|---|---|---|---|
| (cm-2) | (keV) | 0.2–2 keV | 3–10 keV | 0.2-10 keV | ||
| Soft | 2.28 | 0.37 | 2.87 | |||
| Hard | 0.0 | 2.85 | 3.05 | |||
| (Unabsorbed) | 3.36 | 3.76 | 8.23 | |||
We show the result of the combined fit of these two models over the 0.2–10 keV range in Figure 1 and summarize the parameters in Table 3. We obtain =1.14 for 568 degrees of freedom. The best-fit model to the soft part of the spectrum makes a small contribution to the 3–10 keV band and hence the parameters of the model fit to the hard part of the spectrum are somewhat modified from the results shown in Table 2.
3.2 RGS spectral characteristics
We present the combined RGS spectrum of UX UMa in Figure 2. Continuum is weakly detected at best, while we detect 4 lines with some confidence. We have fitted the first-order spectra from both RGS 1 & 2 simultaneously, after rebinning the raw channels into groups of 4. We have used a power-law continuum model with Gaussians to obtain a rough characterisation of the lines (Table 4). Due to concern over the low signal-to-noise ratio in the continuum, and the large contribution of the background to the total counts, we have experimented with several different rebinning schemes. We can confirm that the best fit values remain within the formal error ranges quoted in Table 4. These 4 lines can be identified with Fe XVII 15.01 and 17.10 Å, (although the Fe XVII line at 17.05 Å cannot be excluded as the identification of the latter), O VIII Ly (18.97 Å), and the resonance line of the O VII triplet (21.60 Å). The intercombination (21.80 Å) and forbidden (22.10 Å) lines of O VII appear to be significantly weaker. Line widths are not significantly detected, but we can establish weak upper limits (full-width at half-maximum, FMHM, of 2000 – 3000 km s-1).

| Species | Lab. | Obs. | Flux |
|---|---|---|---|
| (Å) | (Å) | (10-6 photons s-1cm-2) | |
| Fe XVII | 15.01 | 15.010.03 | 8.0 |
| Fe XVII | 17.10 | 17.090.04 | 9.3 |
| O VIII | 18.97 | 19.000.02 | 11.2 |
| O VII | 21.60 | 21.600.04 | 10.6 |
3.3 Folded Light Curves
We have seen in Sect. 3.1 how the entire 0.2–10. keV EPIC spectrum can be adequately fitted with a two component model. Considerable uncertainties remain in the model parameters, and the low energy part of the spectrum can also be described by more complex models (e.g., partial covering or partial ionisation) but this simple and plausible spectral fitting serves to motivate the choice of bandpasses for the light curve extraction.

We have thus extracted the light curves of UX UMa from the three EPIC cameras in the energy bands 0.3–2.0 keV and 3.0–10 keV. We then folded each of the 6 light curves on the orbital period, using the ephemeris of Baptista et al. (1995)333Froning et al. (2003) found it necessary to shift their 2001 FUV light curves earlier in phase by 0.006 cycles. We have not applied such a shift.. The folded light curves from the three cameras were then averaged to produce a single folded light curve per energy range. These are shown in Figure 3. The light curves, particularly in the hard band, show considerable variability, often in the form of flare-like events lasting several hundered seconds. These are not averaged out in the folded light curve because the observation covered only a few cycles.
We confirm the ROSAT result (Wood et al., 1995b) that no eclipse is seen in UX UMa in the soft X-rays (2.0 keV). However, there does appear to be an eclipse in the hard (3 keV) band, at phase 0.0 as defined by optical/UV eclipse. According to Baptista et al. (1995), the white dwarf eclipse width (mid-ingress to mid-egress) is 0.0530.001 cycles, while totality (2nd to 3rd contact) is a little over 0.04 cycles. To investigate the significance of a hard X-ray eclipse with an assumed duration similar to that of the UV eclipse, we have re-folded the data in 25 bins per cycle, with one of the bins centred on the nominal phase 0.0 using the ephemeris of Baptista et al. (1995). The “eclipse” bin, (corresponding to the two lowest points in Figure 3) has a count rate of 2.51.7 cts s-1 (the error from propagation of counting errors), while the other 24 bins have 34.48.5 cts s-1 (where the error is derived from the standard deviation of these bins, to take into account source variability - see e.g., Wood et al. 1995b). We thus appear to have detected an eclipse at the 3.8 level.
The hard X-ray eclipse thus appears real, but we are unable to place tight constraints on the parameters. We can reproduce the eclipse shape with a wide range of parameters (e.g., a mid-eclipse phase of 0.0–0.01, a mid-eclipse flux between 0–20% of out-of-eclipse flux, an eclipse width of 0.04–0.06 cycles, and eclipse transitions of less than 0.01 cycles).
4 Discussion
The combination of the spectral and timing results strongly suggests that there are (at least) two components in the X-ray emission from UX UMa. The soft component is unabsorbed and uneclipsed and therefore must originate from an extended region. The hard component, which we have newly discovered, is heavily absorbed and eclipsed.
The soft component in UX UMa probably has the same origin as that of OY Car in superoutburst (Naylor et al., 1988; Pratt et al., 1999b; Mauche & Raymond, 2001), and perhaps that of DQ Her (Mukai et al., 2003). That is, the likely origin is scattering of centrally generated X-rays in an extended region. The prominence of the resonance component of the O VII triplet in the RGS spectrum (Figure 2) supports this interpretation. Mauche & Raymond (2001) make a strong case that the scattering medium is the accretion disc wind in the case of OY Car in superoutburst. This may well be the case in UX UMa, since the system is known to have a strong wind (Baptista et al., 1995; Froning et al., 2003). Although we have not been able to confirm this by resolving the X-ray lines, our upper limits for their widths (FWHM of 2000 – 3000 km s-1) are consistent with the FUV line widths (FWHM 1800 km s-1; Froning et al. 2003).
The inferred luminosity of the hard component is ergs s-1 in the 0.2–10 keV band for a distance of 345 pc (Baptista et al., 1995). This value is similar to those found for the residual hard X-ray emission component in non-eclipsing dwarf novae in outburst. Baskill et al. (2001) infer a bolometric luminosity of ergs s-1 for Z Cam in outburst from ASCA data (where there is an additional softer component, which we would not see in UX UMa due to the absorber), while the hard X-ray component of SS Cyg in outburst reaches a minimum at about ergs s-1 in 3–20 keV in the RXTE data (Wheatley et al., 2003). In all three systems, the existing spectra can be fitted with a single temperature thermal model with kT in the 5–10 keV range. These similarities both in luminosity and in temperature suggest that the hard X-ray component that we have discovered in UX UMa is the same as the hard X-ray emission seen in dwarf novae in outburst.
The detection of a hard X-ray eclipse allows us to rule out an extended origin for this emission, such as was suggested (for SS Cyg in outburst) by Wheatley et al. (2003). If the emission is coming from a compact region close to the white dwarf, the most natural source at this position would be the boundary layer. At first sight, this may seem an odd suggestion, since the boundary layer is normally thought of as a source of soft X-rays, and in an eclipsing system, is hidden behind the disc rim. However, UV observations suggest that a disc rim can supply a column density of cm-2 in OY Car Horne et al. (1994), and that the absorber in UX UMa appears to result in deeper absorption in the UV than that seen in OY Car (Baptista et al., 1998). Furthermore, our spectral fits suggest a column of this order of magnitude. Pending more detailed analysis, we suggest that the same material can be responsible for both X-ray and UV absorptions. Crucially, such a column is sufficient to extinguish a soft X-ray source, but will not significantly affect X-rays above 5 keV. Thus these X-rays may well be coming from the more tenuous parts of the boundary layer (Patterson & Raymond, 1985a).
We require more sensitive hard X-ray observations of UX UMa (such as a longer observation with XMM-Newton) to use the eclipse light curves to constrain the nature of the hard X-ray emission in these systems. At the same time, better quality spectra of the soft component are required to study the kinematics of the soft X-ray scattering region in UX UMa.
References
- Baptista et al. (1995) Baptista, R., Horne, K., Hilditch, R.W., Mason, K.O. & Drew, J.E. 1995, ApJ, 448, 395
- Baptista et al. (1998) Baptista, R., Horne, K., Wade, R.A., Hubeny, I., Long, K.S. & Rutten, R.G.M. 1998, MNRAS, 298, 1079
- Baskill et al. (2001) Baskill, D.S., Wheatley, P.J. & Osborne, J.P. 2001, MNRAS, 328, 71
- Froning et al. (2003) Froning, C.S., Long, K.S. & Knigge, C. 2003, ApJ, 584, 433
- Horne et al. (1994) Horne, K., Marsh, T.R., Cheng, F.-H., Hubeny, I. & Lanz, T. 1994,
- Lasota (2001) Lasota, J.P. 2001, New Astron. Rev., 45, 449
- Liedahl et al. (1995) Liedahl, D.A., Osterheld, A.L. & Goldstein, W.H. 1995, ApJLett, 438, 115
- Mauche & Raymond (2001) Mauche, C.W. & Raymond, J.C. 2001, ApJ, 541, 924
- Mewe et al. (1985) Mewe, R., Gronenschild, E.H.B.M. & van den Oord, G.H.J. 1985, A&ASupp, 62, 197
- Mewe et al. (1986) Mewe, R., Lemen, J.R. & van den Oord, G.H.J. 1986, A&ASupp, 65, 511
- Mukai et al. (1997) Mukai, K., Wood J.H., Naylor T., Schlegel E.M. & Swank J.H. 1997, ApJ, 475, 812
- Mukai et al. (2003) Mukai, K., Still, M. & Ringwald, F.A. 2003, ApJ, 594, 428
- Naylor et al. (1988) Naylor, T., Bath, G.T., Charles, P.A., Hassall, B.J.M., Sonneborn, G., van der Woerd, H. & van Paradijs, J. 1988, MNRAS, 231, 237
- Patterson & Raymond (1985a) Patterson, J. & Raymond, J.C. 1985, ApJ, 292, 535
- Patterson & Raymond (1985b) Patterson, J. & Raymond, J.C. 1985, ApJ, 292, 550
- Pratt & Arnaud (2003) Pratt, G.W., Arnaud, M., 2003, A&A, 408, 1
- Pratt et al. (1999a) Pratt, G.W., Hassall, B.J.M., Naylor, T. & Wood, J.H., 1999, MNRAS, 307, 413
- Pratt et al. (1999b) Pratt, G.W., Hassall, B.J M., Naylor, T., Wood, J.H. & Patterson, J. 1999, MNRAS, 309, 847
- Pringle (1977) Pringle, J.E. 1977, MNRAS, 178, 195
- Ramsay et al. (2001) Ramsay, G., Poole, T., Mason, K., Córdova, F., Priedhorsky, Breeveld, A., Much, R., Osborne, J., Pandel, D., Potter, S., West, J. & Wheatley, P. 2001, A&A, 365, 288
- Singh et al. (1996) Singh, K.P., White, N.E. & Drake, S.A. 1996, ApJ, 456, 766
- van Teeseling (1997) van Teeseling A. 1997, A&A, 319, L25
- Wheatley & West (2003) Wheatley, P.J. & West, R.G., MNRAS, 345, 1009
- Wheatley et al. (2003) Wheatley, P.J., Mauche, C.W. & Mattei, J.A. 2003, MNRAS, 345, 49
- Wood et al. (1995a) Wood, J.H., Naylor, T., Hassall, B.J.M. & Ramseyer, T. 1995a, MNRAS, 273, 772
- Wood et al. (1995b) Wood, J.H., Naylor, T. & Marsh, T.R. 1995b, MNRAS, 274, 31