Magnetic fields in merging spirals – the Antennae
We present an extensive study of magnetic fields in a system of merging galaxies. We obtained for NGC 4038/39 (the Antennae) radio total intensity and polarization maps at 8.44 GHz, 4.86 GHz and 1.49 GHz using the VLA in the C and D configurations. The galaxy pair possesses bright, extended radio emission filling the body of the whole system, with no dominant nuclear sources. The radio thermal fraction of NGC 4038/39 was found to be about 50% at 10.45 GHz, higher than in normal spirals. Most of the thermal emission is associated with star-forming regions, but only a part of these are weakly visible in the optical domain because of strong obscuration. The mean total magnetic fields in both galaxies are about two times stronger (G) than in normal spirals. However, the degree of field regularity is rather low, implying tangling of the regular component in regions with interaction-enhanced star formation. Our data combined with those in H i, H, X-rays and in far infrared allow us to study local interrelations between different gas phases and magnetic fields. We distinguish several radio-emitting regions with different physical properties and at various evolutionarystages: the rudimentary magnetic spiral, the northern cool part of the dark cloud complex extending between the galaxies, its warm southern region, its southernmost star-forming region deficient in radio emission, and the highly polarized northeastern ridge associated with the base of an unfolding tidal tail. The whole region of the dark cloud complex shows a coherent magnetic field structure, probably tracing the line of collision between the arms of merging spirals while the total radio emission reveals hidden star formation nests. The southern region is a particularly intense merger-triggered starburst. Highly tangled magnetic fields reach there strengths of G, even larger than in both individual galaxies, possibly due to compression of the original fields pulled out from the parent disks. In the northeastern ridge, away from star-forming regions, the magnetic field is highly coherent with a strong regular component of G tracing gas shearing motions along the tidal tail. We find no signs of field compression by infalling gas there. The radio spectrum is much steeper in this region indicating aging of the CR electron population as they move away from their sources in star-forming regions. Modelling Faraday rotation data show that we deal with a three-dimensionally curved structure of magnetic fields, becoming almost parallel to the sky plane in the southeastern part of the ridge.
Key Words.:
Galaxies: general – Galaxies: magnetic fields – Galaxies: interactions – Galaxies: individual: Antennae – Radio continuum: galaxies1 Introduction
Violently disrupted galaxies show strong departures of gas flow patterns from axial symmetry and from symmetric spiral shape. Encounters of gaseous disks at velocities in excess of 100 km/s give rise to galaxy-scale shocks and velocity gradients. In this case magnetic fields can provide useful information on the gas flows in the sky plane, complementary to any emission-line radial velocity studies. In particular the magnetic field can trace regions of gas compression (like in Virgo Cluster spirals, Chyży et al. chyzy00 (2000), chyzy02 (2002)) and of shearing motions stretching the magnetic fields. It is not yet known which gas phases have the strongest influence on the magnetic field evolution. While in normal spirals various gas phases seem to be coupled via density waves (cold gas in dust lanes, warm and hot ionized gas in star-forming regions in spiral arms) in violently interacting galaxies various gas phases appear often separated. Cold, warm and hot gas may occupy different disk regions. This offers an opportunity of studying the association of various magnetic field structures with particular phases of the interstellar medium.
The degree to which the field structure follows the gas flows is unknown. While concepts of magnetic field generation (see e.g. Beck et al. beck96 (1996), Widrow widrow (2002)) postulate the turbulent magnetic diffusion coefficient to be by three orders of magnitude greater than that resulting from flux freezing, there are also examples of magnetic fields following to a large extent the large-scale gas flows (Beck et al. beck99 (1999)). In a strongly turbulent environment the magnetic field may even become insensitive to strong density wave effects (Soida et al. soida (2001)).
Violently interacting galaxies also constitute a good tool to study the global magnetic field evolution. During their close encounters the timescale of changing their magnetic field structures is of order of years, much shorter than e.g. the timescale of classical dynamo process (e.g. Brandenburg & Urpin brand (1998)) but comparable to that of fast dynamos (Moss et al. moss (1999), Hanasz et al. hanasz (2002)). There is a question to which degree external influences can amplify magnetic fields via the effects of compression and/or by providing a strong non-azimuthal magnetic fields in a manner similar to the dynamo process. To distinguish between the compressed, highly anisotropic fields and unidirectional ones, generated by the dynamo process, Faraday rotation information, thus polarization studies at least at two frequencies are needed.
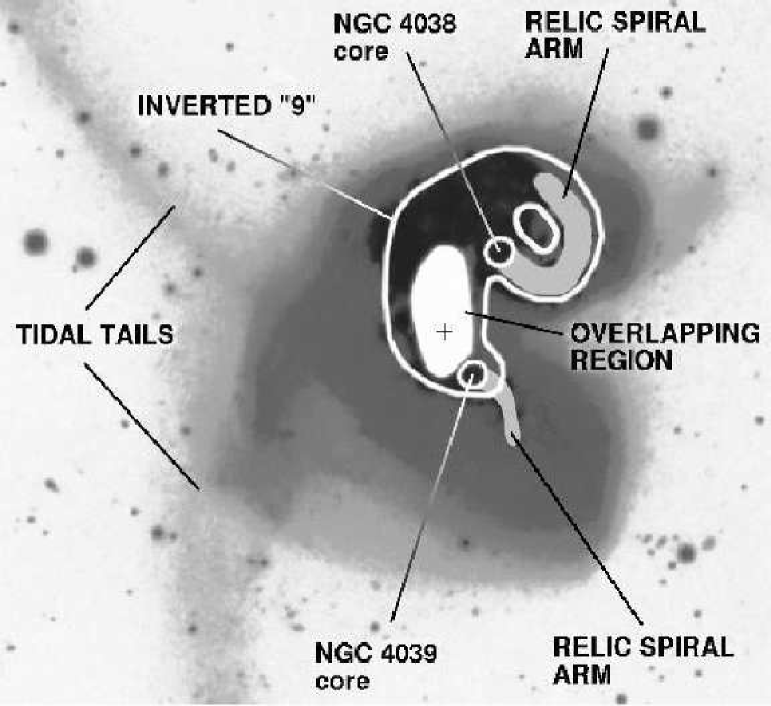
In this work we present a high-resolution, three-frequency radio polarization study of the pair of merging spirals NGC 4038/NGC 4039, called “the Antennae”. This is the first study dedicated to magnetic fields in a system of merging galaxies. The galaxies are known to be strongly tidally interacting (Toomre & Toomre toomre (1972)) and forming two impressive tidal tails (see cartoon sketch in Fig. 1). The neutral gas makes a long extension along the southern tail (Hibbard et al. hibbard (2000)) but the northern extension is devoid of neutral gas. The galaxies are subject to a burst of star formation (Liang et al. liang (2001) and references therein). The young star clusters are distributed along a peculiar structure resembling an “inverted 9” (Fig. 1), encircling the northern galaxy from the west, then running along the eastern edge of the whole system, then turning west to joining the southern member of the pair. A huge complex of cold dusty matter is visible in the sub-mm observations with SCUBA (Haas et al. haas (2000)) in the “overlap area” of the galaxy disks concentrated around RA Dec (denoted by a cross in Fig. 1). It coincides also with a strong CO peak found by Stanford et al. (stanford (1990)). The mid-infrared ISO observations (Mirabel et al. mirabel (1998)) shows that the most intense starburst occurs in optically obscured place to the east from the southern galaxy where emission comes from gas and dust heated by massive stars. The ionized gas in NGC 4038/39 shows a complex velocity field (Amram et al. amram (1992)) while the X-ray emitting hot gas has a peculiar distribution with the evidence of collimated outflows (Read et al. read (1995)). High resolution Chandra ACIS data (Fabbiano et al. fabbiano (2001)) reveals a population of extremely luminous point-like sources (probably black hole binaries) and soft thermal X-ray emission associated with star-forming knots but sometimes also intermingle with warm (H) gas.
The galaxy pair NGC 4038/39 has been studied using VLA at 1.47 GHz and 4.89 GHz by Hummel & van der Hulst (hummel (1986)). They found a radio ridge extending along the mentioned “inverted 9” structure, however, their maps do not show much extended structure, moreover the authors did not analyze the polarization information.
In this paper we present maps of NGC 4038/39 in the VLA D-configuration at 8.44 GHz, combined C+D-array maps at 4.86 GHz as well as C-array data at 1.49 GHz, much more sensitive to extended diffuse emission than the earlier maps by Hummel & van der Hulst (hummel (1986)). After presenting some observational aspects of our radio data in Sect. 2, we introduce the total radio and polarized intensity maps in Sect. 3 together with the distribution of spectral index, Faraday rotation and depolarization. Decomposition of thermal and nonthermal radio intensity as well as polarization data results in identifying distinct radio-emitting regions (Sect. 4). By means of profiles along different direction across the merging system we study the association of magnetic fields with different gas phases using available data in radio continuum, H i, optical, H, X-ray, and dust emission (Sect. 4.1). In Sect. 4.2 we discuss total and regular magnetic field strengths derived in various parts of the interacting system and compare them to values known from other galaxies. We give some idea of the magnetic field origin and its regularity in Sect. 4.3. Finally, we present a tentative scenario of the gas and magnetic field evolution in the Antennae in Sect. 4.4. The summary and suggestions of further works are given in Sect. 5.
2 Observations and data reduction
Observations were made at 8.44 GHz and at 4.86 GHz, using the VLA of the National Radio Astronomy Observatory111NRAO is a facility of National Science Foundation operated under cooperative agreement by Associated Universities, Inc. in the compact D-array configuration. Additional observations at 4.86 GHz and the measurements at 1.49 GHz were performed with the C-array. The observation times in C-array were 5.5 hours at 1.49 GHz and 6 hours at 4.86 GHz, while in D-array the observation times were 5 hours at 8.44 GHz and 5.5 hours at 4.86 GHz.
The intensity scale at all frequencies was calibrated by observing 3C286, adopting the flux densities of Baars et al. (baars (1977)). The position angle of the linearly polarized intensity was calibrated using the same source with an assumed position angle of 33. At 4.86 GHz and 8.44 GHz the calibrator 1157-215 was used to determine the telescope phases and the instrumental polarization. To check these calibration procedures 3C138 was observed once each day. At 1.49 GHz the phase calibrator was 1156-221.
The data reduction has been performed using the AIPS data reduction package. The edited visibility data, calibrated and self-calibrated in phase, were Fourier transformed to obtain maps in Stokes parameters I, Q and U at three frequencies. At 4.86 GHz the maps were made using a combination of C and D-arrays with various weightings for particular purposes. The combined data were self-calibrated in phase. To increase the sensitivity to extended structures we merged the I, Q and U data at 8.44 GHz in the UV plane with observations at 10.45 GHz made by us with the 100-m Effelsberg radio telescope222The 100-m telescope at Effelsberg is operated by the Max-Planck-Institut für Radioastronomie (MPIfR) on behalf of the Max-Planck-Gesellschaft. The brightness values at 10.45 GHz were rescaled to 8.44 GHz assuming a spectral index of 0.7. Faraday rotation measures only scarcely exceed 100 rad m-2 (Fig. 6) which corresponds to a polarization angle offset of between 10.45 and 8.44 GHz. By comparing the merged VLA/Effelsberg maps and pure VLA ones we state that any possible polarization angle offset between 10.45 GHz and 8.44 GHz does not introduce visible artifacts in the merging process.
Finally the Q and U maps at three frequencies were combined to get distributions of the linearly polarized intensity (corrected for the positive zero level offset) and of the position angle of the apparent magnetic vectors (B-vectors; not corrected for Faraday rotation observed E-vectors rotated by ).
3 Results
3.1 Total radio intensity
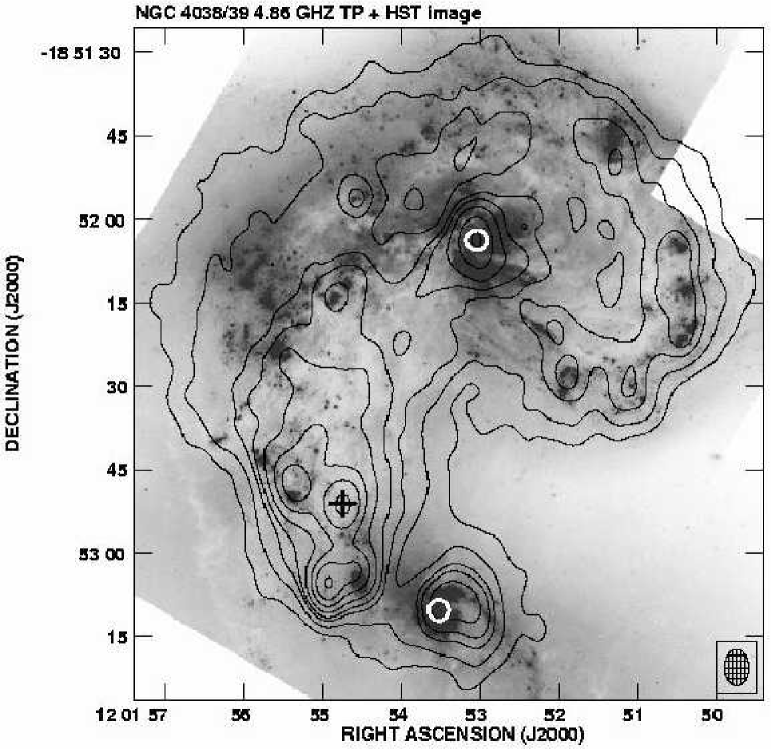
Details of the distribution of total radio intensity in NGC 4038/39 are best visible in our combined high-resolution C+D-array map at 4.86 GHz (Fig. 2). The bright emission in the NW region follows the “inverted 9” feature as already described by Hummel & van der Hulst (hummel (1986)). Local total intensity peaks coincide with the nuclear regions of both galaxies. An extended, radio-bright feature is located in the southern part of mentioned large complex of dark clouds where a mixture of dark patches and H ii regions is present (Whitmore et al. whitmore (1999)). While localized peaks along the “inverted 9” in the NW portion coincide with particular star-forming complexes, the mentioned radio-bright region does not show particularly bright H-emission and its peaks seem to be loosely associated with optically bright regions (Fig. 2). No radio emission was detected from the gas-poor northern tidal plume.
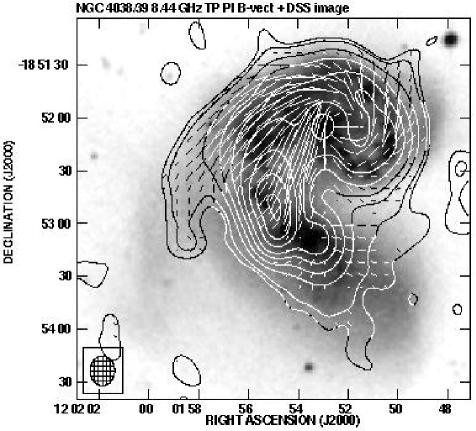
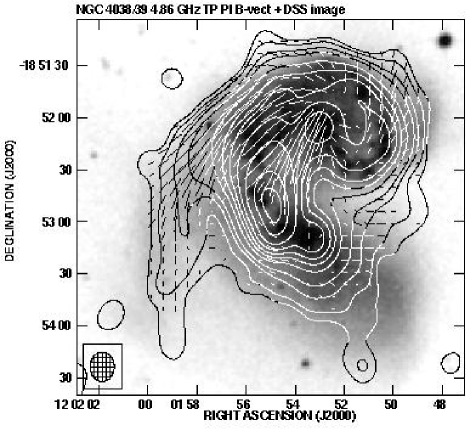
The low-resolution total intensity maps of NGC 4038/39 at 8.44 GHz and 4.86 GHz (Fig. 3) show consistently a strong emission peak in the southern part of the dark cloud complex extending between the galaxies. Some weak maxima coincident with their nuclei are seen as well. Both maps show also an extension along the southern gas-rich tidal tail. No emission is detected from the gas-poor northern tail. A weak tongue of emission towards the southwest is seen consistently at both frequencies and is probably real. The total intensity maps at both frequencies also possess a steep brightness gradient along the NE straight boundary of the interacting pair.
3.2 Polarization maps
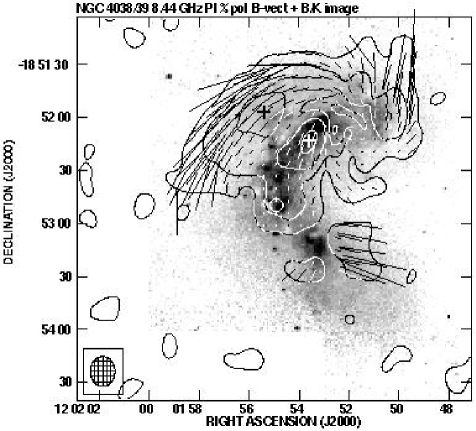
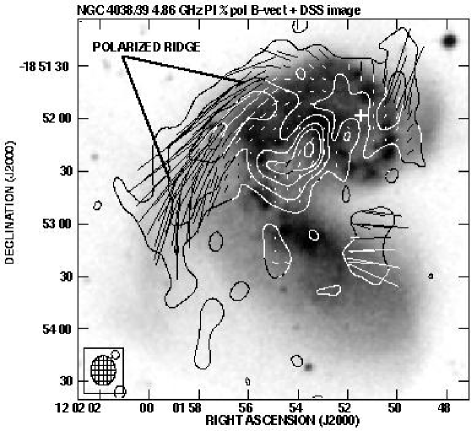
The maps of polarized intensity at 8.44 GHz and 4.86 GHz (Fig. 3) are suggestive for several structural components. In the NW disk (“inverted 9”) the polarized emission coincides with the optical one (Fig. 3 right panel). However, the orientations of apparent B-vectors do not follow the “inverted 9” feature. Instead, they form a rudimentary spiral shifted westwards from the northern galaxy nucleus, being centered on RA DEC (Fig. 3 right panel, a white cross). The B-vectors at both frequencies are inclined by some with respect to the total intensity ridge, thus, this feature is not caused by Faraday rotation effects. Close to the centre of northern galaxy the B-vectors are almost radial, following local dust lanes visible on HST image in Fig. 2. Some traces of another spiral with a very large pitch angle are present around the nucleus of the southern galaxy. They are best visible at 8.44 GHz (Fig. 3 left panel).
In the NE region of the interacting system the apparent B-vectors run parallel to a rather sharp, linear NE boundary of the optical emission. The map of polarized intensity at 8.44 GHz, much less affected by Faraday effects, shows a bright peak at RA DEC (Fig. 4 left panel, black cross). The polarization degree increases along this feature from about 5% in its northern part to about 40% at its southernmost tip. The polarized intensity at 4.86 GHz shows more clearly the southern part of this structure and forms a bright ridge extending along the NE boundary of the optical image of the system (Fig. 4 right panel).
Another polarization component apparently extends along the complex of dark clouds visible in the B/K colour index image (Hibbard et al. hibbard (2000)) shown in Fig. 4 (left panel). It is separated from the polarized ridge discussed above by a shallow depression, weakly visible at 8.44 GHz, but becoming much more conspicuous at 4.86 GHz. The northern part of the dark dust complex, devoid of observable H emission (Whitmore et al. whitmore (1999)) coincides with a local maximum of polarized intensity (see Fig. 4 left panel, white cross). However, at this position the polarization degree is rather moderate: about 10% at 8.44 GHz and only 6% at 4.85 GHz. The polarized emission at 8.44 GHz extends southwards along the region of strong reddening towards the bright total intensity peak (marked in the figure by a white circle). The polarization degree decreases southwards, becoming only 1% at 8.44 GHz at the position of the total intensity maximum. The polarized intensity at 4.86 GHz decreases southwards even faster.
3.3 Spectral index distribution
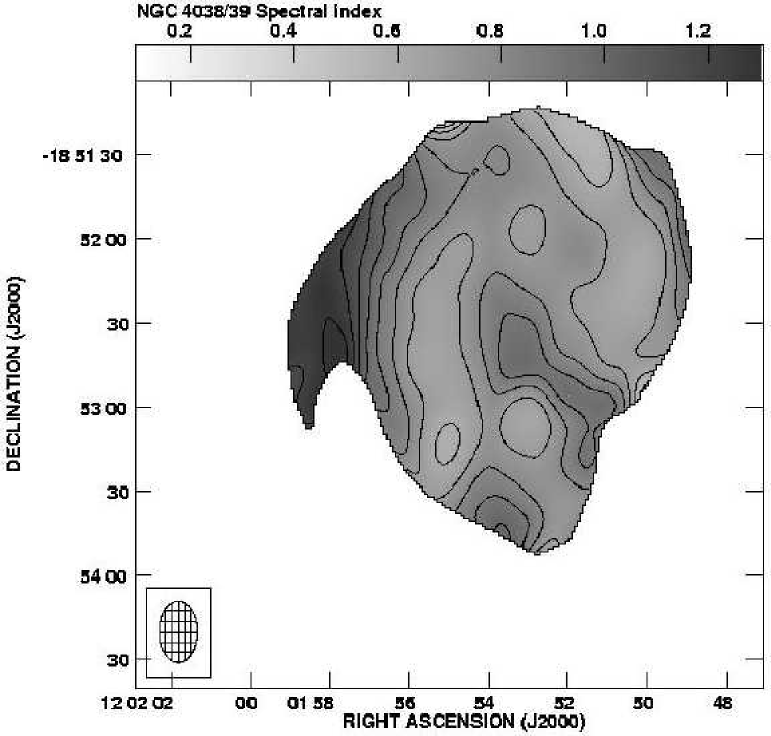
The spectral index distribution in NGC 4038/39 (Fig. 5) has been obtained by fitting for each map pixel a power law S to the values of total intensity at three frequencies. The discussed interacting pair is characterized by strong variations of the spectral index over its surface. The western part of the “inverted 9” has a rather flat spectrum with , flattening northwards to 0.53. The radio spectrum also gradually flattens along the dark cloud complex in the central region, changing from about 0.67 at its northern end to 0.58 in the radio bright region coincident with the southern part of dust complex. Nuclear regions of both galaxies also have a rather flat spectrum with of about 0.64.
In contrast to that the gap between the galaxies, showing also depression in total radio intensity (Fig. 3) has a spectral index of about 0.94. A very steep spectrum has been found along the northeastern polarized region: most of it has , steepening towards the tidal tail to values of 1.2–1.3. There is also some spectral steepening across the ridge: from 0.90–0.93 at its interface with a central cloud complex to values above 1.0 at the outer boundary.
3.4 Distribution of Faraday rotation and depolarization
Maps of Faraday rotation and depolarization in NGC 4038/39 (Figs. 6 and 7) have been computed between the frequencies of 4.86 and 8.44 GHz using the naturally weighted maps at the resolution of . The galaxies lie at Galactic longitude and Galactic latitude where Simard-Normandin & Kronberg (simard (1980)) show low foreground rotation measures changing sign from place to place and absolute values rad m-2. For this reason no correction for the foreground Faraday rotation has been applied.
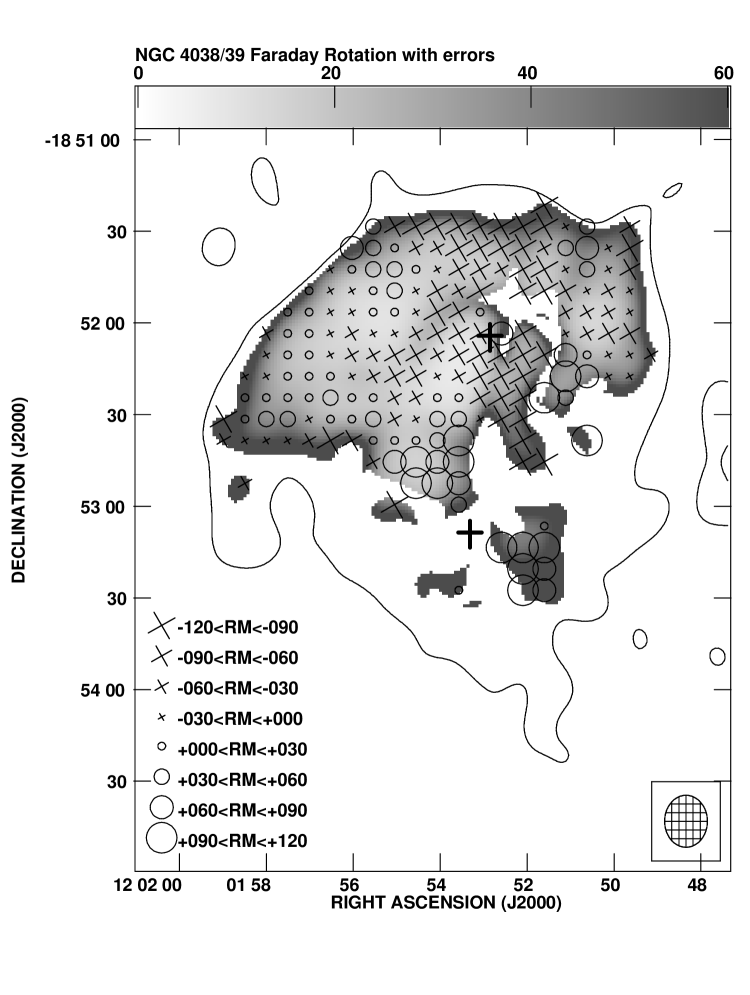
Over most of the eastern part of NGC 4038/39 and in the westernmost part of “inverted 9” the Faraday rotation measures (RM) are generally small. Their absolute values in these regions exceed 50 rad m2 only in small areas comparable to the beam size (Fig. 6). The dividing line between the positive and negative values may depend on possible bias due to the foreground Faraday rotation. However, some statements do not depend on the uncertainty of foreground RM by some rad m-2. We note first the vertical belt of large negative RM’s (between and rad m-2), about wide, running north-south through the nucleus of the northern galaxy. Further to the south, around the southern galaxy nucleus, sudden RM jumps to strongly positive values up to rad m-2 are visible. We also note a substantial coherence of the sign of RM values. Independently of the assumed foreground rotation we get invariably a large domains of several beam areas having a constant sign of Faraday rotation measure and hence of the magnetic field direction.
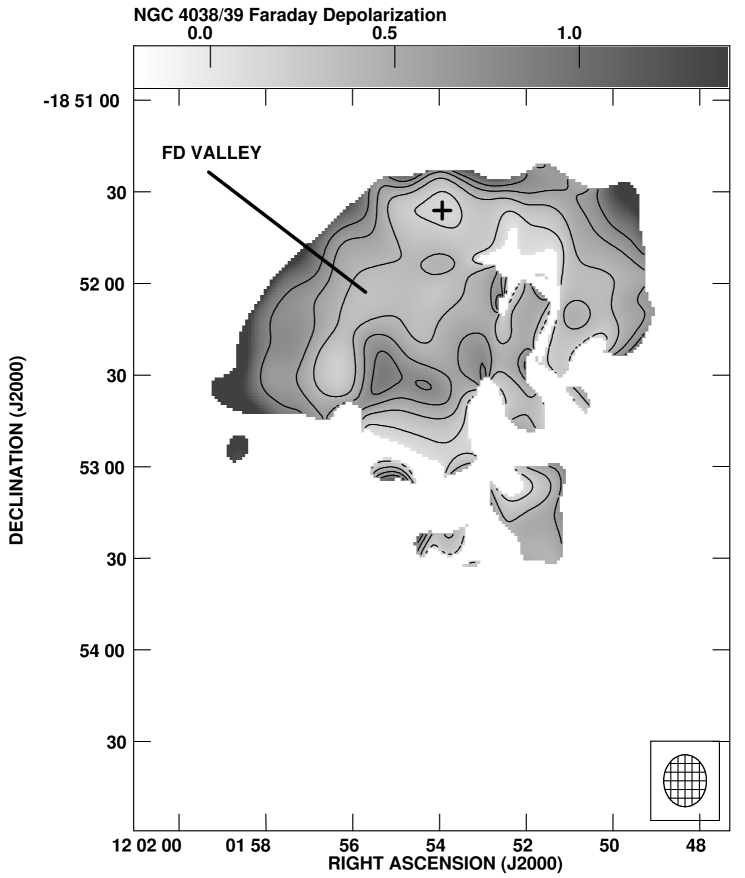
In the eastern region of NGC 4038/39 the Faraday depolarization (FD=polarized intensity at 4.86GHz polarized intensity at 8.44GHz; Fig. 7) forms a valley with 0.2–0.3 along the channel occupied by the hot gas detected there by Chandra (Fabbiano et al. fabbiano (2001)). Very strongly depolarized regions (FD) also appear near the nuclei of both galaxies. Another strong Faraday depolarization (FD) occurs around RA DEC (marked by a black cross in Fig. 7) where the Faraday rotation measure changes locally from rad m-2 to +50 rad m-2.
4 Discussion
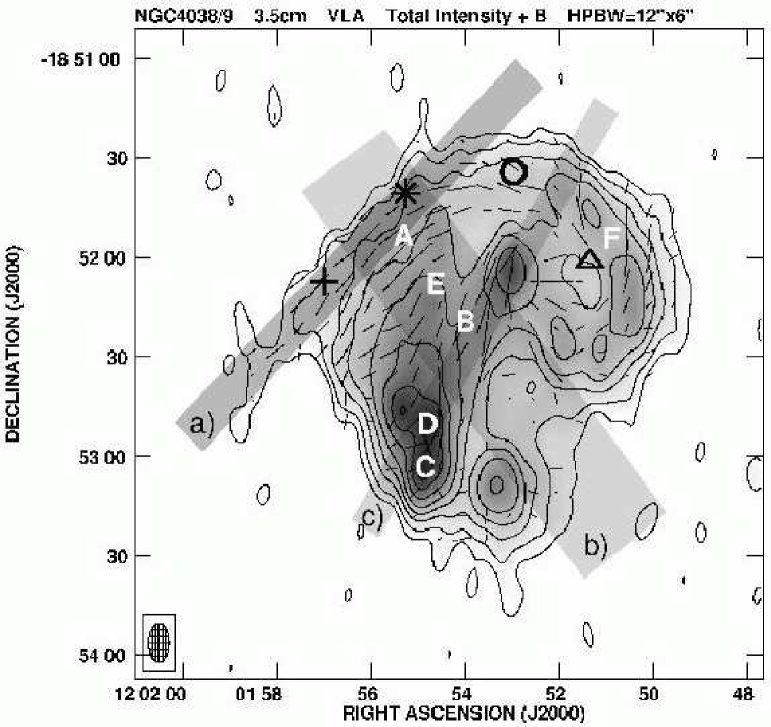


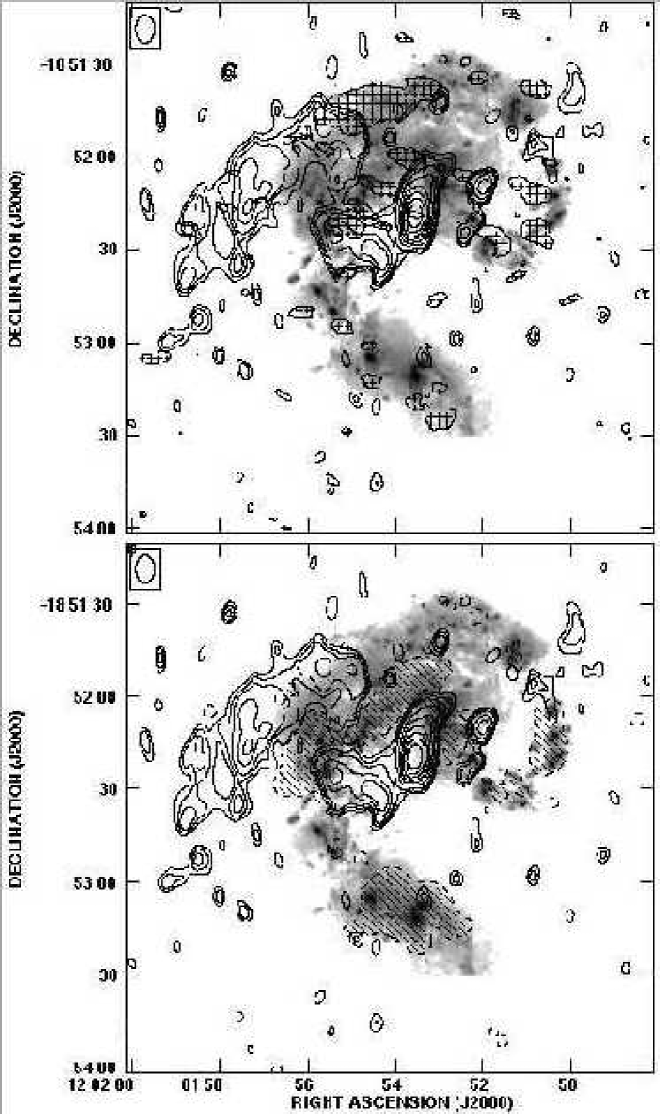
To study the physical conditions and evolutionary stages of various locations in the Antennae system and interrelations of magnetic fields with particular phases of the interstellar medium, a comparison of our radio data with other spectral domains is necessary. For this purpose, mainly based on our radio maps in total and polarized intensity, we define several distinct regions labelled by letters A–F in Fig. 8. Region A is located in the middle of the polarized northeastern ridge, at the point where a bright ridge of polarized intensity coexists with a similarly oriented feature in H i (Fig. 13). Regions B, C and D denote various parts of the so-called “overlap region”, constituting a dark cloud complex extending between the two interacting galaxies. Region B lies at its northern end while regions C and D denote the radio total intensity peaks at its southern tip (Fig. 2). As region E we define the middle of the extended pool of X-ray emitting gas (Fig. 12, Fig. 13). As region F we term the NW part of the relic spiral arm in the NW region of the system.
In the following subsection, using our total intensity maps at 8.44, 4.86 and 1.49 GHz, we first construct and present maps of thermal and nonthermal intensity of NGC 4038/39. We then analyze in next subsections the local interrelations of different ISM phases in regions A–F by comparing various distributions of radiation of different species along and across these particular regions.
4.1 Thermal and nonthermal intensity in NGC 4038/39
Our total intensity maps at 8.44, 4.86 and 1.49 GHz allow to separate the thermal and nonthermal radio emission components, assuming a constant nonthermal spectral index over the whole radiation area. However, there are local exceptions from this assumption where spectral index become particularly steep. There are regions in which the observed spectral index reaches the value of 1.0 (the radio “valley” between the galaxies on the western side of the system) or even 1.2–1.3 (the base of the tidal tail, Fig. 5), probably because of strong energy losses by CR electrons.
To compute the maps of thermal and nonthermal intensity (and thus also the map of thermal fraction) we tried to find the best value which could be adopted for mean in possibly largest area of the disks ignoring mentioned regions of strong electron energy losses. For this purpose we used the integrated spectrum of NGC 4038/39 (Fig. 9) constructed from the available literature data and our own measurements. The flux density at 10.45 GHz was obtained by integrating our Effelsberg map in circular rings. The spectrum can be equally well represented by a whole range of combinations of nonthermal spectral index and mean thermal fraction at 10.45 GHz ranging from = 0.69 = 0 to = 0.8 and = 0.5. All fits between these values lie well within 3 flux density errors (Fig. 9) and yield very similar r.m.s. residuals. A further increase of a mean thermal fraction (hence a steeper nonthermal spectrum) causes a rapid increase of residuals and yields an unrealistically curved total spectrum. On the other hand, adopting a flatter nonthermal spectrum () seems unreasonable in computing the maps because large disks areas are occupied by a spectrum steeper than this value. We used thus a compromise assumption of =0.8 and computed maps of thermal and nonthermal intensity as well as the map of thermal fraction at 8.44 GHz, excluding from the analysis regions with a steeper spectrum. While this assumption is valid for the area covered by optically bright galaxies, the nonthermal spectrum is definitely steeper in the vicinity of the radio extension along the northeastern tail and in the radio “valley” between the galaxies.
We note here that a mean thermal fraction of 0.5 at 10.45 GHz implied by this assumption is larger than the mean value of at 10 GHz estimated for 74 galaxies from the Shapley-Ames survey by Niklas et al. (niklas (1996)). This is not surprising as the pair NGC 4038/39 actively forms stars and produces ionized gas very efficiently.
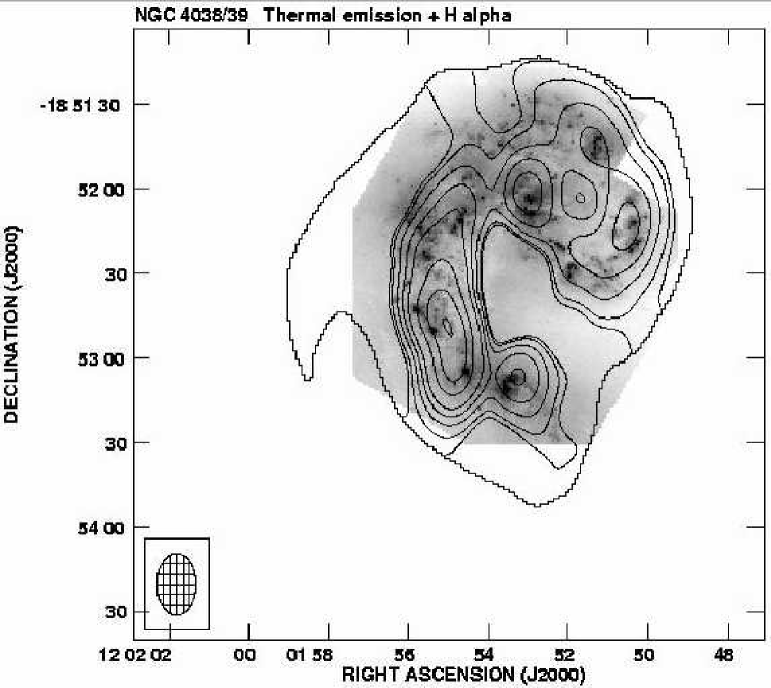
Regions of substantial thermal fraction (fth at 8.44 GHz of 30%–40%) are found at the positions of the nuclei, in the western part of the “inverted 9” (region F), and along the dark cloud complex. In the southern part of the obscured regions C and D the thermal fraction reaches some 47%. The distribution of thermal brightness at 8.44 GHz is compared to the distribution of H ii regions in Fig. 10. The ridge of enhanced thermal intensity follows well the chain of H ii regions in the “inverted 9”, making some minimum east of the northern galaxy nucleus, (close to our region B) then following the belt of H ii regions along the central dark cloud. The thermal brightness has a maximum in the southern part of the cloud, while no particular peak in H emission nor any concentration of H ii regions is seen. This is discussed further in Sect. 4.1.3.
The nonthermal intensity distribution (Fig. 11) is smoother and fills the whole system, as expected from smearing small-scale features by the cosmic ray propagation. The southern part of the central dark cloud shows also a substantial enhancement of nonthermal intensity.
4.1.1 Star formation in the vicinity of the northeastern ridge
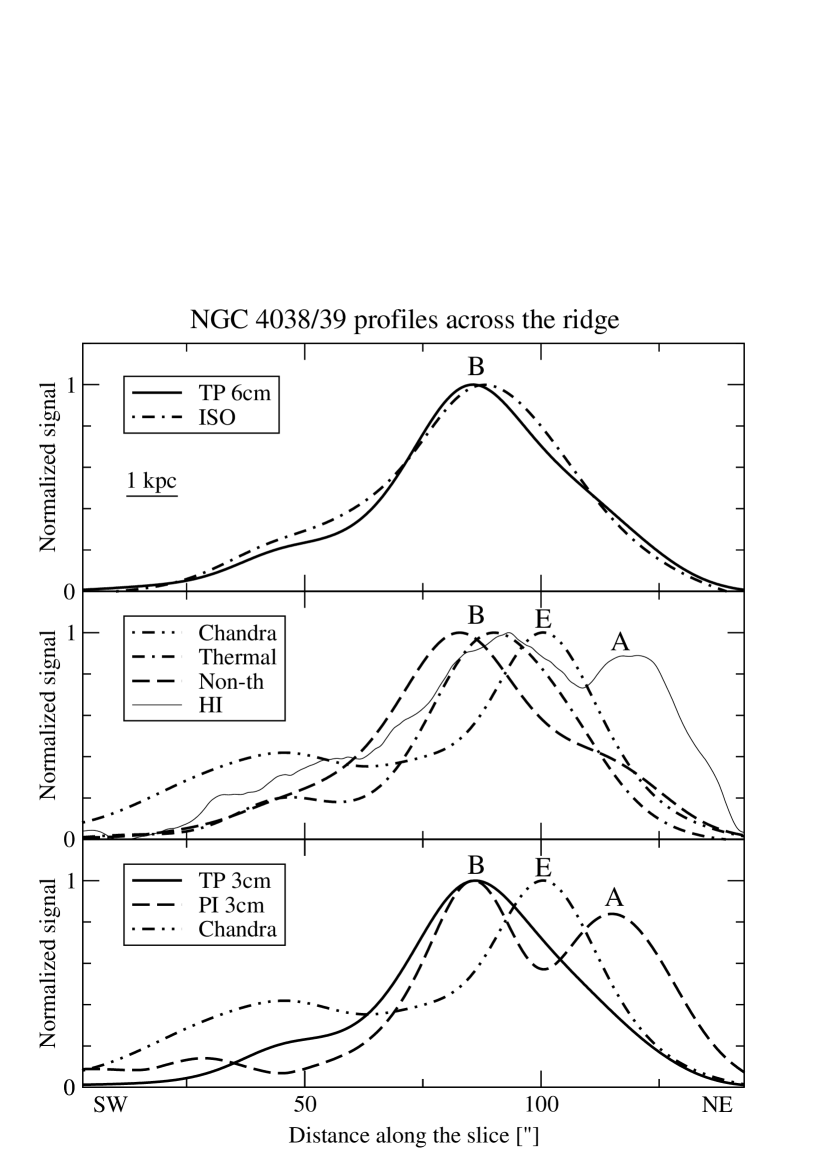
The profile of the total and polarized radio intensity compared to that of H i, X-ray and the radio thermal and nonthermal intensity across the northeastern ridge is presented in Fig. 14. Most of species peak at the distance from the slice origin (region B in Fig. 8). This corresponds to the northern part of the dark cloud complex extending between the galaxies, flanked on its NE side by a star-forming region. The separation of thermal and nonthermal intensity is visible in the middle panel of Fig. 14. The high resolution optical image (shown in Fig. 2) helped us to associate the thermal emission peak with the star-forming clump and the nonthermal one with a dusty cloud. This means that there is not much hidden star formation in the cloud itself. Instead there is a strong, partly regular magnetic field (note the peak of polarized intensity) into which the electrons produced in the star-forming region propagate, yielding enhanced nonthermal intensity. We note that the distribution of the m brightness (obtained by Mirabel et al. mirabel (1998) with ISO) agrees with the total (i.e. sum of thermal and nonthermal) intensity, its peak being located between the maxima of these two emission components. Both thermal and nonthermal intensity decrease towards the NE.
The X-ray emission peaks about in a pool of hot gas (region E). This “X-ray ridge” does not correspond to any increase in total radio intensity. According to Zhang et al. (zhang (2001)) this region is filled mostly with intermediate age (Myr) stellar clusters. It may be a relic of an old star formation burst where the cosmic ray electrons lost most of their energy, making no significant contribution to the nonthermal intensity. Synchrotron lifetime of electrons with GeV energy in a 23G field (Table 1) is yr which gives a lower limit for the age of the starburst.
Polarized intensity in region E shows a striking minimum at 8.44 GHz and at 4.86 GHz (see Fig. 4) together with strong wavelength-dependent depolarization (FD “valley” in Fig. 7). At 4.86 GHz the degree of polarization is reduced by a factor of 0.35 relative to 8.44 GHz. As Faraday rotation there is smaller than 50 rad (Fig. 5), depolarization due to differential Faraday rotation cannot be more than by a factor of 0.98. Thus, the wavelength-dependent depolarization is due to Faraday dispersion (Burn burn (1966), Sokoloff et al. sokoloff (1998)). A RM dispersion of of yields a depolarization of 0.30 at 4.86 GHz and 0.84 at 8.44 GHz giving the observed ratio of 0.35, but insufficient to explain the minimum in polarized intensity in region E at 8.44 GHz. In that case additional wavelength-independent beam depolarization by an increased degree of small-scale magnetic field tangling is required.
4.1.2 Magnetic fields and cosmic rays in the northeastern ridge
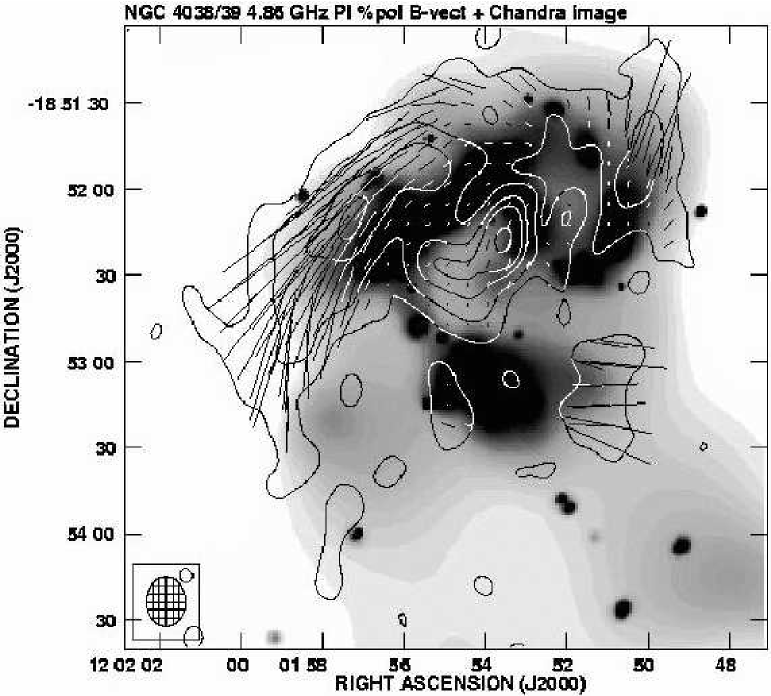
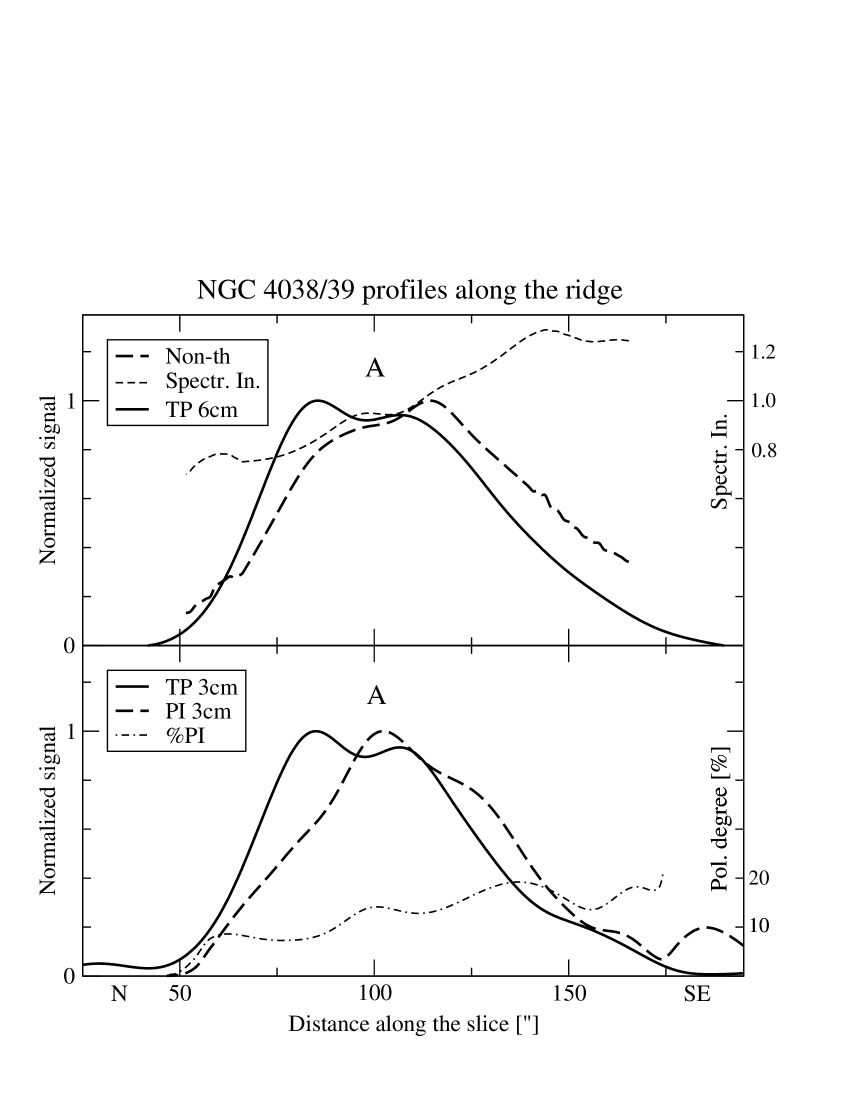
At (region A) a peak of polarized intensity is observed, coinciding with a H i maximum (Fig. 14, see also Fig. 13). It does not correspond to any rise of other constituents. According to recent numerical simulations kindly supplied to us by Dr Englmaier (priv. comm., see also Englmaier et al. englmaier (2001)) this region constitutes the beginning of the tidal (both stellar and gaseous) tail, unfolding towards the east and northeast. Because of little star formation this region does not correspond to any particular total intensity features, instead it is well revealed by the polarized intensity because of highly ordered magnetic fields. According to the suggestion by Fabbiano et al. (fabbiano03 (2003)) this region may be subject to external compression by the ambient gas pushing inwards the pool of hot gas. This may imply that our region A, with well aligned polarization vectors in front of the X-ray maximum, could be the result of magnetic field compression. Gas infall in this region has also been suggested by Hibbard et al. (hibbard (2000)). However, the high resolution map of polarized intensity (Fig. 13) does not show any narrow ridge, as expected in case of external compression. Moreover, the highly polarized region is significantly displaced southeastwards with respect to the X-ray ridge and also to the H i ridge (Fig. 13). It is more likely that the increased degree of magnetic field regularity is caused by field geometry and decaying turbulence and/or shearing gas motions (see below) than by gas infall pushing inwards the X-ray emitting matter.
Fig. 15 shows the distribution of various constituents along the discussed polarized ridge. There is still some weak star formation in its N part, as indicated by a total intensity peak at . The polarized intensity peaks more southwards at at 8.44 GHz (Fig. 15) and at 4.85 GHz. While both total and polarized intensity decrease towards the tidal tail, the polarized intensity fades somewhat farther away than the total intensity (Fig. 15, lower panel). This means that the magnetic field gets more ordered (the polarization degree is increasing) as the turbulent motions decay away from star-forming regions. A substantial part of a high polarization of this region may come from a “pseudo-regular field”, i.e. a highly anisotropic random one, stretched by shear accompanying the unfolding motion of the tidal tail. Such a field structure yields a high degree of polarization, not accompanied by strong Faraday rotation, because the stretching of random field alone cannot generate coherent uni-directional magnetic fields. We found indeed that Faraday rotation in the southern, weakly star-forming part of the polarized ridge is small ( rad m-2, see Fig. 6).
However, the Faraday rotation measures (in absolute values) increase above 100 rad m-2 along the ridge of polarized emission towards the north. These strongly non-zero Faraday rotation indicate that we deal with genuinely regular magnetic fields. Together with the increase in RM, the degree of polarization decreases. This anticorrelation suggests that we deal with the same large-scale coherent magnetic field and variations in the orientations of magnetic lines are responsible for the observed variations of RM and the field regularity. This explains the high Faraday rotation in the north. The small degree of polarization (low field regularity) in the north is in line with the high star formation rate, a relation also observed in other regions of NGC 4038/39 (see Sect. 4.1.3). We believe that the southern region also contains strong coherent fields but they run almost parallel to the sky giving little Faraday rotation.
A simple model reproducing simultaneously Faraday rotation measures, polarized intensities and thermal intensity at 8.44 GHz has been constructed. We assume that 20% of the observed thermal intensity (Fig. 10) is due to diffuse ionized gas responsible for Faraday rotation. Varying the pathlength of thermal emission between 100 and 400 pc, the nonthermal pathlength between 1 kpc and 2 kpc, and the ionized gas filling factor between 0.05 and 0.1 (see Ehle & Beck ehle (1993)) we found that all radio data in the SE part of the polarized ridge (marked by a black cross in Fig. 8) require a regular field of about G (see Table 1), inclined to the sky plane by some , only weakly depending on the assumptions listed above. This result suggests that most of the regular magnetic field lies in the sky plane.
In the northern part of the ridge (marked by a black circle in Fig. 8), showing higher RM, the same analysis implies that the regular field of about G is running away from the observer at the angle of to the sky plane. From this place towards the SE (in a region marked by a black triangle in Fig. 8) the regular magnetic field changes its direction. It remains inclined to the sky by some but points towards us. Our model indicates that we generally deal with a three-dimensionally curved structure of magnetic fields.
These results suggests that we need a higher degree of coherence in the southern part of the NE ridge as expected for decaying turbulent motions away from star-forming regions. While the above mechanism would be the main cause of coherent fields, the shearing motions may align the regular field along the tail.
Along the nonthermal ridge the radio spectrum (Fig. 15) gradually steepens (also the nonthermal one as discussed in Sect. 4.1), indicating an aging population of CR electrons as they propagate further away from their sources in star-forming regions. The proximity of a hidden strong star formation nest in the southern part of the “overlapping region” (D in Fig. 8) does not result in an increased CR electron content in the ridge, probably because of a strong regular magnetic field perpendicular to the required direction of CR propagation.
4.1.3 The dark cloud complex

Fig. 16 shows the brightness variations of various constituents along the dark cloud complex extending to SE from the nucleus of the northern galaxy (seen on e.g. the B/K colour index map in Fig. 4, left panel). Starting from the northwest there is a small peak in polarization (50″), corresponding to the interface between the rudimentary magnetic spiral in the NW disk (see Sect. 3.2) and the polarized ridge discussed in Sect. 4.1.1. The whole relic spiral associated with the “inverted 9” optical feature deserves attention, too. In this region the observed B-vectors have almost a constant inclination (–) with respect to the narrow blue optical ridge, thus the magnetic field cannot be simply aligned by compression as this structure unfolds. We suspect this feature to be the relic of the galaxy’s original magnetic field. However, Faraday rotation measure in the area of this rudimentary spiral undergoes strong variations and jumps, changing suddenly between rad m-2 and rad m-2. This indicates that the magnetic spiral has in fact a complex three-dimensional structure as does also the velocity field (Barnes barnes (1988)). Similar but weakly visible spiral with a large pitch angle is visible also around the southern nucleus.
Moving to the southeast, at (Fig. 16) there is a small peak in almost all species (except polarization and H i) corresponding to an enhanced star formation around the nucleus of the northern galaxy. The polarized intensity continues to rise towards the SE, reaching a strong peak (as does the H i) at (region B) while all other quantities, sensitive to the star-forming activity show a minimum close to this place. This region corresponds to the northern part of the dark cloud complex. Our observations imply thus that there is no hidden strong star formation there. In fact the sub-mm observations with SCUBA (Haas et al. haas (2000)) show that this region is radiating quite strongly at m being very weak at m, which indicates its low dust temperature.
More to the south at the radio thermal and nonthermal brightness, as well as the intensity at m (ISO) show a strong peak (Fig. 16), constituting a beam-smeared blend of regions C and D as defined in Fig. 8. The peaks of the radio and infrared emission are more than twice stronger compared to those at the position of the nucleus of northern galaxy. In contrast, the H and X-ray peaks are considerably weaker than at the northern nucleus. In case of H emission this means strong extinction in the optical domain, hiding a very strong burst of star formation. This agrees with results by Haas et al. (haas (2000)) who find there strong emission at m indicating considerably warmer dust. The peak of thermal radio intensity is particularly appealing. The radio thermal intensity can therefore serve as a good tracer of thermal gas ionized by recent star formation, but still hidden in the optical domain by heavy extinction in a dusty molecular environment.
Whitmore & Zhang (whitmore (1999)) argued that most radio emission from the radio-bright phase of young star clusters in the Antennae originate from H-emitting gas. Our results show that their conclusion is not valid for the extended radio emission. Indeed, the compact sources comprise only 11% of the total radio intensity studied here. The distinct behavior of H and total radio intensity is visible for example in Fig. 16 where their profiles along the “overlapping region” show different shapes.
To explain a weak X-ray emission in the southern part of the dark cloud complex we have two possibilities: either strong extinction by a H i concentration, or the star formation burst may be so young that did it not yet produce a large reservoir of diffuse hot gas but sufficiently old to produce radio-emitting CR electrons, hence its age is between yr and yr. The discrimination between these possibilities is impossible without analyzing the X-ray spectra, which is beyond the scope of this paper.
| Region | inclination | regularity | ||
|---|---|---|---|---|
| () | (G) | (G) | ||
| The whole merging system | 64 | 20 | 5 | 0.25 |
| 0 | 24 | 5 | 0.19 | |
| NGC 4038 (without overlapping region) | 55 | 21 | 5 | 0.25 |
| NGC 4039 (without overlapping region) | 73 | 15 | 3 | 0.19 |
| Overlapping region as a whole | 64 | 27 | 4 | 0.16 |
| 0 | 34 | 4 | 0.12 | |
| Central peak of NGC 4038 | 55 | 29 | 8 | 0.30 |
| Central peak of NGC 4039 | 73 | 21 | 1 | 0.05 |
| N part of the northeastern ridge, modelled in Sect. 4.1.2 | 59 | 19 | 9 | 0.52 |
| (RA Dec, a black circle in Fig. 8) | ||||
| Middle part of the northeastern ridge, modelled in Sect. 4.1.2 | 34 | 18 | 8 | 0.48 |
| (RA Dec, a black star in Fig. 8) | ||||
| SE part of the northeastern ridge, modelled in Sect. 4.1.2 | 4 | 16 | 10 | 0.88 |
| (RA Dec, a black cross in Fig. 8) | ||||
| Region A, middle of the northeastern ridge | 55 | 22 | 13 | 0.76 |
| 0 | 24 | 10 | 0.45 | |
| Region B, overlapping region, north | 55 | 27 | 12 | 0.50 |
| 0 | 30 | 8 | 0.29 | |
| Region C, overlapping region, south | 64 | 30 | 3 | 0.12 |
| 0 | 37 | 2 | 0.05 | |
| Region D, overlapping region, south | 64 | 32 | 7 | 0.23 |
| 0 | 39 | 4 | 0.10 | |
| Region E, X-ray ridge | 55 | 24 | 8 | 0.35 |
| 0 | 27 | 5 | 0.20 | |
| Region F, spiral arm in NGC 4038 | 55 | 23 | 9 | 0.43 |
| “Interarm” region in NGC 4038 | 55 | 22 | 5 | 0.21 |
| (RA Dec, a black triangle in Fig. 8) |
The degree of polarization and the polarized intensity is highest in the cool northern part of the “overlapping region” (close to B). They both decrease gradually towards the SE while the total (i.e. the sum of thermal and nonthermal) intensity continuously rises (Fig. 16). This implies that in the southern region of the dark cloud complex the regular magnetic field becomes more efficiently destroyed by hidden star formation. We also note that the B-vectors keep a coherent structure along the whole region (Fig. 4). We deal here with genuinely regular fields: the Faraday rotation measure keeps constantly high absolute values ( 100 rad m-2) in two large coherent domains: negative in the northern part, changing to positive in its southern region (Fig. 6). The analysis done in the same way and under the same assumptions as in Sect. 4.1.2 shows that equipartition regular magnetic field in the northern part (region B) is about G (as estimated from the polarized brightness at 8.44 GHz) and is inclined to the sky plane by some . This is implied by the Faraday rotation measure and thermal gas density derived from the thermal intensity. The sudden change of RM in the middle of the cloud complex also means a sign reversal of the line-of-sight regular field component. We tentatively speculate that this might be a meeting point of the global regular magnetic fields of the two galaxies.
As also noted by Haas et al. (haas (2000)) the southernmost tip of the dark complex (region C, distinguished in our high resolution total radio intensity map, Fig. 2) has a several times higher ratio of m-to-radio intensity than region D. This is also visible in Fig. 16 (upper panel) as a shift of the infrared peak with respect to the radio emission. It is possible that our region C contains a hidden, strongly star-forming nest residing in the environment of weaker total magnetic field or the star formation burst is so young ( yr) that not enough CR electrons have been produced so far.
4.2 Magnetic field strengths
For the detailed analysis of magnetic fields in NGC 4038/39 we performed calculations of total and regular equipartition magnetic field strengths and of the degree of field regularity (the ratio of regular to random field strengths) in different parts of the interacting system (Table 1). For all calculations we used maps of total and polarized radio intensity at 8.44 GHz. We adopted the face-on thickness of the synchrotron emission to be 1 kpc (the typical nonthermal disk thickness, e.g. Condon condon (1992)), a proton-to-electron energy ratio of 100 (Pacholczyk pacholczyk (1970)), and a lower cutoff energy for relativistic protons of 300 MeV. The effective pathlengths were derived from the assumed inclination angle. We adopted an inclination of for all regions associated with NGC 4038, for NGC 4039 (both from LEDA database) and the mean of these values () for the whole system and for regions between the galaxies.
To account for all uncertainties due to a complex three-dimensional geometry of the system we repeated the calculations for the whole system and the “overlapping region” with a mean inclination of . Also, for other regions where the value of inclination was uncertain, additional calculations were computed for the angle of . For the three regions discussed in Sect. 4.1.2 we performed calculations with inclinations determined from our models. All the results are presented in Table 1. The typical uncertainty in the calculated values is about 25–30, including an uncertainty of a factor of two in the nonthermal face-on disk thickness, the proton-to-electron energy ratio and in the lower proton energy cutoff.
For the whole system we averaged the radio intensities within the area delineated by the intensity level of 0.3 mJy/b.a. (roughly 1% of the peak intensity) and obtained a mean total magnetic field strength of G. This is a high value, almost as high as in the starburst galaxy M 82 (Klein et al. klein88 (1988)). The mean regular field is BG and yields a field regularity 0.25. Compared to other galaxies the mean field regularity is very low (see Sect. 4.3). A smaller face-on nonthermal disk thickness would even yield stronger magnetic fields. A thickness of 0.5 kpc, as used for NGC 4038/39 by Hummel & van der Hulst (hummel (1986)), and an inclination of yield a total field strength of G for the whole system.
The numbers in Table 1 show that the total magnetic fields in the individual galaxies without the “overlapping region” and in the “overlapping region” itself are about twice stronger than in normal spirals for which the mean value depending on the sample is 8–10G (see Beck et al. beck96 (1996)). This field amplification must be a result of interaction.
Locally, the strongest magnetic fields of G are observed outside the galaxy disks, in the southern part of the “overlapping region” (C and D in Fig. 8), a phenomenon which was never observed before in any galaxy system. This strong magnetic field is likely caused by the interaction. In quiescent regions in the northwestern part of NGC 4038 magnetic fields resembles that of a normal spiral arm. In region F, which is probably the least disturbed place of the relic spiral arm located away from strong star-forming regions, the magnetic field reaches a value of G (for 1 kpc disk thickness), comparable to that observed in the brightest parts of strong spiral arms in e.g. NGC 6946 and NGC 1566 (Beck et al. beck96 (1996)). The most quiet “interarm” region in NGC 4038 (the last region presented in Table 1) shows G, much higher than for typical interarm regions in normal galaxies. However, this place is not far away from the central region of NGC 4038 so that some enhancement of star formation is suspected.
4.3 The regularity and origin of magnetic fields in NGC 4038/39
Particular regions with different field strengths and structures can be associated with various phenomena in the gas dynamics in NGC 4038/39. Regular magnetic fields in NGC 4038/39 are similar to that observed in normal spirals and are of order of 5G. However, the field regularity is rather low (0.2–0.3 even in the “interarm” region). A typical regularity of was found for normal galaxies (Buczilowski & Beck buczilowski (1991), Beck et al. beck96 (1996)). Our resolution relative to the galaxy size is better than in all galaxies used in the quoted papers. In such case we should expect even higher degree of field regularity () because of lower beam depolarization. This means that in the interacting system either strong amplification of turbulent fields occurs (see below), or both turbulent and regular magnetic fields are generated, but the regular fields are much more tangled in the starburst regions than in normal spirals. Strong regular magnetic fields (G) are observed close to NGC 4038 center and in its relic spiral arm (region F) but still with a low field regularity of 0.3–0.4. In the northeastern ridge, far away from star-forming regions, the magnetic fields become more ordered and reach a strength of G (region A), probably as the result of gas shearing motion in the base of the tidal tail.
In the northeastern part of the system (region A) the response of magnetic fields to the local gas flows is well visible. The magnetic pitch angle change from large values () in the western and northern part of NGC 4038 to small ones in the eastern part, reflecting the alignment of regular magnetic field with the tidal tail, probably due to the gas stretching motions while a higher field regularity is suggestive for decaying gas turbulent motions. In the northern (region B) and middle part of the “overlapping region” magnetic fields are also aligned with the shape of this region possibly adjusting to the gas flows.
The enhancement of total magnetic field in the “overlapping region” (C and D) to high values of G with coherence scale of about 1 kpc (visible in e.g. Fig. 8) could be produced by the fluctuation dynamo (Subramanian subramanian (1998)) which may amplify magnetic fields liberated from the parent galaxies during the gravitational interaction. However, assuming a turbulent magnetic diffusivity of about (an intermediate value between a typical value in the disk and in the corona in galaxies) the estimated magnetic diffusion time is about yr, very close to the dynamic scale time of this region of about yr (e.g. Mihos et al. mihos (1993)). Thus, no amplification mechanism by any dynamo action is necessary to sustain the magnetic fields in this region if strong enough magnetic fields were already present in the disks.
Instead we may assume isotropic compressional enhancement of magnetic fields in region C and D according to the approximate scaling with confining gas density as , with G of the magnetic field strength before compression and the observed value of G after compression. Current gas density estimated from the total mass of gas approximated by the sum of molecular gas (from CO observations, Zhu et al. zhu (2003)) and neutral gas (from Hibbard et al. hibbard (2000)) yields a value of . Using the scaling relation we get a gas density of before compression. This value is similar to gas densities in normal galaxies, e.g. in M31 where gas densities span a range of 1–6 cm-3 (Berkhuijsen et al. berkhuijsen (1993)). Hence, compressional enhancement in the “overlapping region” of magnetic fields pulled out from the parent disks is highly probable. Nevertheless some kind of fluctuation dynamo cannot be excluded, but this needs elaborate MHD modelling.
4.4 Evolution of gas and magnetic field in NGC 4038/39
The coupling of magnetic field with different gas phases shows more variety in NGC4038/39 than in normal galaxies where density waves play an ordering role. The profiles of various species along three different directions (discussed in Sect. 4.1) revealed different connections of magnetic fields with cold, warm and hot gas depending on the particular location and dominance of various physical processes. The intensity ratios between infrared, X-ray and radio emissions yielded additionally a crude estimate of the evolutionary stages of the selected places.
From all the above considerations we propose the following tentative scenario of the gas and magnetic field evolution in NGC 4038/39:
-
1.
Before the present encounter the northern galaxy was gas rich with a strong spiral magnetic field.
-
2.
The current collision has pulled out the stellar tidal tails (in agreement with simulations by Englmaier, priv. comm., see also Englmaier et al. englmaier (2001)). The NW part of “inverted 9” structure is possibly a relic of an unfolded spiral arm and constitutes the base of an expanding gas-rich tail extending further to the south. The regular magnetic field remains aligned with the outer parts of this structure (region A). The magnetic field gets more ordered as the turbulence decays in the quiet, SE parts of this feature.
-
3.
Another spiral arm of the original northern galaxy has possibly collided with that of the southern galaxy, giving rise to the dark cloud complex with a regular field aligned along the collision front (regions B, C and D). The magnetic field may be already strong in the northern, cool part of the complex (region B) but there is not yet strong star formation able to produce CR electrons. Some 5–10 Myr ago a strong star formation burst occurred along the NE boundary of the cloud (region E), efficiently destroying the regular magnetic field and filling this region with a pool of diffuse, hot gas.
-
4.
A young star formation burst has occurred in the southern part of the cloud (region D), being still highly obscured in the optical domain, but visible in radio and infrared emission. It already managed to disrupt the regular magnetic field and to build up exceptionally strong total fields by compressional forces. At the southern edge of this clouds complex (region C), star formation is so young that radio intensity is still weak.
5 Summary and conclusions
We present the first study of radio polarized and total emission of a pair of spiral galaxies in the process of collision. The galaxies – NGC 4038/39 – were observed with the VLA in the C and D arrays at 8.44 GHz, 4.86 GHz and 1.49 GHz.
We show that the galaxies possess bright, substantially polarized radio disks with no dominant central sources. The thermal fraction is found to be about at 10.45 GHz, higher than in normal spirals. The derived magnetic fields in both galaxies are about two times stronger (G) than in normal spirals probably as the result of interaction-enhanced star-formation and stronger turbulent motions. A similarly strong mean magnetic field is also found along the interface between the two disks known as the place of merger-driven extensive starburst. In comparison with other galaxies magnetic fields in the Antennae have lower regular components relative to the total one which is likely due to more strongly tangled fields in the vivid star-forming regions.
Our radio data are compared with existing data in H i, H, X-rays and in the infrared to study the physical conditions in various places of the merger and local interrelations of magnetic fields with different ISM phases. We distinguish several regions in the interacting system (depicted as A–F in Fig. 8) with the following results:
-
A.
The eastern highly polarized ridge where the gas-rich southern tidal tail starts. This region has no counterpart in any of star formation-dependent quantities like total radio, thermal, nonthermal or infrared intensity. It coincides with the H i ridge which extends far out along the southern tidal tail. The radio spectrum is much steeper in this region and still steepens up to towards the tail, which indicates the CR electron population aging as they move away from their sources in star-forming regions. The magnetic field is highly regular (G) and stretched along the ridge, becoming even more ordered towards the tidal tail as turbulent motions decay, it also bends to become almost parallel to the sky plane.
-
B.
The cold northern part of a dark cloud complex, constituting the “overlapping region”. The radio total, thermal and nonthermal intensity is rather weak, indicating no hidden star formation. We note also that the whole region of the dark cloud complex shows a coherent magnetic field structure, probably tracing the line of collision between the arms of discussed merging spirals.
-
C.
The hidden star-forming clump at the southern tip of the dark cloud complex. The clump is very strong in the infrared but deficient in the total radio intensity relative to the infrared one. Either the star formation burst occurs in rather weak magnetic field around or it is so young ( yr) that not enough CR electrons were produced.
-
D.
The region of hidden star formation in the southern part of the dark cloud complex bright in total radio, thermal, nonthermal and infrared intensity. However, the H peak is rather weak due to heavy extinction. The region is weakly polarized and most of the magnetic field is random reaching large total values of G. This is probably the result of compression of the original fields pulled out with gas from parent galaxies. X-ray emission is relatively weak, possibly the starburst is still too young (i.e. yr) to fill this volume with hot gas.
-
E.
The X-ray ridge tracing an older ( yr) star formation burst leaving a pool of the hot gas and intermediate age star clusters. It has no counterpart in total radio intensity (the CR electron population faded away) and the regular magnetic field has been efficiently destroyed by star-forming activity.
-
F.
The relic of the magnetic spiral of the gas-rich northern galaxy. The Faraday rotation measure distribution shows that this region has a complex three-dimensional structure.
Locally, the strongest magnetic fields of G are present outside the galaxy disks, in the “overlapping region”, what was never observed before in any galaxy system. We also note the large values of the magnetic pitch angle in the relic spiral arm of NGC 4038 and the unusual “interarm” region with disrupted regular fields. Thus the magnetic fields in the Antennae are in structure and properties very distinct from what is observed in normal spirals.
The presented regions (A–F) reveal different physical conditions and evolutionary stages and magnetic fields associations with cold, warm and hot gas, depending on the particular place and dominance of various physical processes. This makes the Antennae a key target for studying galactic gas dynamics, the properties of various ISM phases, star-forming processes and their interrelations with the magnetic field.
We are, however, still far from fully understanding the dynamics of NGC 4038/39. Further works involving the numerical simulations including the magnetic field and high resolution observations of gas kinematics of the Antennae in cold, warm neutral, and in ionized gas are highly desirable. Especially interesting would be a model of gas and magnetic field evolution in the “overlapping region” far from the galaxy disks.
Acknowledgements.
The Authors wish to express their thanks to Dr E. Hummel for providing his original VLA data on NGC 4038/39. We are very indebted to Dr J. Hibbard (NRAO) for providing us his H i data and B/K image, Dr B.C. Whitmore (STScI) for the HST images, Dr G. Fabbiano for the Chandra image and Dr I.F. Mirabel (CEA) for the ISO data. We also thank to Drs P. Englmaier, M. Krause and Prof. M. Urbanik for very helpful discussions. KCh is grateful to Prof. R. Wielebinski for making possible his visits to Max-Planck-Institut für Radioastronomie in Bonn where part of this work has been done. We wish to express our particular thanks to the anonymous referee for his valuable remarks and his effort to improve our paper. We have made use of the LEDA database (http://leda.univ-lyon1.fr). This work was supported by a grant from the Polish Research Committee (KBN), grant no. PB249/P03/2001/21.References
- (1) Amram, P., Marcelin, M., Boulesteix, J., & le Coarer E. 1992, A&A, 266, 106
- (2) Baars, J.W.M., Genzel, R., Pauliny-Toth, I.I.K., & Witzel A. 1977, A&A, 61, 99
- (3) Barnes, J. E. 1988, AJ, 331, 699
- (4) Beck, R., Brandenburg A., Moss, D., Shukurov, A., & Sokoloff, D. 1996, ARA&A, 34, 155
- (5) Beck, R., Ehle, M., Shoutenkov, V., Shukurov, A., & Sokoloff, D. 1999, Nature, 397, 324
- (6) Berkhuijsen, E.M., Bajaja, E., & Beck, R. 1993, A&A, 279, 359
- (7) Brandenburg, A., & Urpin, V. 1998, A&A, 332, L41
- (8) Buczilowski, U.R., & Beck, R. 1991, A&A, 241, 47
- (9) Burn, B.J. 1966, MNRAS, 133, 67
- (10) Chyży, K.T., Soida, M., Urbanik, M., & Beck, R. 2000, The Origins of Galactic Magnetic Fields, 24th meeting of the IAU, Joint Discussion 14, August 2000, Manchester, England
- (11) Chyży, K.T., Soida, M., Urbanik, M., & Beck, R. 2002, AP&SS, 281, 409
- (12) Condon, J.J. 1983, ApJS, 53, 459
- (13) Condon, J.J. 1992, ARA&A, 30, 575
- (14) Ehle, M., & Beck, R. 1993, A&A, 273, 45
- (15) Englmaier, P., Rigopoulou, D., & Mengel, S. 2001, ASP Conf. Ser. 240: Gas and Galaxy Evolution, 214
- (16) Fabbiano, G., Zezas, A., & Murray, S.S. 2001, ApJ, 554, 1035
- (17) Fabbiano, G., Krauss, M., Zezas, A., Rots, A., & Neff S. 2003, ApJ, submitted, astro-ph/0308145
- (18) Griffith, M.R., Wright, A.E., Burke, B.F., & Ekers, R.D. 1994, ApJS, 90, 179
- (19) Haas, M., Klaas, U., Thommes, U., & Xu, C. 2000, A&A, 356, L83
- (20) Hanasz, M., Otmianowska-Mazur, K., & Lesch, H., 2002, A&A, 386, 347
- (21) Hibbard, J.E., van der Hulst, J.M., Barnes, J.E., & Rich, R.M. 2000, ApJ, 122, 2969
- (22) Hummel, E., & van der Hulst, J.M. 1986, A&A, 155, 151
- (23) Klein, U., Wielebinski, R., & Morsi, H.W. 1988, A&A, 190, 41
- (24) Liang, M.C., Geballe, T.R., Lo, K.Y., & Kim, D.-C. 2001, ApJ, 549, L59
- (25) Mihos, J.C., Bothum, G.D., & Richstone, D.O. 1993, ApJ, 418, 82
- (26) Mirabel, I.F., Vigroux, L., Charmandaris, V., Sauvage, M., Gallais, P. et al. 1998, A&A, 333, L1
- (27) Moss, D., Shukurov, A., & Sokoloff, D. 1999, A&A, 343, 120
- (28) Niklas, S., Klein, U., & Wielebinski, R. 1986, A&A, 322, 19
- (29) Pacholczyk, A.G. 1970, Radio Astrophysics, Freeman, San Francisco
- (30) Read, A.M., Ponman, T.J., & Wolstencroft, R.D. 1995, MNRAS, 277, 397
- (31) Simard-Normandin, M., & Kronberg, P.P. 1980, ApJ, 242, 74
- (32) Soida, M., Urbanik, M., Beck, R., Wielebinski, R., & Balkowski, C. 2001, A&A, 378, 40
- (33) Sokoloff, D.D., Bykov, A.A., Shukurov, A., Berkhuijsen, E.M., Beck, R., & Poezd, A.D. 1998, MNRAS, 299, 189, and MNRAS, 303, 207 (erratum)
- (34) Stanford, S.A., Sargent, A.J., Sanders, D.B., & Scoville, N.Z. 1990, ApJ, 349, 492
- (35) Subramanian, K. 1998, MNRAS, 294, 718
- (36) Toomre, A., & Toomre, J. 1972, ApJ, 178, 623
- (37) Whitmore, B.C., Zhang, Q., Leitherer, C., Fall S. M., Schweizer, F., & Miller, B.W. 1999, AJ, 118, 1551
- (38) Widrow, L. 2002, Rev. Mod. Phys., 74, 775
- (39) Wright, A., & Otrupcek, R. 1990, PKS Catalog, Australia telescope national facility
- (40) Zhang, Q., Fall, S.M., & Whitmore, B.C. 2001, ApJ, 561, 727
- (41) Zhu, M., Seaquist, E.R., Kuno, N. 2003, ApJ, 588, 243