Modulations in the radio light curve of the Type IIb Supernova 2001ig: Evidence for a Wolf-Rayet binary progenitor?
Abstract
We describe the radio evolution of SN 2001ig in NGC 7424, from 700 days of multi-frequency monitoring with the Australia Telescope Compact Array (ATCA) and the Very Large Array (VLA). We find that deviations of the radio light curves at each frequency from the standard “minishell” model are consistent with density modulations in the circumstellar medium (CSM), which seem to recur with a period near 150 days. One possibility is that these are due to enhanced mass-loss from thermal pulses in an AGB star progenitor. A more likely scenario however is that the progenitor was a Wolf-Rayet star, whose stellar wind collided with that from a massive hot companion on an eccentric 100 day orbit, leading to a regular build-up of CSM material on the required time and spatial scales. Recent observations of “dusty pinwheels” in Wolf-Rayet binary systems lend credibility to this model. Since such binary systems are also thought to provide the necessary conditions for envelope-stripping which would cause the Wolf-Rayet star to appear as a Type Ib/c supernova event rather than a Type II, these radio observations of SN 2001ig may provide the key to linking Type Ib/c SNe to Type IIb events, and even to some types of Gamma-Ray Bursts.
keywords:
circumstellar matter – supernovae: individual: SN 2001ig – binaries – stars: Wolf-Rayet – galaxies: individual: NGC 7424 – gamma rays: bursts.1 Introduction
Radio studies of supernovae (SNe) can provide valuable information about the density structure of the circumstellar medium, the late stages of stellar mass-loss, and independent distance estimates for the host galaxies (Weiler et al., 2002). Furthermore, with the growing realisation that some Gamma-Ray Bursts may be intimately linked with SNe [e.g., GRB980425 and SN 1998bw (Kulkarni et al., 1998); GRB011121 and SN 2001ke (Garnavich et al., 2003); GRB030329 and SN 2003dh (Stanek et al., 2003)], such studies are crucial to understanding GRB environments. To date, radio emission has only ever been detected from core-collapse SNe of Type II and Type Ib/c [for a recent review of supernova taxonomy, see Turatto (2003)], and not at all from thermonuclear Type Ia SNe.
Supernova 2001ig was discovered visually by Evans (2001) on 2001 Dec 10.43 UT in the outskirts of the nearby late-type spiral galaxy NGC 7424 ( Mpc; Tully (1988)). No supernovae have been recorded previously in this galaxy. Initial optical spectroscopy of SN 2001ig from Las Campanas Observatory (Matheson & Jha, 2001) revealed similarities to the Type IIb SN 1987K (Filippenko, 1988), while spectra from the European Southern Observatory over the following month (Clocchiatti & Prieto, 2001; Clocchiatti, 2002) showed a similar behaviour to that of the Type IIb SN 1993J, by transitioning from Type II to Type Ib/c as the H recombination lines weakened. By October 2002, the transition to a Type Ib/c in the nebular phase was well and truly complete (Filippenko & Chornock, 2002). SN 2001ig was also detected by the ACIS-S instrument on board the Chandra X-ray Observatory on 2002 May 22 UT with a 0.2-10.0 keV luminosity erg s-1 (Schlegel & Ryder, 2002). A second observation three weeks later showed that the X-ray luminosity had halved in that time (Schlegel, 2003).
Radio monitoring of SN 2001ig with the Australia Telescope Compact Array111The Australia Telescope is funded by the Commonwealth of Australia for operation as a National Facility managed by CSIRO. (ATCA) commenced within a week of its discovery, and has continued on a regular basis. In Section 2, we present multi-frequency radio flux data from the first 700 days. We describe our attempts to fit the radio ‘light curves’ with a circumstellar interaction model in Section 4, and discuss the deviations from this model in more detail in Section 5. Our conclusions are presented in Section 6.
2 Radio monitoring
Table 1 contains the complete log of radio flux measurements from the ATCA. Column 2 lists the days elapsed since explosion, which is derived from the model fitting in Section 4. Total time on-source ranged from as little as 2 hours, up to a full 12 hour synthesis, but was typically 4–6 hours. Since the ATCA is capable of observing in 2 frequency bands simultaneously, determining fluxes in 4 frequency bands on the same day required time-sharing. Dual-frequency observations centered on 18.75 and 18.88 GHz and bandwidths of 128 MHz were carried out using a prototype receiver system on just three ATCA antennas. The central frequencies of the other bands are 8.640, 4.790, 2.496, and 1.376 GHz, and the bandwidth is 128 MHz. From 2002 July 11 onwards, the S-band central frequency was changed from 2.496 to 2.368 GHz, to reduce the amount of in-band interference. The ATCA primary flux calibrator, PKS B1934-638 has been observed once per run, while observations of the nearby source PKS B2310-417 allow us to monitor and correct for variations in gain and phase during each run.
| Date | Days since | (18.8 GHz) | (8.6 GHz) | (4.8 GHz) | (2.4 GHz) | (1.4 GHz) |
| (UT) | 2001 Dec 3 UT | (mJy) | (mJy) | (mJy) | (mJy) | (mJy) |
| 15/12/01 | 12 | – | – | |||
| 18/12/01 | 15 | – | – | – | ||
| 22/12/01 | 19 | – | – | – | ||
| 26/12/01 | 23 | – | – | – | ||
| 31/12/01 | 28 | – | ||||
| 07/01/02 | 35 | – | – | – | – | |
| 10/01/02 | 38 | – | – | |||
| 15/01/02 | 43 | – | – | |||
| 20/01/02 | 48 | – | – | – | – | |
| 02/02/02 | 61 | – | – | – | ||
| 17/02/02 | 76 | – | – | – | ||
| 26/02/02 | 85 | – | – | – | ||
| 17/03/02 | 104 | – | – | – | ||
| 19/03/02 | 106 | – | – | – | ||
| 28/03/02 | 115 | – | ||||
| 09/04/02 | 127 | – | – | – | ||
| 22/04/02 | 140 | – | – | – | ||
| 12/05/02 | 160 | – | ||||
| 27/05/02 | 175 | – | ||||
| 09/06/02 | 188 | – | ||||
| 30/06/02 | 209 | – | ||||
| 11/07/02 | 220 | – | ||||
| 28/07/02 | 237 | – | ||||
| 11/08/02 | 251 | – | ||||
| 23/08/02 | 263 | – | ||||
| 31/08/02 | 271 | – | ||||
| 17/09/02 | 288 | – | 222Chandra & Ray (2002) reported a flux at 1.4 GHz of mJy for SN 2001ig on 2002 Sep 25.8 UT with the Giant Meterwave Radio Telescope (GMRT). The source of this discrepancy has since been traced to an elevation-dependent gain error in the GMRT data (Chandra & Ray, 2003). | |||
| 12/10/02 | 313 | – | ||||
| 22/11/02 | 354 | – | ||||
| 17/12/02 | 379 | – | ||||
| 05/02/03 | 429 | – | ||||
| 16/03/03 | 468 | – | ||||
| 20/05/03 | 533 | – | ||||
| 03/08/03 | 608 | – | ||||
| 07/11/03 | 704 | – |
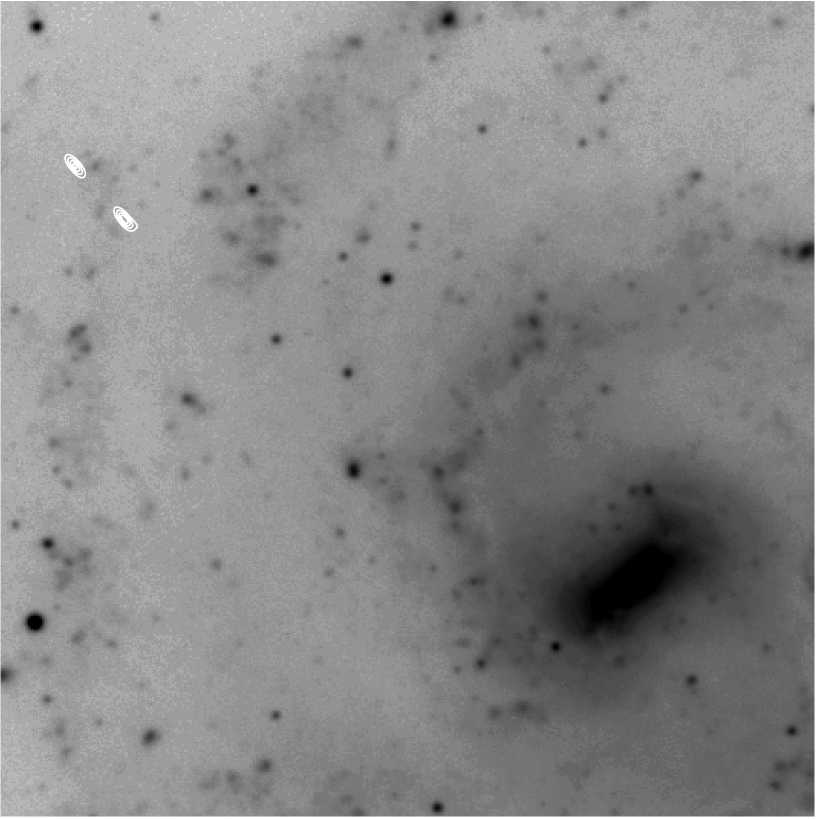
The data for each observation and frequency have been edited and calibrated using the miriad software package. Rather than image the visibility datasets, then clean them to some arbitrary level, the UVFIT task is used instead in the visibility domain to fit simultaneously a point source at the known location of SN 2001ig, as well as a background source fortuitously located just 18.5 arcsec to the southwest (Figure 1). This source, located at , (J2000) does not appear in any radio source catalogue, but was found to have the following fluxes as at 2001 Dec 15 UT: mJy, mJy, mJy, and mJy. After scaling the background source to these values at each epoch, the SN 2001ig fluxes have been scaled accordingly. The uncertainties in Table 1 include both the formal fitting errors, and the possibility that this background source is intrinsically variable (as is quite likely at the higher frequencies). This technique of fitting the SN flux density in the visibility domain, then bootstrapping to the flux of the adjacent source, was crucial to recovering valid flux measurements from observations with poor phase stability and/or limited hour-angle coverage.
The ATCA observations have been supplemented by a few early observations with the Very Large Array (VLA)333The VLA telescope of the National Radio Astronomy Observatory is operated by Associated Universities, Inc. under a cooperative agreement with the National Science Foundation. The observing and data analysis procedure follows that described in Weiler et al. (1986), and the results are listed separately in Table 2. Owing to the low elevation of SN 2001ig as observed from the VLA, and the compact configuration of the VLA at the time, both the sensitivity and the resolution are relatively poor. Nevertheless, these data prove to be important in constraining the early evolution of SN 2001ig, particularly at the very highest frequencies.
| Date | Days since | (22.5 GHz) | (15.0 GHz) | (8.5 GHz) | (4.9 GHz) | (1.4 GHz) |
|---|---|---|---|---|---|---|
| (UT) | 2001 Dec 3 UT | (mJy) | (mJy) | (mJy) | (mJy) | (mJy) |
| 28/12/01 | 25 | – | – | – | ||
| 07/01/02 | 35 | – | – | – | ||
| 10/01/02 | 38 | – | – | – | ||
| 13/01/02 | 41 | – | – | |||
| 17/01/02 | 45 | – | – | – | – | |
| 27/01/02 | 55 | – | – | – | ||
| 21/03/02 | 108 | – | – |
3 Radio light curves
The ATCA and VLA radio data is plotted in Figure 2. The data at 15.0 GHz are not shown here, to reduce confusion with the other high-frequency points, but is incorporated in the model fitting of Section 4. The time evolution of the spectral index (where flux ) between simultaneous positive detections at 1.4 and 4.8/4.9 GHz, and between 4.8/4.9 and 8.6 GHz, is plotted in Figure 3.


The radio “light curve” of a Type II supernova can be broadly divided into three phases: first, there is a rapid turn-on with a steep spectral index (, so the SN is brightest at the higher frequencies), due to a decrease in the line-of-sight absorption. After some weeks or months have elapsed, the flux reaches a peak, turning over first at the highest frequencies. Eventually, the SN begins to fade steadily, and at the same rate at all frequencies, in the optically-thin phase.
Although broadly consistent with this picture, the radio light curve of SN 2001ig displays significant departures from a smooth turnover and decline, which are most pronounced at 8.64 and 4.79 GHz. At around day 80, the flux at these frequencies reversed its initial decline, and by day 130 had almost doubled. The flux remained almost constant for a period of days, before resuming its decline at close to the original rate. Near day 250, the decline was again temporarily interrupted for another 50 days. There are indications of perhaps one more bump after day 450, but by this stage the SN has faded to the milli-Jansky level where any variations are comparable to the measurement uncertainties. The deviations are less pronounced, but still evident at 2.50 and 1.38 GHz.
4 Model fits
The general properties of supernova radio light curves as outlined above are quite well represented by a modified version of the “minishell” model of Chevalier (1982), and have been successfully parameterised for more than a dozen RSNe (see Table 2 of Weiler et al. (2002)). Radio synchrotron emission is produced when the SN shock wave ploughs into an unusually dense circumstellar medium (CSM). Following the notation of Weiler et al. (2002) and Sramek & Weiler (2003), we model the multi-frequency evolution as:
| (1) |
with
| (2) |
where
| (3) |
| (4) |
and
| (5) |
with the various terms representing the flux density (), the attenuation by a homogeneous absorbing medium (, ), and by a clumpy/filamentary medium (), at a frequency of 5 GHz one day after the explosion date . The and absorption arises in the circumstellar medium external to the blast wave, while is a time-independent absorption produced by e.g., a foreground H ii region or more distant parts of the CSM unaffected by the shock wave. The spectral index is ; gives the rate of decline in the optically-thin phase; and and describe the time dependence of the optical depths in the local homogeneous, and clumpy/filamentary CSM, respectively (see Weiler et al. (2002) and Sramek & Weiler (2003) for a detailed account of how these parameters are related). For lack of sufficient high-frequency data prior to the turnover to constrain it, we adopt .
In order to assess the gross properties of SN 2001ig in comparison with other Type IIb RSNe, we have fit this standard model to the data in Tables 1 and 2, but excluding days 48–70, and days 110–190. Thus, the model fit is constrained primarily by the rise at early times, the region of the high-frequency turnover, and by the late-time decay. The actual date of explosion is found to be 2001 Dec 3 UT, one week prior to discovery. The full set of model parameters which yields the minimum reduced is given in Table 3, and the model curves are plotted in Fig. 2. For comparison, we show in Table 3 the equivalent parameters for two other well-sampled Type IIb RSNe: SN 1993J (Van Dyk et al., 2004) in M81, and SN 2001gd (Stockdale et al., 2003) in NGC 5033. Note that we have fixed the value of to be , as in the Chevalier (1982) model for expansion into a CSM with density decreasing as .
| Parameter | SN 2001ig | SN 1993J | SN 2001gd |
|---|---|---|---|
| – | |||
| 0.0 | – | ||
| Time to (days) | 74 | 167 | 173 |
| (erg s-1 Hz-1) | |||
| Mass-loss rate ( yr-1) |
The spectral index of SN 2001ig is virtually identical to SN 1993J, but less steep than SN 2001gd. However, the rate of decline is much steeper in SN 2001ig than in either of the other Type IIb’s, and the time to reach peak 5 GHz flux is also much shorter. In this respect, SN 2001ig has behaved more like a Type Ib/c SN than most “normal” Type II SNe. The interpolated peak 5 GHz luminosity would be about twice that attained by SN 1993J, though in practice SN 2001ig was near a local minimum in the flux at that time, and the actual peak was not reached for another 40 days.
Using the methodology outlined in Weiler et al. (2002) and Sramek & Weiler (2003), we can derive an estimate of the progenitor’s mass-loss rate, based on its radio absorption properties. Substituting our model fit results above into their equation 11, and assuming both and contribute to the absorption444Case 2 in the notation of Weiler et al. (2002). Note that there is a misprint in that section, namely that in the limit of , then in equation 13, and not . We prefer the term “homogeneous” here over “uniform”, since the latter could give the misleading impression of no density gradient at all, whereas an dependence of density is implicit., we find that
where is the mass-loss wind velocity, and the ejecta velocity as measured from the earliest optical spectra (Clocchiatti & Prieto, 2001; Clocchiatti, 2002) is in the range 15,000 – 20,000 km s-1. Clearly, this is only an average value, subject to major variations discussed in the next section, but is in the same domain as the mass-loss rates derived similarly for SN 1993J and SN 2001gd (Table 3). Though generally less well-constrained, mass-loss rates may also be estimated directly from the radio emission properties, relying only on the peak 5 GHz luminosity, and the time taken to reach that peak. Equations 17 and 18 of Weiler et al. (2002) give and for the average Type Ib/c SN and Type II SN, respectively. Thus, the mass-loss rate calculations are in good agreement, with SN 2001ig intermediate between the expected rates for Type Ib/c and Type II SNe, consistent with its Type IIb classification.
5 Discussion
In Figure 4 we have plotted the deviations of the observed flux density, from the best-fit model curves as shown in Figure 2. The solid line in this figure is a 4-point boxcar average of the mean deviation over all frequencies at each epoch, which serves to emphasise the quasi-damped harmonic nature of the deviations, having a period near 150 days, and peak intensity declining with time (i.e., with increasing distance from the star). The r.m.s. deviation of the actual data from the smoothed interpolation is less than 1/3 of the amplitude of the observed modulation. Since the fractional amplitude of these deviations is virtually identical at each frequency, the evolution of the spectral index (Fig 3) in the optically-thin phase appears relatively unaffected. We take this as evidence that the bumps and dips in the radio light curve primarily reflect abrupt modulations in the CSM density structure, rather than optical depth effects (though optical depth is tied to CSM density to some degree). We now consider ways in which such a structured CSM may have been laid down late in the life of the progenitor of SN 2001ig.
Before doing so, we need to examine the effects of a change in CSM density on the velocity of the expansion, as well as on the radio emission. The blastwave radius increases with time as , where for no deceleration. Since in the Chevalier (1982) model, then for SN 2001ig, implying significant deceleration in the surrounding CSM. The radio luminosity is related to the average CSM density () via
| (6) |
(Chevalier, 1982) so that for SN 2001ig, . Consequently, a doubling in the CSM density will cause the radio emission to rise by a factor of three.

5.1 Episodic mass-loss from a single progenitor
The observed transition in SN 2001ig from a Type II optical spectrum with H lines, to a Type Ib/c spectrum without, argues for the ejection of a significant fraction of the red-giant envelope. Fig. 4 indicates strong excesses of observed flux at days, and days (with a net flux excess still at 500–600 days), hinting at a possible periodicity of 150 days in CSM density enhancements. If these density enhancements (by factors of 30% and 15% respectively) correspond to discrete shells of material expelled by the red supergiant, then the spacing between these shells is given by . Given an initial ejecta expansion velocity of 15,000 – 20,000 km s-1 (Clocchiatti & Prieto, 2001; Clocchiatti, 2002), an elapsed time of 150 days, and deceleration given above, then pc. Assuming the shells have been expanding at the wind velocity km s-1, then the period between successive mass-loss episodes is years.
This is significantly longer than the timescales normally associated with stellar pulsations ( few hundred days) in asymptotic giant branch (AGB) stars, but is comparable with the expected yr intervals between thermal pulses (C/He shell flashes) in M⊙ AGB stars (Iben & Renzini, 1983). Computations by Paczyński (1975) predict an interflash period of 40 yrs when the (hydrogen-exhausted) core mass is nearly 1.3 M⊙. This is close to the maximum core mass possible (depending on composition; Becker & Iben (1980)) in stars which will finish up as a white dwarf, rather than undergo a supernova explosion. Put another way, SN 2001ig may span the gap between the most extreme mass-losing AGB stars, and the least-massive supernova progenitors. Such a massive AGB star would also be expected to undergo multiple convective “dredge-up” phases leading to modified surface abundances, with N enhanced primarily at the expense of C (Becker & Iben, 1979). Such changes may be apparent in the optical spectra (Mattila et al., 2004).
There are already several good examples within our own Galaxy for this type of quasi-periodic mass-loss from AGB and post-AGB/proto-planetary nebula objects. The nearby carbon star IRC shows multiple nested shells spaced arcsec apart, corresponding to ejection timescales of years (Mauron & Huggins, 2000). The “Egg Nebula” (CRL2688; Sahai et al. 1998) and IRAS 1710–3224 (Kwok, Su & Hrivnak, 1998) are two bipolar proto-planetary nebulae which display concentric arcs with spacings on similar timescales.
5.2 Binary model
Among the other RSNe studied to date, only SN 1979C shows anywhere near as much systematic variation in its optically-thin decline phase as SN 2001ig. Indeed, for the first decade or so, the late-time radio light curve of SN 1979C could be quite well represented by a sinusoidal modulation of the flux, with a period of 1575 days (Weiler et al., 1992). More recently however, these regular variations in SN 1979C have ceased, and the light curve has flattened out (Montes et al., 2000). The implied modulation period of the mass-loss rate is years, a factor of 100 longer than that computed above for SN 2001ig. On the basis of evidence that the progenitor of SN 1979C had an initial mass of at least 16 M⊙, Weiler et al. (1992) argued against the thermal pulse scenario described in Section 5.1, as the interflash period for such a massive star and its resulting core would be years. Instead, they proposed modulation of the progenitor wind due to eccentric orbital motion about a massive binary companion as the cause of the periodicity in the radio light curve of SN 1979C.
The particular binary scenario they presented had the red supergiant progenitor and a 10 M⊙ B1 dwarf orbiting their common barycentre, with a 4000 year period. For a purely circular orbit, the progenitor’s orbital motion is a sizable fraction of the wind velocity, resulting in a spiral (or pinwheel-like) density structure being imprinted on the (otherwise uniform) mass-loss CSM in the orbital plane. This by itself would not lead to any periodic variation in the CSM density swept up by the SN shock wave. If instead the orbit was eccentric ( say), the acceleration of the progenitor near periastron every 4000 years would cause an additional pile-up of wind material which may then account for the observed periodicity in the radio emission. Schwarz & Pringle (1996) performed full hydrodynamical simulations of this, taking into account shocks generated in the wind, the gravitational influence of the companion on the wind, and light-travel time effects. Their simulations produced pronounced, but asymmetric spiral shock patterns, particularly when a polytropic equation of state is assumed. They also demonstrated that the amplitude of the modulations in the radio light curve tend to decrease as our view of the orbital plane goes from edge-on, to face-on. This may partly explain why such periodic variations as seen in SN 1979C and in SN 2001ig are comparatively rare, since not only must the mass-loss rate be modulated by the right kind of binary orbit parameters, but we must also then be fortunate enough to view it from close to edge-on.
Similar hydrodynamical simulations, but in three dimensions, of detached binary systems comprising a 1.5 M⊙ AGB star and a secondary of M⊙ were presented by Mastrodemos & Morris (1999), specifically targeted at reproducing the observed structures in IRC, CRL2688, etc., mentioned in Section 5.1. Interestingly, for sufficiently large binary separations (10 AU) and wind velocities ( km s-1), the spiral shock structure extends to high latitudes, and the resulting “spiral onion shell” structure seen in cross-section could resemble the shells seen in PPNe, and implied in SN 2001ig. In an alternative binary scenario, Harpaz, Rappaport & Soker (1997) postulate that it is the close passage of the secondary star effectively “choking off” uniform mass-loss from an AGB star having an extended atmosphere, rather than any enhancements in the mass-loss rate itself, which gives rise to these shells.
Perhaps the best direct evidence for the existence of binary-generated spiral shocks comes from high-resolution observations of dusty Wolf-Rayet (W-R) stars. Tuthill, Monnier & Danchi (1999) and Monnier, Tuthill & Danchi (1999) used the technique of aperture-masking interferometry on the Keck I telescope to image structure at better than 50 mas resolution in the -band around WR 104 and WR 98a. In both cases, they found pinwheel-shaped nebulae wrapping almost entirely around the central source out to distances of 150–300 AU. Their model has an OB-type companion orbiting the W-R star, with dust formation taking place in the wake of the interface region between their colliding stellar winds. The combination of orbital motion and wind-driven radial motion results in a “lawn sprinkler” effect, and the resultant dusty spirals. Hydrodynamic models in 3D of these colliding wind binary systems by Walder & Folini (2003) show the effects of varying the orbital eccentricity.
Remarkably, the characteristic radial scale for density enhancements implied by SN 2001ig’s radio light curve ( pc; Sect. 5.1) is an almost perfect match to the typical scale of one full rotation of these pinwheel nebulae: 50–100 milliarcsec at pc. Thus, SN 2001ig may represent the obliteration of just such a pinwheel nebula. Further support for this scenario comes from the flux excess (at least 60%, though this is a lower limit due to optical depth effects) in the first 50 days over that expected from a simple CSM density profile, as shown in Fig. 4. Coupled with the deceleration mentioned previously, this would tend to favour a centrally-condensed additional CSM component such as a pinwheel nebula, rather than concentric mass-loss shells.
5.3 SN 2001ig and the link between Type II and Type Ib/c SNe
It is interesting to note that the apparent requirements to produce such a pinwheel nebula, i.e., a close binary system composed of two massive stars in which the primary is a W-R star, are similar to those invoked by stellar evolution theory to explain the origin of Type Ib/c SNe. The peculiar spectral evolution and optical light curve behaviour of SN 1993J and SN 1987K (Sect. 1) has been attributed to the explosion of a hydrogen-poor, helium-rich progenitor (Swartz et al., 1993). A large fraction of the progenitor’s original hydrogen envelope must have been shed prior to core collapse, either through a strong stellar wind from a single massive (25–30 M⊙) star (Höflich, Langer & Duschinger, 1993); or more likely, via mass transfer from an intermediate-mass (10–15 M⊙) star in a binary system (Nomoto et al., 1993; Podsiadlowski et al., 1993; Utrobin, 1994; Van Dyk et al., 1996). Models for the evolution of massive stars in close binaries (e.g., Podsiadlowski, Joss & Hsu 1992; Woosley, Langer & Weaver 1995) produce helium stars. The suggestion is that stars which have lost some or all of their hydrogen would be the WN class of W-R stars, and explode as Type Ib SNe; while those which lose their helium layer as well would be the WC or WO classes of W-R stars, and explode as Type Ic SNe (Harkness et al. 1987, Filippenko, Matheson & Ho 1993).
At least 40% of solar neighbourhood W-R stars are in binary systems with hot companions (Moffat et al., 1986; van der Hucht et al., 1988), and the fraction may be even higher in low-metallicity environments (Dalton & Sarazin, 1995), such as the outskirts of NGC 7424. The extent of mass transfer, and thus the end-products of the binary system, depends on the evolutionary stage of the primary at the time mass transfer commences. As shown by Podsiadlowski et al. (1992) and Pols & Nomoto (1997), Case C mass transfer (which takes place after the core helium-burning phase) in systems with large eccentricity and orbital periods of a few years can be episodic, occurring mainly near periastron, just as outlined in Sect. 5.2. We propose that SN 2001ig may well have undergone just such a phase, without actually sharing a common envelope with a companion. The implied orbital period is given by one complete winding of the pinwheel nebula, which is simply the ratio of pc divided by the terminal wind velocity of a WN star ( km s-1; Abbott & Conti 1987), or days, consistent with this scenario.
In this context, the highly-modulated radio light curves for SN 2001ig may represent some of the best evidence yet for a link between SNe of Type IIb and Type Ib/c, in that SN 2001ig evolved optically like a Type IIb, but has the radio characteristics that should be expected for a Type Ib/c SN originating in a W-R + OB binary system viewed nearly edge-on. A testable prediction from this scenario is that the companion star (which by virtue of mass accretion may be even brighter than the W-R progenitor of SN 2001ig) should eventually become visible against the fading optical remnant, as has been postulated but not yet observed for SN 1993J (Podsiadlowski et al., 1993; Filippenko et al., 1993).
Besides its apparent association with the gamma-ray burst GRB 980425, SN 1998bw is also notable for showing bumps and dips in its radio light curves not dissimilar to those seen in SN 2001ig (Weiler, Panagia & Montes, 2001). These deviations, while exhibiting no clear periodicity in the first 1000 days, were less conspicuous at low frequencies, just as in SN 2001ig. This kind of behaviour is likely due to the CSM still being optically thick to low frequencies at relatively late times, and therefore only emission originating in the near-side of the CSM can be seen; whereas at high frequencies, emission from the entire CSM is visible. SN 1998bw had the spectral characteristics primarily of a Type Ic event, with a probable W-R progenitor (Iwamoto et al., 1998). Unfortunately, barely a half-dozen Type Ib/c SNe have been detected or studied in the radio, so it is too early to tell whether such modulated radio light curves may be the clue to a common massive-binary origin for Type IIb and Type Ib/c SNe, and possibly some GRBs.
6 Conclusions
By compiling one of the most complete multi-frequency radio datasets ever collected for any supernova, we have been fortunate to witness regular modulations in the radio light curves of the Type IIb Supernova 2001ig. The time taken to reach peak luminosity at 5 GHz, the rate of decline since then, and the derived mass-loss rates prior to explosion are all intermediate between those of Type Ib/c and “normal” Type II SNe. We find the light curve modulations to recur on a timescale of days, and have shown them to be true density modulations in the CSM, and not optical depth effects. Allowing for the deceleration of the ejecta, these density enhancements are spaced 0.6 milli-parsecs (or 130 AU) apart.
While we cannot totally exclude the possibility that these density enhancements represent mass-loss shells from the thermal-pulsing phase of a single AGB star progenitor, we find the weight of evidence supports a stellar wind, modulated by motion in an eccentric binary system, as their source. As had been suggested previously for SN 1979C, the combination of a massive binary companion causing a pile-up of mass-loss during periastron, and a favourable viewing angle, can result in just the kind of periodic density variations observed in SN 2001ig. Recent near-IR interferometric observations of the anticipated “pinwheel” dust nebulae in systems comprising a Wolf-Rayet star and a hot massive companion lend weight to this scenario, especially as the observed size scales match those required for SN 2001ig. Finally, as optical spectroscopy has recently been leading to the conclusion that Type Ib/c SNe are the product of a core-collapse event in the W-R component of such systems (and Type IIb SNe being those caught early enough to reveal the last traces of their lost hydrogen envelope), we believe these radio observations of SN 2001ig provide the “missing link” between the pinwheel nebulae observed in Galactic W-R binary systems, and their eventual fate in Type IIb or Type Ib/c supernovae.
Acknowledgments
We are grateful to the staff of the Paul Wild Observatory, including numerous volunteer Duty Astronomers, for assisting us in carrying out the majority of these observations remotely from ATNF Epping. This research has made use of NASA’s Astrophysics Data System Bibliographic Services (ADS), as well as the NASA/IPAC Extragalactic Database (NED) which is operated by the Jet Propulsion Laboratory, California Institute of Technology, under contract with the National Aeronautics and Space Administration. We acknowledge fruitful discussions with Tim Gledhill and Roger Chevalier. KWW wishes to thank the Office of Naval Research (ONR) for the 6.1 funding supporting his research.
References
- Abbott & Conti (1987) Abbott D.C., Conti P.S., 1987, ARA&A, 25, 113
- Becker & Iben (1979) Becker S.A., Iben I., 1979, ApJ, 232, 831
- Becker & Iben (1980) Becker S.A., Iben I., 1980, ApJ, 237, 111
- Chandra & Ray (2002) Chandra, P., Ray A., 2002, IAU Circ. 7994
- Chandra & Ray (2003) Chandra, P., Ray A., 2003, private communication
- Chevalier (1982) Chevalier R., 1982, ApJ, 259, 302
- Clocchiatti (2002) Clocchiatti, A., 2002, IAU Circ. 7793
- Clocchiatti & Prieto (2001) Clocchiatti, A., Prieto J.L., 2001, IAU Circ. 7781
- Dalton & Sarazin (1995) Dalton W. W., Sarazin C.L., 1995, ApJ, 448, 369
- Evans (2001) Evans R.O., 2001, IAU Circ. 7772
- Filippenko (1988) Filippenko A.V., 1988, AJ, 96, 1941
- Filippenko & Chornock (2002) Filippenko A.V., Chornock R., 2002, IAU Circ. 7988
- Filippenko et al. (1993) Filippenko A.V., Matheson T., Ho L.C., 1993, ApJ, 415, L103
- Garnavich et al. (2003) Garnavich P.M. et al., 2003, ApJ, 582, 924
- Harkness et al. (1987) Harkness R.P. et al., 1987, ApJ, 317, 355
- Harpaz et al. (1997) Harpaz A., Rappaport S., Soker N., 1997, ApJ, 487, 809
- Höflich et al. (1993) Höflich P., Langer N., Duschinger M., 1993, A&A, 275, L29
- Iben & Renzini (1983) Iben I., Renzini A., 1983, ARA&A, 21, 271
- Iwamoto et al. (1998) Iwamoto K. et al., 1998, Nature, 395, 672
- Kulkarni et al. (1998) Kulkarni S.R. et al., 1998, Nature, 395, 663
- Kwok et al. (1998) Kwok S., Su K.Y.L., Hrivnak B.J., 1998, ApJ, 501, L117
- Larsen & Richtler (1999) Larsen S.S., Richtler T., 1999, A&A, 345, 59
- Matheson & Jha (2001) Matheson T., Jha S., 2001, IAU Circ. 7772
- Mattila et al. (2004) Mattila S., et al. 2004, in preparation
- Mastrodemos & Morris (1999) Mastrodemos N., Morris M., 1999, ApJ, 523, 357
- Mauron & Huggins (2000) Mauron N., Huggins P.J., 2000, A&A, 359, 707
- Moffat et al. (1986) Moffat A.F.J., Lamontagne R., Shara M.M., McAlister H.A., 1986, AJ, 91, 1392
- Monnier et al. (1999) Monnier J.D., Tuthill P.G., Danchi W.C., 1999, ApJ, 525, L97
- Montes et al. (2000) Montes, M.J., Weiler K.W., Van Dyk S.D., Panagia N., Lacey C.K., Sramek R.A., Park R., 2000, ApJ, 532, 1124
- Nomoto et al. (1993) Nomoto K., Suzuki T., Shigeyama T., Kumagai S., Yamaoka H., Saio H., 1993, Nature, 364, 507
- Paczyński (1975) Paczyński B., 1975, ApJ, 202, 558
- Podsiadlowski et al. (1993) Podsiadlowski Ph., Hsu J.J.L., Joss P.C., Ross R.R., 1993, Nature, 364, 509
- Podsiadlowski et al. (1992) Podsiadlowski Ph., Joss P.C., Hsu J.J.L., 1992, ApJ, 391, 246
- Pols & Nomoto (1997) Pols O.R., Nomoto K., 1997, in Leung K.C., ed., ASP Conf. Ser. Vol. 130, The Third Pacific Rim Conference on Recent Development of Binary Star Research. Astron. Soc. Pac., San Francisco, p. 153
- Sahai et al. (1998) Sahai R., et al., 1998, ApJ, 493, 301
- Schlegel & Ryder (2002) Schlegel E.M., Ryder S.D., 2002, IAU Circ. 7913
- Schlegel (2003) Schlegel E.M., 2003, private communication
- Schwarz & Pringle (1996) Schwarz D.H., Pringle J.E., 1996, MNRAS, 282, 1018
- Sramek & Weiler (2003) Sramek R.A., Weiler K.W. 2003, in Weiler K.W., ed., Supernovae and Gamma-Ray Bursters. Springer-Verlag, Berlin, p. 145
- Stanek et al. (2003) Stanek K.Z. et al., 2003, ApJ, 591, L17
- Stockdale et al. (2003) Stockdale C., Weiler K.W., Van Dyk S.D., Montes M.J., Panagia N., Sramek R.A., Perez-Torres M.A., Marcaide J.M., 2003, ApJ, 592, 900
- Swartz et al. (1993) Swartz D.A., Clocchiatti A., Benjamin R., Lester D.F., Wheeler J.C., 1993, Nature, 365, 232
- Tully (1988) Tully R.B., 1988, Nearby Galaxies Catalog. Cambridge University Press, Cambridge
- Turatto (2003) Turatto M., 2003, in Weiler K.W., ed., Supernovae and Gamma-Ray Bursters. Springer-Verlag, Berlin, p. 21
- Tuthill et al. (1999) Tuthill P.G., Monnier J.D., Danchi W.C., 1999, Nature, 398, 487
- Utrobin (1994) Utrobin V., 1994, A&A, 281, L89
- van der Hucht et al. (1988) van der Hucht K.A., Hidayat B., Admiranto A.G., Supelli K.R., Doom C., 1988, A&A, 199, 217
- Van Dyk et al. (1996) Van Dyk S.D., Hamuy M., Filippenko A.V., 1996, AJ, 111, 2017
- Van Dyk et al. (2004) Van Dyk S.D., et al., 2004, in preparation
- Walder & Folini (2003) Walder R., Folini D., 2003, in van der Hucht K.A., Herrero A., Esteban C., eds, Proc. IAU Symp. 212, A Massive Star Odyssey, from Main Sequence to Supernova. Astron. Soc. Pac., San Francisco, p. 139
- Weiler et al. (2001) Weiler K.W., Panagia N., Montes M.J., 2001, ApJ, 562, 670
- Weiler et al. (2002) Weiler K.W., Panagia N., Montes M., Sramek R.A., 2002, ARA&A, 40, 387
- Weiler et al. (1986) Weiler K.W., Sramek R.A., Panagia N., van der Hulst J.M., Salvati M., 1986, ApJ, 301, 790
- Weiler et al. (1992) Weiler K.W., Van Dyk S.D., Pringle J.E., Panagia N., 1992, ApJ, 399, 672
- Woosley et al. (1995) Woosley S.E., Langer N., Weaver T.A., 1995, ApJ, 448, 315