The elliptical galaxy colour-magnitude relation as a discriminant between the monolithic and merger paradigms
Abstract
The colour-magnitude relation (CMR) of cluster elliptical galaxies has been widely used to constrain their star formation histories (SFHs) and to discriminate between the monolithic collapse and merger paradigms of elliptical galaxy formation. We use a CDM hierarchical merger model of galaxy formation to investigate the existence and redshift evolution of the elliptical galaxy CMR in the merger paradigm. We show that the star formation history (SFH) of cluster ellipticals predicted by the model is quasi-monolithic, with only 10 percent of the total stellar mass forming after z 1. The quasi-monolithic SFH results in a predicted CMR that agrees well with its observed counterpart in the redshift range . We use our analysis to argue that the elliptical-only CMR can be used to constrain the SFHs of present-day cluster ellipticals only if we believe a priori in the monolithic collapse model. It is not a meaningful tool for constraining the SFH in the merger paradigm, since a progressively larger fraction of the progenitor set of present-day cluster ellipticals is contained in late-type star forming systems at higher redshift, which cannot be ignored when deriving the SFHs. Hence, the elliptical-only CMR is not a useful discriminant between the two competing theories of elliptical galaxy evolution.
keywords:
galaxies: elliptical and lenticular, cD – galaxies: evolution – galaxies: formation – galaxies: fundamental parameters1 Introduction
Evolution with redshift of fundamental physical relations can provide robust constraints on the epoch of formation and subsequent evolution of early-type galaxies. The apparently universal relationship between colour and luminosity of elliptical galaxies, usually referred to as the colour-magnitude relation (CMR), was first established by Sandage & Vishvanathan (1977), although the correlation between these two quantities had been demonstrated before (e.g. Baum, 1959; de Vaucouleurs, 1961; McClure & van den Bergh, 1968). The observed CMR has been widely used as a discriminant between the two competing theories of early-type galaxy evolution, the monolithic collapse model (e.g. Larson, 1974; Kodama & Arimoto, 1997) and the hierarchical merger model (e.g. Kauffmann et al., 1993; Somerville & Primack, 1999; Cole et al., 2000; Hatton et al., 2003; Khochfar & Burkert, 2003).
A comprehensive study of the CMR, using photometric data based on CCD observations of the nearby Virgo and Coma clusters, was first undertaken by Bower, Lucey & Ellis (1992, hereafter BLE92). Their results showed a remarkably small scatter about the mean relation. Their interpretation of the results, in the context of the monolithic collapse model, was to attribute the slope of the CMR to a variation in mean metallicity with luminosity and to attribute the small scatter to a small age dispersion between galaxies of the same size. They concluded that the epoch of formation of elliptical galaxies should be at . Subsequent studies of the CMR extended the BLE92 results to intermediate redshifts () and showed that there was no detectable evolution of the slope and scatter with time (e.g. Ellis et al., 1997; Stanford et al., 1998; Gladders et al., 1998; van Dokkum et al., 2000). The results from these studies were interpreted as confirmation of a high-redshift formation epoch of cluster ellipticals followed by passive evolution to present day.
Subsequent studies indicated that the key characteristics of the CMR (slope and scatter) that were derived by these authors needed some modification. Elliptical galaxies commonly display radial colour gradients (e.g. de Vaucouleurs, 1961; Sandage & Vishvanathan, 1978; Franx et al., 1989; Peletier et al., 1990), being optically redder at their cores than at the outskirts. Galaxy colours in the majority of these CMR studies were derived using fixed apertures which, given that a galaxy’s intrinsic size may vary, meant sampling different portions of different galaxies. Accounting for the effect of fixed aperture photometry is essential in the context of this study, since our model lacks spatial information on the scale of galaxies. Producing a central CMR is therefore not possible within the model and we must compare our results to aperture-corrected photometry.
Numerous authors have attempted to quantify the fixed-aperture bias that may result due to the presence of colour gradients. An efficient way to control this effect is to measure the colour inside an aperture which scales with the size of the galaxy (e.g. Bower et al., 1998; Terlevich et al., 2001; Scodeggio, 2001), such that one samples an identical fraction of the light in each galaxy. Bower et al. (1998) compared the CMR slope observed by BLE92 with the slope derived after replacing a fixed aperture with the parameter - the size of the galaxy within which the mean surface brightness is 19.80 mag arcsec-2. They estimated that colour gradients accounted for roughly 30 percent of the slope i.e. the magnitude of the slope in the CMR was roughly two-thirds of that derived using fixed-apertures in BLE92. Crucially, their study indicated that the CMR maintains a significant slope even after correcting for colour gradients. A series of other studies have also studied the effect of removing the fixed-aperture bias. Shallower CMR slopes have been reported by Prugniel & Simien (1996) who used colours derived within the effective radius (radius which contains half the galaxy’s light, ) and by Fioc & Rocca-Volmerange (1999) who used total magnitudes and colours. Scodeggio (2001) suggested that re-computing colours over for the BLE92 galaxies causes the apparent slope to decrease from to , a value which is statistically consistent with a zero slope. In addition, the scatter increases from to , due to the large intrinsic scatter in the colour gradients. However, the uncertainty in colour measurements within can be significantly larger than within , because the surface brightness within is higher. At the Scodeggio (2001) data is consistent with slopes between and . Modifying the BLE92 slope for colour gradients, using the 30 percent correction factor derived by Bower et al. (1998), gives , so that within the errors there is agreement between the various studies.
Over the last decade, there has been steadily accumulating evidence for morphological evolution amongst cluster galaxies, which suggests that formation mechanisms of cluster ellipticals are at least not uniquely monolithic. Although approximately 80 percent of galaxies in the cores of present day clusters have early-type morphologies (Dressler, 1980), a higher fraction of spiral galaxies have been reported in clusters at (e.g. Butcher & Oemler, 1984; Dressler et al., 1997; Couch et al., 1998; van Dokkum et al., 2000), along with increased rates of merger and interaction events (e.g. Couch et al., 1998; van Dokkum et al., 1999). Kauffmann et al. (1996) suggested that only approximately one-third of early-type galaxies in the Canada-France Redshift Survey (Schade et al., 1995) were fully formed and evolving passively. Franceschini et al. (1998) found a remarkable absence of early-types galaxies at in a K-band selected sample in the Hubble Deep Field. These results strongly suggest that early-type galaxies in nearby and distant clusters may have been formed from late-type progenitors (e.g. Butcher & Oemler, 1984; Dressler et al., 1997) and highlight the possible if not essential role of merger and interaction events in the formation of early-type galaxies. In particular, if the merger paradigm is correct then late-type progenitors of the present-day cluster ellipticals must be included in any method (e.g. the CMR) employed to determine their SFHs. Excluding these late-type progenitors would produce a distorted view of their formation histories (progenitor bias), a point first suggested and explored in detail by van Dokkum & Franx (2001).
Given the accumulating evidence for formation of early-type galaxies from star-forming progenitors at fairly recent epochs, a number of authors have successfully reconciled the observed CMR with galaxy merging models (Kauffmann & Charlot, 1998; Bower et al., 1998; Shioya & Bekki, 1998; van Dokkum et al., 1998). Apart from Kauffmann & Charlot (1998), these studies have not involved a fully realistic semi-analytical galaxy formation model which incorporates the important effects of galaxy merging on the chemo-photometric evolution of galaxies. One of our aims is to extend these studies by applying a CDM hierarchical merger model to study the CMR from low to high redshift.
We begin our study by discussing the comparative effects of age and metallicity in determining the model CMR at present day and tracing the bulk SFHs of cluster ellipticals as a function of redshift. We then explore the predicted evolution of the CMR to high redshifts, compare with existing observational evidence and, in particular, quantify the effect of progenitor bias. Using our analysis of progenitor bias, we present arguments to show that the commonly used elliptical-only CMR, even when it is derived using equal light fractions (c.f. Bower et al., 1998; Terlevich et al., 2001; Scodeggio, 2001), can only be used to constrain the SFHs of cluster ellipticals if we believe a priori in a monolithic collapse model. It is not a meaningful method of constraining the SFH in the hierarchical merger picture. Hence it is also not a useful discriminant between the two competing theories of galaxy evolution.
2 Model parameters that affect the present-day CMR
The model we use in this study is GALICS, which combines large scale N-body simulations with simple analytical recipes for the dynamical evolution of baryons within dark matter haloes. We direct readers to Hatton et al. (2003) for specifics regarding the model. There are certain key parameters in the model that affect the age and metallicity of the model galaxies and thus have an impact on the slope, scatter and absolute colour of the predicted CMR. A discussion of these model parameters is necessary, not only to elucidate their effect on the CMR, but also because the actual setup we use in this study is slightly different from the reference model given in Hatton et al. (2003). The setup has been altered, firstly to make some corrections to the metallicity of fresh gas injected into DM haloes, and secondly to bring the predicted metallicities of the model galaxies in agreement with current observational evidence. Table 1 summarises the changes in the characteristics of the CMR due to variations in these parameters. In the subsequent sections we present an explanation of the parameters and the values used in this study.
| Baseline metallicity = 0 | |||
| BHT = 45 | BHT = 60 | BHT = 120 | |
| Kennicutt IMF | |||
| Scalo IMF | |||
| Baseline metallicity = 0.1 | |||
| = 45 | BHT = 60 | BHT = 120 | |
| Kennicutt IMF | |||
| Scalo IMF | |||
2.1 Baseline metallicity
The reference model in Hatton et al. (2003) adds pristine i.e. metal-free gas to DM haloes when they are identified. However, the haloes are not identified until they achieve a threshold mass of . In reality, early population II stars would already have polluted the ISM in the time that it takes for such halo identifications to take place. Hence, the gas in the haloes should not be pristine but slightly polluted. Chemical enrichment models (e.g. Devriendt et al., 1999) suggest that this pollution should be of the order of . Hence, we use this value as a baseline metallicity for fresh gas injected into DM haloes in the model. The baseline metallicity has a negligible impact on the slope and scatter of the CMR but slightly affects the absolute colour of the cluster sample as it changes the average metallicities of the model galaxies.
2.2 Threshold black hole mass and IMF
Another parameter that affects the metal input into the ISM, and therefore the average metallicity of the stellar population, is the threshold mass at which a star becomes a black hole (BH). This is still poorly understood, but estimates suggest masses around (Tsujimoto et al., 1997), based on a combination of local stellar [O/Fe] abundances and chemical enrichment analysis. We use a threshold black hole mass of in this study.
Since massive stars make a significant contribution to the metal enrichment of the inter-stellar medium (ISM), the proportion of massive stars and hence the IMF affects the mean metallicities of the model galaxies. In this study we use a Kennicut IMF (Kennicutt, 1983), which was also used in the fiducial model of Hatton et al. (2003). Both the BH threshold and IMF increase the dynamical metal enrichment of the ISM. This changes not only the mean metallicity of the galaxies, and hence their absolute colour, but also makes the slope of the CMR steeper. This is because more massive galaxies, which have deeper potential wells, retain gas and therefore metals more effectively, leading to higher enrichment of the ISM and stellar populations that are born from it. However, less massive galaxies tend to lose their gas content anyway, so that a larger injection of metals into their ISM does not have a big impact on the metallicity of their stellar populations. As a result of this differential behaviour the slope of the CMR becomes steeper.
3 Properties of present-day cluster ellipticals
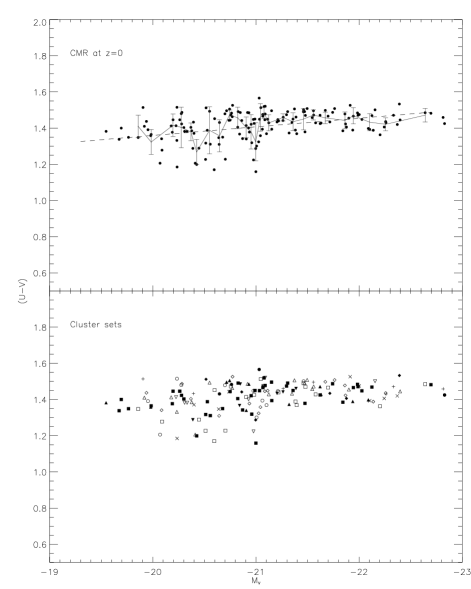
In this section, we explore the present-day CMR predicted by our model. Figure 1 presents the predicted CMR in our model for cluster ellipticals at . Also shown is a linear least-squares fit to the points (dotted line) and a progressive one-sigma fit to the sample, with the error bars indicating the local spread of points about the best-fit relation. We select present-day cluster ellipticals by identifying elliptical galaxies in dark matter (DM) haloes with masses of and above. Also shown in Figure 1 is the CMR sequence with galaxies coded according to their mean metallicities and ages. The bottom panel splits the model ellipticals into their individual clusters. The model slope is derived in all cases using a linear least-squares fit. The scatter is calculated using Tukey’s Biweight statistic (Beers et al., 1990), which has commonly been used by observers in CMR studies. Table 1 compares the model CMR with those derived by BLE92 and Bower et al. (1998) within and by Scodeggio (2001) using the effective radius, .
| Source | Slope | Scatter (mag) | Colour |
|---|---|---|---|
| Bower et al. (1992, 1998) (Coma) | 0.049 | U-V (within ) | |
| Scodeggio (2001) (Coma) | 0.136 | U-V (within ) | |
| This study | 0.082 | U-V (total magnitudes) |
The predicted model slope is consistent with both the value reported by Scodeggio (2001) and the BLE92 value, after correcting for colour gradients using the 30 percent correction derived in Bower et al. (1998). The predicted scatter is smaller than that derived by Scodeggio (2001) but roughly 1.5 times larger than that reported by Bower et al. (1998). We note, however, that the scatter in the model galaxies itself varies from cluster to cluster, so that the intra-cluster scatter may be different from the global value across all clusters. In Figure 2 we split our sample of model ellipticals into their respective clusters and plot the intra-cluster scatter as a fraction of the global scatter in the sample. We find, for example, that the cluster with the largest number of ellipticals has a lower scatter than the global value, although there are other large clusters which exhibit a scatter above the global value. We note that our model galaxy sample is an ensemble of galaxy sets from different clusters, whereas the observations usually refer to only one cluster. There may be additional issues contributing to the discrepancy between the model and observed scatter - for example, there appear to be strong radial colour gradients in cluster populations at low redshift (e.g. de Propris et al. 2004, Margoniner et al., 2001; Ellingson et al., 2001), such that bluer objects reside in the outer parts of clusters. The scatter of the observed CMR would therefore depend on the maximum cluster-centric radius sampled in the observations. In addition, since the observations are not derived from total colours, it is possible that colour gradients are correlated with deviations from the true total-colour CMR in such a way that aperture colours appear to have smaller scatter. For these reasons, we do not find the discrepancy between the model and observed scatters particularly compelling.

We find that the model predicts a significant correlation between colour and luminosity. An important question is how the model CMR is generated at present day. Clearly, in a hierarchical merger scenario age is expected to play a part in generating any such sequence. It is therefore crucial to disentangle the effects of age and metallicity and determine how much of the correlation is generated by a variation in age and how much by a variation in metallicity with luminosity.

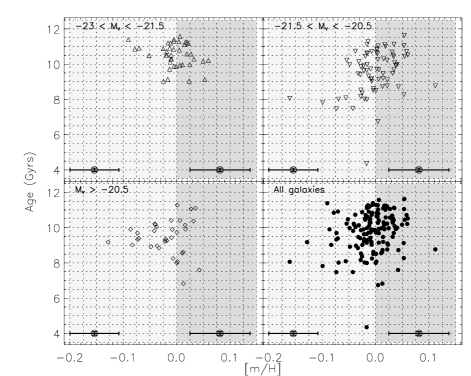
Figure 3 shows the variation in the mean ages and metallicities of the model cluster ellipticals with absolute V-band luminosity. We also show the age-metallicity parameter space for these model galaxies in Figure 4. We should note here that the metallicity resolution in the model is low, with stellar mass resolved only into five metallicity bins in the range . We have indicated the maximum average metallicity error for model galaxies with sub-solar and super-solar metallicities in Figure 4, by considering the half-widths of our metallicity bins. The resolution in age, by comparison, is exteremely good (0.1 Gyr), as indicated by the small age error bars.
The model predicts a gradient both in the age-luminosity and metallicity-luminosity relations, so that larger ellipticals are both older and more metal-rich. We note first that contrary to previous studies (e.g. Kauffmann & Charlot, 1998), higher mass (luminosity) ellipticals are predicted to have larger mean ages, in agreement with observational evidence (see e.g. Trager et al., 2000a, b; Caldwell et al., 2003). Current understanding of cooling flows in clusters is poor. Models suggest that if large inflows of cold gas are allowed at the centre of virialized DM haloes, it is impossible to prevent a large fraction of this material from forming stars (e.g. Cole et al., 2000), which are not observed at the present epoch. To prevent this, one has to reheat or keep gas hot in massive DM haloes. Various authors have tackled this problem in different ways. Kauffmann et al. (1993), for instance, prevented cooling from taking place in DM haloes with circular velocities of 350 km/s and above. GALICS takes advantage of the observed correlation between AGN and bulge mass (Magorrian et al., 1998) and assumes that AGNs are efficient enough to completely halt cooling flows as soon as the bulge which harbours them reaches a critical mass of . This coupling between AGN feedback and bulge mass prevents star formation early enough in large elliptical galaxies to allow them to grow solely through mergers of gas-poor progenitors. Thus, although galaxies with a larger mass experience their last merging events at a later time than their less luminous counterparts, the small gas fraction at these last-merger epochs prevents any substantial production of young stars from merger-driven starbursts. Therefore, although more massive galaxies are dynamically younger based on their merger record, their stellar populations are, nevertheless, older. The average predicted age of a cluster elliptical is approximately 9.8 Gyrs, and the scatter in age increases towards the low mass end, in agreement with recent observational studies in clusters such as Virgo (Caldwell et al., 2003). The average metallicity is approximately solar and the gradient in metallicity is modest, also in general agreement with recent spectroscopic studies of nearby cluster environments (Caldwell et al., 2003).
A comparison with simple stellar population (SSP) models (Yi, 2003) shows that roughly half of the CMR slope is generated by the age-luminosity gradient, with the rest attributable to the metallicity-luminosity gradient in the model sample. Clearly, the age and metallicity gradients complement each other in this model, in contrast to Kauffmann & Charlot (1998) where the anti-correlation between age and luminosity required a large compensating metallicity gradient (generated through high metal yields) to produce a CMR that was consistent with the BLE92 observations.

It is clearly beyond the scope of this paper to do a detailed comparison of how feedback is treated in GALICS and the specific model of Kauffmann & Charlot (1998). However, we note that there exists at least two main differences:
-
1.
Cosmological models - Kauffmann & Charlot (1998) adopt the SCDM cosmology while GALICS adopts the CDM cosmology.
-
2.
GALICS derives feedback directly from the mass locked up in the spheroidal component of the galaxy, while Kauffmann & Charlot (1998) use the velocity dispersion in dark matter haloes alone to stop the cooling.
The first point implies that in GALICS, structures of a given mass will be assembled earlier on average than in Kauffmann & Charlot (1998). The second point means that gas does not cool onto a spiral galaxy which sits in a halo with circular velocity greater than or equal to 350 km/s in the Kauffmann & Charlot (1998) model whereas it does in GALICS, provided the spiral does not possess a massive bulge. Feedback in GALICS is explicitly linked to the mass build up of spheroids, which in turn is correlated to the mass (velocity dispersion) build up of the host dark matter halo. However this latter correlation need not be linear, since the mass build up of spheroids depends on local physics (e.g. disk instabilities and mergers). We attribute the differences in the results of Kauffmann & Charlot (1998) and GALICS to these two factors (cosmology and feedback modelling) but note that there may be other factors in the details of the modelling that might cause discrepancies in the relationship between age, metallicity and luminosity in these two models.
Figure 5 presents the bulk cumulative SFH of the model cluster ellipticals. The SFH is shown both split into the five GALICS metallicity bins and considering all stellar mass. The cumulative SFH shows that 10 percent of the total stellar mass (solid line) was formed after , with 65 percent and 40 percent already in place at and respectively. The bulk SFH is quasi-monolithic because the low cold gas fraction at low redshifts () means that merger-driven star formation does not produce substantial amounts of stellar material. This enables the model elliptical CMR to maintain its slope and small scatter upto high redshifts (Section 4).
4 Evolution of the CMR with redshift
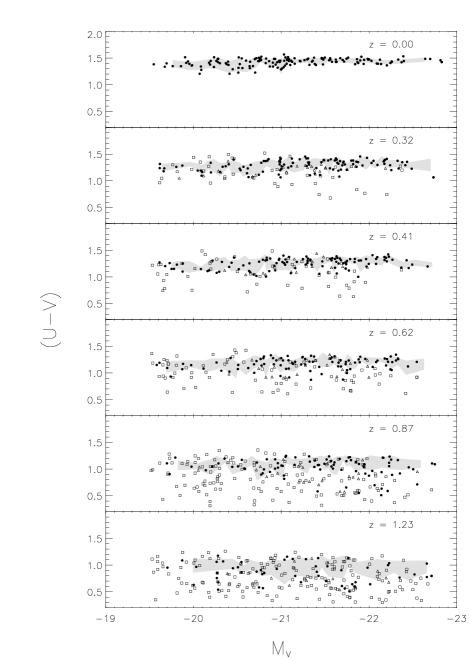
We now check if it is possible to reconcile the model CMR with observational data at various redshifts. Figure 6 shows the predicted evolution of the model CMR from present day to a redshift of 1.27, which is roughly the redshift limit of current observational evidence on early-type cluster galaxies (van Dokkum et al., 2001). As before, the dotted line displays a linear least-squares fit and we also show a progressive one-sigma fit to the sample, with the error bars indicating the local spread of points about the best-fit relation. Figure 7 traces the evolution of the slope and the scatter. The shaded region denotes the area enclosed by the predicted slopes and their associated errors.
We note that the definition of a cluster elliptical will change with increasing redshift. We assumed in our analysis of present-day cluster ellipticals that DM haloes with a mass equal to or greater than host regions of highest baryonic density and therefore galaxy clusters. However, since DM haloes are being steadily formed through time, maintaining a hard mass cut-off of for all redshifts would not be correct. To make this definition consistent with changing redshift we take into account the accretion history of DM haloes in the model. We first compute an average accretion history of the present-day DM haloes with masses of and above as a function of redshift. At each redshift we then define a cluster hosting DM halo as one whose mass is equal to or exceeds the value given by the average accretion history. We note that our values are consistent with van den Bosch (2002) who provides theoretical prescriptions for computing universal DM mass accretion histories.
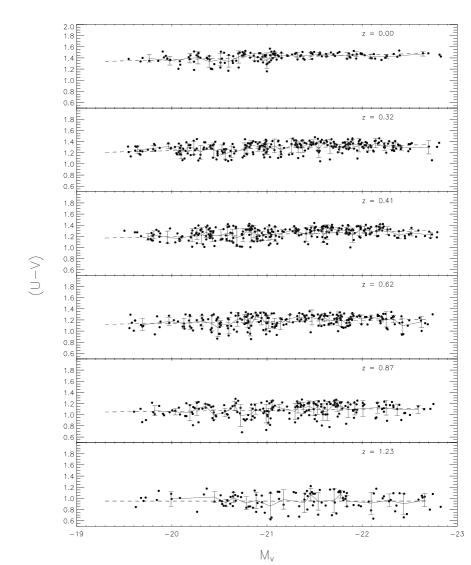
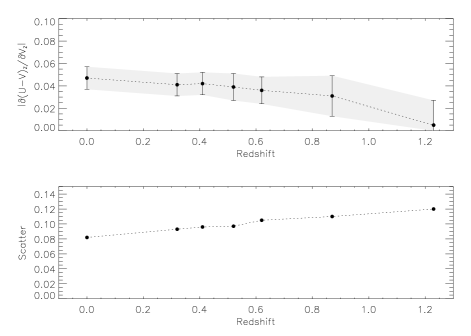
We see from Figure 7 that there is gradual evolution in the CMR slope, although in the range the evolution in the slope is zero within the errors. However, once we move out to the change in slope is appreciable compared to the value at present day. Within the errors, we see that at high redshifts (e.g. ) the CMR loses any detectable slope, partly because the expected increase in the scatter masks any correlation that may be present.

In Figure 8 we put the evolution of the predicted CMR in the context of observational evidence. We use a variety of sources who have explored the CMR in various colours. We apply the 30 percent correction for colour gradients derived by Bower et al. (1998) to studies that have used fixed apertures. We find that the slopes of the model and observed CMRs match well within the errors at all redshifts. In particular, we note that van Dokkum et al. (2001) reported a slope at that was significantly lower than the BLE92 value at present day. This suggests that the CMR slope does indeed decrease, in agreement with the expectations of a hierarchical merger scenario. The values for the model scatter are also fairly consistent with the observations, given the previous discussion in Section 2 regarding possible reasons for the discrepancy between the model and observed scatter at . However, we should note that the tightness of the predicted CMR (especially at the high luminosity end) seems larger than what appears in observational studies. The model ellipticals do occupy the red part of the sequence (shaded region in Figure 8), with a scatter to bluer colours which increases with redshift. However, comparing our results at to, for example van Dokkum et al. (2000, Figure 8), we find that at comparable redshift, the observed elliptical CMR is tighter than our model predictions, although outliers do exist in the observed elliptical sample.
5 Progenitor bias
When comparing the slope and scatter of the CMR at various redshifts, we should ideally sample the same stellar mass at every redshift. Only then are the slope and scatter truly meaningful tracers of the star formation history of the daughter mass seen today. However, an unavoidable result of the merger paradigm is that since early-type systems form through the amalgamation of late-type units, a progessively larger fraction of the stellar mass we see today in cluster ellipticals is locked up in late-type (spiral and irregular) units at higher redshifts. Hence the early-type systems at high redshift form a progressively narrower subset of the progenitors of present-day elliptical systems. Consequently, by not taking into account these late-type progenitors we introduce a bias in the CMR, mainly in terms of the observed scatter. In this section we quantify the effect of this progenitor bias (see also van Dokkum et al., 2001). Although tracing an astronomical object back through time is impossible observationally, it becomes a simple exercise within the model.

In Figure 9 we restrict ourselves to the progenitor set of present-day cluster ellipticals. We show only those galaxies (regardless of morphology) that eventually contribute to the formation of cluster ellipticals which exist at . We are therefore tracing the same stellar mass back through time, regardless of the type of system that hosts it. We find that including progenitors with S0 morphology does not change the slope of the CMR. The overall scatter increases slightly at higher redshifts (), although the elliptical-only scatter agrees, within errors, to the E+S0 scatter. S0s, however, tend to contribute more outliers to the CMR at higher redshifts. Including the late-type progenitors causes the scatter to increase approximately three-fold in the range , compared to the elliptical-only scenario. This result agrees with CMR observations at high redshift. For example, van Dokkum et al. (2000) found that the elliptical CMR at has a scatter of 0.024 while the scatter for all morphological types is 0.081 - an approximate 3.5 fold increase. Blakeslee et al. (2003) noted that for their observed cluster at , deriving the scatter without reference to morphology increases the CMR scatter three to four-fold. A similar increase can be estimated from the study by Van Dokkum et al. (2001) of a cluster at (see their Figure 3).
Figure 10 indicates how much of the progenitor set of present-day cluster ellipticals is composed of fully-formed ellipticals at any given redshift. It becomes clear from Figure 10 that if we look solely at the elliptical progenitors of present-day cluster ellipticals we sample a progressively thinner fraction of the progenitor set at higher redshift. Although restricting ourselves to this subset of progenitors seems to give a CMR which maintains its slope and scatter with redshift (Figure 6), an elliptical-only CMR can be used to constrain the SFH of only the part of the stellar mass in present-day cluster ellipticals that is contained solely in early-type systems at any given redshift. However, since the subset of elliptical progenitors is not representative of all the stellar material at present day, we cannot use the evolution of an elliptical-only CMR to constrain the SFH of the entire stellar mass of present-day cluster ellipticals.
Figures 6, 9 and 10 show that the merger paradigm does indeed expect to have fully formed elliptical galaxies (and therefore a red sequence) evolving passively at redshifts where CMR observations have been conducted. However, the elliptical-only CMR at high redshift does not correspond to the elliptical-only CMR at present day and comparisons between the two give a heavily biased picture of the star formation history of elliptical galaxies and has serious implications for the ability of the CMR to discriminate between the monolithic collapse and hierachical merger paradigms. In essence, the quantity (in this case the elliptical-only CMR) that is being used to discriminate between the two formation models is no longer model independent and therefore loses its usefulness as a discriminant.
6 Summary and conclusions
We have used a semi-analytical hierarchical galaxy formation model to investigate the existence and evolution of the CMR of elliptical galaxies in cluster environments. Our analysis shows that, by constructing a CMR purely out of early-type systems, the predicted relation agrees well with local observations (after the fixed-aperture bias has been corrected) and with observations at all redshifts in the range . Secondly, we have used our analysis to quantify the issue of progenitor bias and construct the CMR that could be expected if we could identify all progenitor systems at high redshift that would eventually form part of a present-day cluster elliptical. We have also shown that the scatter in this all-progenitor CMR is consistent with the scatter derived, without reference to morphology, in cluster CMR studies at high redshift. Thirdly, we have suggested that the elliptical-only CMR is not a useful discriminant between the monolithic and merger formation scenarios since it is significantly biased towards the monolithic picture. Although the merger paradigm satisfies the elliptical-only CMR in any case and expects to have a monolithically evolving red sequence at high redshift, restricting our studies to early-type systems does not provide meaningful information about the true star formation history of all the stellar mass that is found today in cluster ellipticals.
The debate regarding these two competing theories of elliptical galaxy formation still remains an open one. Although there is clear evidence of interactions, mergers and recent star formation in early-type systems, a possible caveat is the inability of the merger paradigm to satisfy the high [Mg/Fe] ratios observed in luminous ellipticals (e.g. Trager et al., 2000a). These super-solar abundance ratios indicate a lack of enrichment from Type Ia supernovae, thereby constraining the duration of star formation and gas infall to timescales shorter than about 1 Gyr (e.g. Matteucci & Recchi, 2001; Ferreras & Silk, 2003). While the CMR has been used as an indirect tool for constraining the star formation history of cluster ellipticals, more direct sources of evidence may be required. If the stellar mass in cluster ellipticals did indeed form at then we should not find any traces of star formation after this epoch, which in a CDM universe corresponds to an age of approximately 10 Gyrs. The merger models do of course predict star formation right upto the present day and one could assume that at least a small fraction of the resultant stellar mass could be locked up in globular clusters, which are the faintest stellar aggregations that can be accessed observationally.
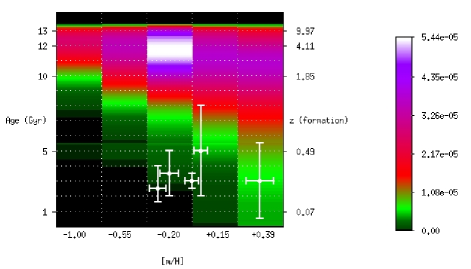
Figure 11 shows the bulk distribution of stellar mass in present-day cluster ellipticals predicted by the hierarchical merger paradigm. One can treat this as a probability distribution of stellar mass, with the highest intensity areas (see key) indicating ages and metallicities where most of the stellar mass is likely to be found. The crucial difference between this model distribution and a distribution based on the monolithic collapse model is the presence of young stars. Indeed we find that observations of young globular clusters have been made in elliptical galaxies by a variety of authors (Goudfrooij et al., 2001; Kissler-Patig et al., 2002; Larsen et al., 2003; Strader et al., 2003; Yi et al., 2004). We indicate these observations in Figure 11. The five data points with error bars in Figure 11 show the age/metallicity properties of young globular cluster populations derived in these studies. To conclude, we suggest that it seems increasingly likely that the monolithic collapse picture may simply be a subset of the merger paradigm and that the dominant mechanism for the formation of elliptical galaxies is through the merging of late-type progenitors.
Acknowledgements
We are indebted to the referee, Richard Bower, for numerous suggestions and comments which signifcantly improved the quality of this paper. We warmly thank Jeremy Blaizot, Roger Davies, Joseph Silk and Sadegh Khochfar for their careful reading of this manuscript and many useful discussions. We also thank Seok-Jin Yoon for constructive remarks related to this work. SK acknowledges PPARC grant PPA/S/S/2002/03532. This research has been supported by PPARC Theoretical Cosmology Rolling Grant PPA/G/O/2001/00016 (S. K. Yi) and has made use of Starlink computing facilities at the University of Oxford.
References
- Baum (1959) Baum W. A., 1959, PASP, 71, 106
- Beers et al. (1990) Beers T. C., Flynn K., Gebhardt K., 1990, AJ, 100, 32
- Bernardi & et al. (2003) Bernardi M., et al. 2003, AJ, 125, 1882
- Blakeslee & et al. (2003) Blakeslee J. P., et al. 2003, ApJL, 596, L143
- Bower et al. (1998) Bower R. G., Kodama T., Terlevich A., 1998, MNRAS, 299, 1193
- Bower et al. (1992) Bower R. G., Lucey J. R., Ellis R., 1992, MNRAS, 254, 589
- Butcher & Oemler (1984) Butcher H., Oemler A., 1984, ApJ, 285, 426
- Caldwell et al. (2003) Caldwell N., Rose J. A., Concannon K. D., 2003, AJ, 125, 2891
- Chiosi & Carraro (2002) Chiosi C., Carraro G., 2002, MNRAS, 335, 335
- Cole et al. (2000) Cole S., Lacey C. G., Baugh C. M., Frenk C. S., 2000, MNRAS, 319, 168
- Couch et al. (1998) Couch W. J., Barger A. J., Smail I., Ellis R. S., Sharples R. M., 1998, ApJ, 497, 188
- De Propris & et al. (2004) De Propris R., et al. 2004, ArXiv Astrophysics e-prints
- de Vaucouleurs (1961) de Vaucouleurs G., 1961, ApJS, 5, 233
- Devriendt et al. (1999) Devriendt J. E. G., Guiderdoni B., Sadat R., 1999, A&A, 350, 381
- Dressler (1980) Dressler A., 1980, ApJ, 236, 351
- Dressler et al. (1997) Dressler A., Oemler A. J., Couch W. J., Smail I., Ellis R. S., Barger A., Butcher H., Poggianti B. M., Sharples R. M., 1997, ApJ, 490, 577
- Ellingson et al. (2001) Ellingson E., Lin H., Yee H. K. C., Carlberg R. G., 2001, ApJ, 547, 609
- Ellis et al. (1997) Ellis R. S., Smail I., Dressler A., Couche W. J., Oemler A. J., Butcher H., Sharples R. M., 1997, ApJ, 483, 582
- Ferreras & Silk (2003) Ferreras I., Silk J., 2003, MNRAS, 344, 455
- Fioc & Rocca-Volmerange (1999) Fioc M., Rocca-Volmerange B., 1999, A&A, 351, 869
- Franceschini et al. (1998) Franceschini A., Silva L., Fasano G., Granato L., Bressan A., Arnouts S., Danese L., 1998, ApJ, 506, 600
- Franx et al. (1989) Franx M., Illingworth G., Heckman T., 1989, AJ, 98, 538
- Gladders et al. (1998) Gladders M. D., Lopez-Cruz O., Yee H. K. C., Kodama T., 1998, ApJ, 501, 571
- Goudfrooij et al. (2001) Goudfrooij P., Mack J., Kissler-Patig M., Meylan G., Minniti D., 2001, MNRAS, 322, 643
- Hatton et al. (2003) Hatton S., Devriendt J. E. G., Ninin S., Bouchet F. R., Guiderdoni B., Vibert D., 2003, MNRAS, 343, 75
- Kauffmann & Charlot (1998) Kauffmann G., Charlot S., 1998, MNRAS, 297, L23+
- Kauffmann et al. (1996) Kauffmann G., Charlot S., White S. D. M., 1996, MNRAS, 283, L117
- Kauffmann et al. (1993) Kauffmann G., White S. D. M., Guiderdoni B., 1993, MNRAS, 264, 201
- Kennicutt (1983) Kennicutt R. C., 1983, ApJ, 272, 54
- Khochfar & Burkert (2003) Khochfar S., Burkert A., 2003, ApJL, 597, L117
- Kissler-Patig et al. (2002) Kissler-Patig M., Brodie J. P., Minniti D., 2002, A&A, 391, 441
- Kodama & Arimoto (1997) Kodama T., Arimoto N., 1997, A&A, 320, 41
- Larsen et al. (2003) Larsen S. S., Brodie J. P., Beasley M. A., Forbes D. A., Kissler-Patig M., Kuntschner H., Puzia T. H., 2003, ApJ, 585, 767
- Larson (1974) Larson R. B., 1974, MNRAS, 166, 385
- Magorrian et al. (1998) Magorrian J., Tremaine S., Richstone D., Bender R., Bower G., Dressler A., Faber S. M., Gebhardt K., Green R., Grillmair C., Kormendy J., Lauer T., 1998, AJ, 115, 2285
- Margoniner et al. (2001) Margoniner V. E., de Carvalho R. R., Gal R. R., Djorgovski S. G., 2001, ApJL, 548, L143
- Matteucci & Recchi (2001) Matteucci F., Recchi S., 2001, ApJ, 558, 351
- McClure & van den Bergh (1968) McClure R. D., van den Bergh S., 1968, AJ, 73, 1008
- Peletier et al. (1990) Peletier R. F., Davies R. L., Illingworth G. D., Davis L. E., Cawson M., 1990, AJ, 100, 1091
- Prugniel & Simien (1996) Prugniel P., Simien F., 1996, A&AS, 309, 749
- Sandage & Vishvanathan (1977) Sandage A., Vishvanathan N., 1977, ApJ, 203, 707
- Sandage & Vishvanathan (1978) Sandage A., Vishvanathan N., 1978, ApJ, 225, 742
- Schade et al. (1995) Schade D., Lilly S. J., Crampton D., Hammer F., Le Fevre O., Tresse L., 1995, ApJL, 451, L1+
- Scodeggio (2001) Scodeggio M., 2001, AJ, 121, 2413
- Shioya & Bekki (1998) Shioya Y., Bekki K., 1998, ApJ, 504, 42
- Somerville & Primack (1999) Somerville R. S., Primack J. R., 1999, MNRAS, 310, 1087
- Stanford et al. (1998) Stanford S. A., Eisenhardt P. R. M., Dickinson M., 1998, ApJ, 492, 461
- Strader et al. (2003) Strader J., Brodie J. P., Schweizer F., Larsen S. S., Seitzer P., 2003, AJ, 125, 626
- Terlevich et al. (2001) Terlevich A. I., Caldwell N., Bower R. G., 2001, MNRAS, 326, 1547
- Trager et al. (2000a) Trager S. C., Faber S. M., Worthey G., González J. J., 2000a, AJ, 119, 1645
- Trager et al. (2000b) Trager S. C., Faber S. M., Worthey G., González J. J., 2000b, AJ, 120, 165
- Tsujimoto et al. (1997) Tsujimoto T., Yoshii Y., Nomoto K., Matteucci F., Thielemann F., Hashimoto M., 1997, ApJ, 483, 228
- van den Bosch (2002) van den Bosch F. C., 2002, MNRAS, 331, 98
- van Dokkum & Franx (2001) van Dokkum P. G., Franx M., 2001, ApJ, 553, 90
- van Dokkum et al. (2000) van Dokkum P. G., Franx M., Fabricant D., Illingworth G. D., Kelson D. D., 2000, ApJ, 541, 95
- van Dokkum et al. (1999) van Dokkum P. G., Franx M., Fabricant D., Kelson D. D., Illingworth 1999, ApJ, 520, L95
- van Dokkum et al. (1998) van Dokkum P. G., Franx M., Kelson D. D., Illingworth G. D., 1998, ApJ, 504, L17
- van Dokkum et al. (2001) van Dokkum P. G., Stanford S. A., Holden B. P., Eisenhardt P. R., Dickinson M., Elston R., 2001, ApJL, 552, L101
- Yi (2003) Yi S. K., 2003, ApJ, 582, 202
- Yi et al. (2004) Yi S. K., Peng E., Ford H., Kaviraj S., Yoon S.-J., 2004, MNRAS, 349, 1493