Massive star formation: Nurture, not nature
Abstract
We investigate the physical processes which lead to the formation of massive stars. Using a numerical simulation of the formation of a stellar cluster from a turbulent molecular cloud, we evaluate the relevant contributions of fragmentation and competitive accretion in determining the masses of the more massive stars. We find no correlation between the final mass of a massive star, and the mass of the clump from which it forms. Instead, we find that the bulk of the mass of massive stars comes from subsequent competitive accretion in a clustered environment. In fact, the majority of this mass infalls onto a pre-existing stellar cluster. Furthermore, the mass of the most massive star in a system increases as the system grows in numbers of stars and in total mass. This arises as the infalling gas is accompanied by newly formed stars, resulting in a larger cluster around a more massive star. High-mass stars gain mass as they gain companions, implying a direct causal relationship between the cluster formation process, and the formation of higher-mass stars therein.
keywords:
stars: formation – stars: luminosity function, mass function – globular clusters and associations: general.1 Introduction
There are currently two competing ideas as to how massive stars form. Do they form as essentially a scaled-up version of low-mass stars (e.g. Shu, Adams & Lizano 1987), where the star’s mass is determined by the mass in the molecular core that collapses due to its self-gravity? Alternatively, is the final mass of massive stars determined through environmental processes such as competitive accretion or mergers in clusters? In the first scenario, the stellar environment is unimportant and the mass is decided by the amount of mass which is necessary to be self-gravitating considering either thermal or turbulent support (Yorke & Kruegel 1977; McKee & Tan 2002, 2003). Thus, high-mass clumps in molecular clouds, if they are just self-gravitating, lead directly to high-mass stars (Padoan & Nordlund 2002). This is an attractive possibility as the high-mass tail of the clump-mass spectrum resembles the stellar initial mass function (eg., Ophiuchus; Motte, André & Neri 1998). McKee & Tan (2003) envision that the pre-massive star clumps are located in the high pressure regions in the centre of clusters, although such a spatial segregation of massive clumps is not found in the Ophiuchus and Serpens protoclusters (Elmegreen & Krakowski 2001).
In the second scenario, the star’s mass is strongly influenced, if not determined, by the stellar environment, a stellar cluster. Individual stars compete for the reservoir of gas (Zinnecker 1982; Larson 1992), with those sitting in the bottom of the potential winning the competition and thus accreting more gas and attaining higher masses (Bonnell et al. 1997; 2001a). In this case, the final masses need have little correlation with their initial masses, the accretion can explain the full range and distribution of stellar masses (Bonnell et al. 2001b). A similar process was discussed by Murray & Lin (1996) where gas parcels were evolved under purely dynamical forces until they collided and merged. Parcels that become gravitationally unstable collapse to form stars and grow in mass through further collisions with other gas parcels.
In both cases, the massive star grows through accretion onto a lower-mass protostellar core (Behrend & Maeder 2001). One potential difficulty with accretion is that feedback in the form of radiation pressure may limit the mass accumulation process to masses of order M⊙(Wolfire & Cassinelli 1987; Yorke & Kruegel 1977; Edgar & Clarke 2003), although a rapid rotation may sufficently reduce the star’s luminosity in the equatorial plane (Yorke & Sonnhalter 2002). Thus, more exotic processes such as stellar mergers may be potentially required in order to explain the formation of massive stars (Bonnell, Bate & Zinnecker 1998).
Observationally, there are a number of circumstantial clues that support an environmental influence on massive star formation. Massive stars are even more likely than their low-mass counterparts to be found in stellar clusters (Clarke, Bonnell & Hillenbrand 2000; Lada & Lada 2003). Young clusters are generally mass segregated with the most massive stars found in their cores. Additionally, there is an observational correlation of the mass of intermediate and high-mass stars with the stellar density of the surrounding cluster (Testi, Palla & Natta 1999; Hillenbrand 1995, see Clarke et al. 2000). For example, Testi et al. (1997, 1999) surveyed the environments of pre-main sequence Herbig AeBe stars and found that stars more massive than are generally surrounded by a cluster of lower-mass stars and that the number of stars in the cluster increases with increasing mass. This implies a potential causal relationship between the number of stars in the cluster and the mass of the most massive star. The Herbig AeBe data is also consistent with random pairing from an initial mass function (IMF) (Bonnell & Clarke 1999) although this would not explain the observed mass segregation in larger clusters.
In this paper, we investigate the formation of massive stars that occur in a numerical simulation of the fragmentation of a turbulent molecular cloud and the subsequent formation of a stellar cluster (Bonnell, Bate & Vine 2003). This simulation showed that the stellar cluster, containing approximately 400 stars, formed through a hierarchical fragmentation and merging process. The turbulence leads to several sites of star formation. Individual stars form in filamentary structures and then fall towards their local potential minima. This forms small-N subclusters which grow through accreting infalling stars and gas. The subclusters eventually merge, aided by the dissipation of kinetic energies by the gas, to form one large cluster. The simulation formed six stars with masses greater than 10 M⊙ with a maximum stellar mass of M⊙, ignoring any radiative feedback (e.g. Yorke & Kruegel 1977; Yorke & Sonnhalter 2002). In section 2 we detail the calculations. Section 3 investigates the origin, in the simulation, of the massive stars. Section 4 relates the massive star formation to the process of cluster formation and the resultant cluster properties. We discuss the implications of this work for massive star formation in Section 5 while our conclusions are given in Section 6.
2 Calculations
The results presented in this paper are based on a numerical simulation performed with the Smoothed Particle Hydrodynamics (SPH) method (Monaghan 1992, Benz et al. 1991). The details of this simulation have already been presented in Bonnell et al. (2003), and we summarise the relevant details here. The simulation followed the fragmentation of a turbulent molecular cloud containing 1000 M⊙ in a region of 0.5 pc radius for or years. The gas is isothermal at K as expected for densities g cm-3 (eg., Larson 1969; Masunaga, Miyama & Inutsuka 1998). The supersonic turbulence is modelled by including a divergence-free random Gaussian velocity field with a power spectrum where is the wavenumber of the velocity perturbations (Ostriker, Stone & Gammie 2001). The dependence of the fragmentation and resultant IMF has been shown to be rather insensitive to the slope of the power spectrum (Delgado-Donate, Clarke & Bate 2004; cf Klessen, Heitsch and Mac Low 2000 and Klessen & Burkert 2001). In three dimensions, this matches the observed variation with size of the velocity dispersion found in molecular clouds (Larson 1981). The velocities are normalised to make the kinetic energy equal to the absolute magnitude of the potential energy so that the cloud is marginally bound. In contrast, the thermal energy is initially only 1 per cent of the kinetic energy. The Jeans mass of the cloud is then , and the cloud contains 1000 thermal Jeans masses. The turbulence leads to the generation of shocks, structure and the dissipation of kinetic energy (Mac Low et al. 1998, Ostriker et al. 2001). We do not include any feedback (radiative or kinematic) from the newly formed stars, which is a limitation as feedback from massive stars can be dynamical important (radiation pressure, HII regions etc). Osorio, Lizano & D’Alessio (1999) discuss how the incipient HII region from a young massive star can be choked off through high accretion rates. The simulation was carried out on the United Kingdom’s Astrophysical Fluids Facility (UKAFF), a 128 CPU SGI Origin 3800 supercomputer.
Dense protostellar fragments are replaced by sink-particles in order to follow the evolution further (Bate, Bonnell & Price 1995). These sink-particles accrete infalling gas that falls within a sink-radius of 200 AU if they are bound to the sink-particle, whereas all gas particles that fall within 40 AU are accreted, regardless of their properties. The simulation used particles, implying a minimum protostellar mass of M⊙(e.g. Bate & Burkert 1997). Fragments with lower-masses are not resolvable in this simulation. The gravitational accelerations between sink-particles are smoothed within distances of 160 AU. Stellar collisions are not included in the simulation.
3 The origin of massive stars


One of the major results of the simulation reported in Bonnell et al. (2003) is that the cluster formation process naturally results in a distribution of stellar masses from to M⊙, with a median mass of M⊙, and that agrees broadly with observed initial mass functions. Figure 1 shows the evolution of the number of stars present in the cluster as well as the maximum and median stellar masses. The median mass is approximately constant throughout the evolution while both the number of stars, and the maximum stellar mass, increase.
This result could be misinterpreted as being due to the random sampling from an IMF such that when more stars are present, the chance of having a more massive star increases. This neglects the fact that the individual stars accrete mass throughout the evolution. Thus for example, the star that is the most massive star (at 5 M⊙) when stars are present, is the same star that ultimately is the most massive star (at ) in the final cluster of stars.
It is not always the same star which is the most massive star in the system. The discontinuities in the maximum stellar mass indicates where different stars take over being the most massive star present. We thus have a self-consistent star formation laboratory with which to study massive star formation, and how individual stellar masses are determined. For example, we can investigate the clump-masses from which the stars form and thus whether the physical conditions of the pre-collapse clumps determines the stellar masses. Furthermore, SPH being a Lagrangian method, we can trace back where the mass, that ultimately comprises the more massive stars, originates in the molecular cloud.
We estimate the clump-mass from which each star forms, at the time of formation, as the mass contained within a spherical radius where the local gas density is continually decreasing. The end of a clump is then defined as when the local gas density starts to rise, or when another star is encountered. We see in figure 2 that there is no correlation between these clump masses and the final stellar masses. The clump masses extend from above our resolution limit of to . The most massive stars originate from clumps that are near the median of the distribution at , which is itself approximately the final median stellar mass of M⊙. Some of the more massive clumps actually result in lower-mass stars suggesting either multiple fragmentation or that a significant fraction of the clump is accreted by another star.


As mentioned above, we can use the Lagrangian nature of SPH to reconstruct the mass accretion history for each star and determine where the mass originated. The middle panel of figure 2 plots the relation between the final stellar masses and the mass contained within an initial envelope around the forming star. This envelope is defined as a spherical region in which at least 99 per cent of the gas ultimately ends up on the star concerned. This envelope represents a mass reservoir from which the star accretes unimpeded by the presence of other stars. Thus, although it includes mass added through accretion after protostar formation, it excludes any mass added through competitive accretion in a cluster environment. This envelope mass can account for some of the lower-mass stars but fails to recover the masses of the more massive stars (). Even though one of the more massive stars has the most massive envelope, this envelope represents only per cent of the final mass. There is a definite trend that higher-mass stars originated within more massive envelopes. An initially higher-mass aids in the subsequent accretion process. The right-hand panel of figure 2 plots the remaining mass that therefore is accreted from regions outside this envelope and therefore from regions which contribute mass to more than one star. This accretion accounts for the bulk of the mass of more massive stars. Thus we see the role played by competitive accretion far outweighs that of the structure in the molecular cloud in determining the masses of higher-mass stars.
We gain a better understanding of where the mass of the more massive stars comes from in figure 3 which plots the cumulative distribution of the mass, which ultimately comprises the most massive star, at the time of protostar formation. The mass distribution extends throughout the cloud, with only about a third of the total mass initially contained within parsecs. Figure 3 also plots the cumulative mass distribution at a time when it has 10 other stars as companions within parsecs, the typical size of the sublcusters that form in the simulation. Even once the star has 10 other stars in its subcluster, the bulk of the star’s mass is at large distances and has to be accreted from outside the system. This can be seen from Figure 4 that shows the spatial distribution of the mass that ultimately is accreted by this star at four different epochs, protostar formation (, years), when the star has 10 and 25 neighbours within parsecs (at times and and masses of and ), and when the star attains a mass of (at ).
At the time of protostar formation (upper-left panel), there is only one other star present in the system and there is a well defined clump around the forming star. The gas is extended over much of the volume from which the cluster as a whole ultimately forms. The mass distribution is still very extended when 10 and 25 companion stars are contained within parsecs. By the time the star has accreted up to , the gas distribution which makes up the remaining 19 M⊙ is still very extended, even though many other stars have since formed which make up the cluster as a whole (Bonnell et al. 2003).
The right-panel of figure 3 plots the distribution of the accreted mass against the maximum number of stars that lie within this gas and its target star. We can see from this figure that the vast majority of the gas comes from outside a significant group of stars and could in principle be accreted by any of them. That this one star is able to accrete such a significant fraction of the infalling gas is due to the nature of competitive accretion in clusters. The accretion rate is then determined by a combination of the star’s mass and kinematics such that more massive stars, which generally move slower, accrete at significantly higher rates than do lower-mass stars (Bonnell et al. 2001a).
In general, the stars that eventually attain higher masses form earlier in the simulation. This provides more time for them to accrete, but more importantly, they have less competition initially such that they are already more massive than the average star by the time they have many companions. They are then more likely to accrete enough gas to become massive stars. Thus, five of the six highest mass stars (with ) form out of the initial 50 stars, but there remain many low-mass stars amongst these 50.


4 Massive stars and cluster formation
In the previous section we have seen that massive stars accrete the majority of their mass competitively, that is when other stars are present in a clustered environment and the gas infalls from outside the cluster (Figs. 3 and 4). Shock dissipation results in a decrease in the turbulent support in the cloud (Mac Low et al. 1998; Ostriker et al. 2001), allowing the gas to infall into the potential wells formed by the stellar clusters. This gas accretion into the cluster, and ultimately onto the most massive star, must also be accompanied by any stars that form in this infalling gas (Fig 4). This then links the formation of the stellar cluster and the formation of the massive stars therein.
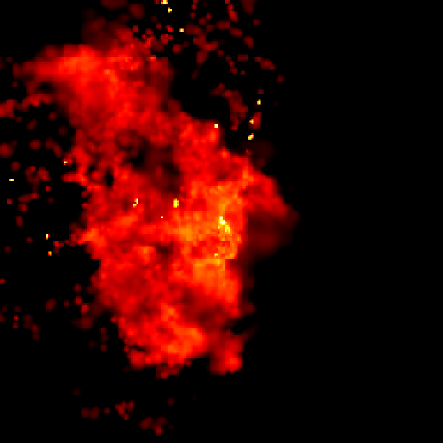
As reported in Bonnell et al. (2003), the simulation produced a number of subclusters which evolved independently before merging to form the final cluster. This provides multiple sites to assess how the formation of a stellar cluster is linked to the formation of the massive stars the clusters contain. Figure 5 shows the subclustering at , roughly half-way through the simulation and at a time where 244 stars have formed. We see that the system is highly subclustered and that there is a relatively massive star ( M⊙) in the centre of each subcluster. In this section, we explore the interelation between massive star formation and the formation of a stellar cluster.
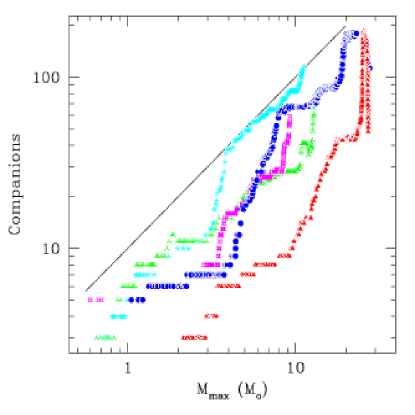
For what follows, we define a cluster size of parsecs radius. We then evaluate, for each star, how many other stars are in this region and whether the star considered is the most massive of all its companions. In Figure 6, we plot the evolution of five stars which spend significant amounts of time as the most massive star in their subcluster. The number of companion stars within parsecs is plotted against the mass of this most massive star. Stars start out with low masses and evolve to higher masses due to gas accretion. When new, lower-mass companions enter within parsecs, the star moves upwards towards having more companions. If a higher-mass companion enters this volume, then the original star being considered is no longer the most massive star in its group and is then no longer plotted.
We see that the general evolution is from low-mass stars with few companions towards high-mass stars with a hundred or more companions. This tells us that as the most massive star grows by accreting the gas that infalls onto the cluster (Fig. 3), the sub-cluster grows by gaining more stars. Figure 6 shows a nearly linear relation () between the number of companions and the mass of the most massive star. Thus, lower-mass stars are not the most massive stars in rich clusters, nor are higher-mass stars generally found in isolation or in sparsely populated clusters. Indeed, no stars more massive than are found in relative isolation ( parsecs of another star) in the simulation. There are a number of stars that form in relative isolation, but they never attain a significantly high mass.
The underlying explanation for the correlation evident in Figure 6 between the number of stars in the cluster and the mass of the most massive star is simply that both are due to the same process. Gas infalls onto the local potential minimum, which is the stellar cluster. This gas forms a reservoir of mass from which the stars accrete competitively. The most massive star ’wins’ the competition due to its mass and location in the centre of the subcluster (Bonnell et al. 2001a). At the same time, the gas is forming additional stars, which then infall into the cluster, increasing the cluster numbers. Some stars actually form inside our nominal cluster radius from the infalling gas. The infalling and newly formed stars are generally lower-mass stars maintaining a low median stellar mass ( M⊙). The correlation must then arise as the star formation is inefficient but converts an approximately constant mass-fraction of the infalling gas into stars. The remaining mass provides the gas reservoir from which the individual stars accrete allowing some to attain high masses.
4.1 Cluster properties and the IMF
In this section we investigate how the mass of the most massive star grows relative to the total mass in stars in each system. Observed stellar clusters show a clear correlation of total mass as a function of the mass of the most massive star in the system (e.g. Larson 2003). This correlation could even extend out to much higher mass systems containing intermediate and supermassive black holes (Larson 2003; Clarke 2003). It is also of interest as one expects that a competitive accretion model naturally results in a similar mass spectrum independent of the size of the cluster.
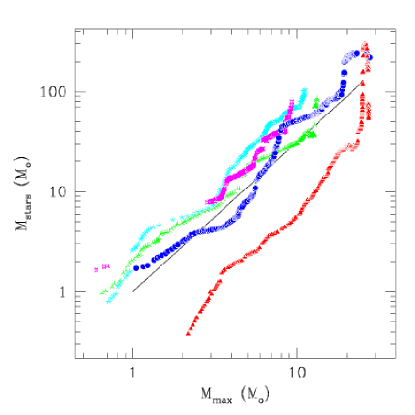
For each subcluster, we evaluate the total mass in companion stars within parsecs of the most massive star therein. We exclude the mass of the most massive star in this total. The evolution of the total companion mass is plotted against the most massive star’s mass in figure 7, for the five most massive stars that spend significant amounts of time as the most massive in their systems.
Once again we see a strong correlation between these two quantities with the general evolution of an increasing mass in companion stars as the maximum stellar mass increases. The five systems evolve along similar slopes in the diagram even though one of the systems is significantly underpopulated in numbers of companion stars, and in their total mass. The rapid rise in companion mass in the upper right-hand part of the diagram occurs near the end of the evolution when the systems merge. Otherwise, the general evolution is along a slope given by or . Interestingly, this result is basically what one expects for the relation between the mass of a system and its most massive component when they follow a Salpeter-type IMF (Larson 2003, Clarke 2003). Thus, each individual system is evolving in a manner consistent with populating a Salpeter-like IMF.
Each subcluster evolves by accreting stars and gas from the surrounding cloud. The stars are typically low-mass stars of median mass M⊙, similar to the clump masses from which they form. Along with the stars, gas also infalls onto the system. Competitive accretion will occur such that the more massive, slower moving, and more centrally located stars benefit and accrete mass at higher rates (Bonnell et al. 1997, 2001a). Competitive accretion in the virialised cores of clusters naturally yields a Salpeter-like IMF for higher mass stars while subvirial infall into the cluster yields shallower IMF for lower-mass stars (Bonnell et al. 2001b). That this process occurs approximately independent of the size of the system explains the general evolution found in figure 7 for the individual subclusters. We thus find a direct relationship between the process which builds clusters and the mass accretion which forms the most massive star.
In order to explain the high-mass end of the mass spectrum, the infalling gas must comprise a sufficient reservoir to produce a mean stellar mass approximately twice that of the median stellar mass. This implies that at most half of the infalling mass can be in gravitationally bound and collapsing clumps. This then leaves at least half of the mass to be accreted by the individual stars of the cluster.
5 Discussion
In this paper we have investigated how massive star formation occurs in the context of one numerical simulation. This is undoubtably not the only environment in which one could image massive star formation occurring. The primary assumptions of the simulation are the mean Jeans mass [the minimum mass to be gravitationally bound] in the cloud, the total number (1000) of such Jeans masses in the cloud, and that the cloud is globally supported by turbulence with the power spectrum prescribed in §2. The first two were chosen in order that the mean stellar mass be similar to that found in the field and star forming regions as well as the Galaxy as a whole. The second assumption is a requisite in order for fragmentation to form sufficient numbers of stars to be a stellar cluster. The exact nature of the turbulence is a more difficult manner, although its justification is due to the observed line-width size relationship of molecular clouds (Larson 1981). Changing the power spectrum can affect the fraction of gas in clumps and hence the amount left-over for competitive accretion (Klessen, Heitsch & Mac Low 2000). Thus, although this could increase the maximum mass produced by the fragmentation, it would most likely be at the cost of the lower-mass mass spectrum. We can therefore conclude that competitive accretion must play a role in the formation of massive stars unless they form in isolation (away from low-mass stars).
It is worth noting here that we have not included any radiative feedback from the massive stars (Yorke & Sonnhalter 2002; Edgar & Clarke 2003), nor have we investigated the likelihood of direct collisions in massive star formation (Bonnell, Bate & Zinnecker 1998; Bonnell & Bate 2002). Radiation pressure on dust could halt infall for stars more massive than , limiting the masses of the most massive stars. We would still get the same trend found here for intermediate-mass stars. Furthermore, even with the gravitational softenning used, stellar densities reached maximum values of stars/pc-3, which is near the threshold for collisions. Thus it is conceivable that stellar mergers may play a role in massive star formation.
6 Conclusions
The formation of massive stars is intricately linked to the formation of stellar clusters. Using a numerical simulation of the formation of a stellar cluster from the fragmentation of a turbulent molecular cloud, we show that massive stars do not owe their masses to the pre-collapse clump masses. Massive star formation is not just a scaled-up version of low-mass star formation. Instead, their masses are due to subsequent infall from outside the subcluster in which the massive star resides. The mass of the most massive stars is therefore primarily due to competitive accretion in a cluster environment (Bonnell et al. 2001a). Even relatively low-mass stars (with derive the majority of their mass from competitive accretion.
The infalling gas is accompanied into the subcluster by newly formed stars. Thus, an individual cluster grows in numbers of stars as the most massive star increases in mass. This results in a direct correlation similar to that observed in Herbig AeBe stars (Testi et al. 1997, 1999; Hillenbrand 1995, see Clarke et al. 2000), and provides a physical alternative to a probabilistic sampling from an IMF (Bonnell & Clarke 1999). Lastly, we find that the mass of the most massive star in each subsystem is linked to the total mass in stars that the system contains. This is due to the nature of competitive accretion in producing a Salpeter-like IMF in individual systems.
Acknowledgments
The computations reported here were performed using the U.K. Astrophysical Fluids Facility (UKAFF).
References
- [] Bate M. R., Bonnell I. A., Price N. M., 1995, MNRAS, 277, 362.
- [] Bate M. R., Burkert A., 1997, MNRAS, 288, 1060.
- [\citeauthoryearBehrend & Maeder2001] Behrend R., Maeder A., 2001, A&A, 373, 190
- [] Benz W., Bowers R. L., Cameron A. G. W., Press B., 1991, ApJ, 348, 647.
- [] Bonnell I. A., Bate M. R., 2002, MNRAS, 336, 659
- [] Bonnell I. A., Bate M. R., Clarke C. J., Pringle J. E., 1997, MNRAS, 285, 201.
- [] Bonnell I. A., Bate M. R., Clarke C. J., Pringle J. E., 2001a, MNRAS, 323, 785.
- [] Bonnell I. A., Bate M. R., Vine S. G., 2003, MNRAS, 343, 413
- [] Bonnell I. A., Bate M. R., Zinnecker H., 1998, MNRAS, 298, 93.
- [] Bonnell I. A., Clarke C. J., 1999, MNRAS, 309, 461
- [] Bonnell I. A., Clarke C. J., Bate M. R., Pringle J. E., 2001b, MNRAS, 324, 573.
- [] Clarke C.J., 2003, Carnegie Observatories Astrophysical Series I: Coevolution of Black Holes and Galaxies, ed. L. C. Ho, (Cambridge University Press), in press
- [] Clarke C.J., Bonnell I. A., Hillenbrand L. A., 2000, , in Protostars and Planets IV (eds V. Mannings, A. P. Boss and S. Russell), 151.
- [] Delgado-Donaté E., Clarke C.J., Bate M.R., 2004, MNRAS, in press
- [\citeauthoryearEdgar & Clarke2003] Edgar R., Clarke C., 2003, MNRAS, 338, 962
- [\citeauthoryearElmegreen & Krakowski2001] Elmegreen B. G., Krakowski A., 2001, ApJ, 562, 433
- [] Hillenbrand L. A., 1995, PhD thesis, University of Massachusetts, Amherst.
- [\citeauthoryearKlessen & Burkert2001] Klessen R. S., Burkert A., 2001, ApJ, 549, 386
- [\citeauthoryearKlessen, Heitsch, & Mac Low2000] Klessen R. S., Heitsch F., Mac Low M., 2000, ApJ, 535, 887
- [] Lada C. J., Lada E. A., 2003, ARA&A, in press
- [\citeauthoryearLarson1969] Larson R. B., 1969, MNRAS, 145, 271
- [] Larson R. B., 1981, MNRAS, 194, 809.
- [] Larson R. B., 1992, MNRAS, 256, 641
- [\citeauthoryearLarson2003] Larson R. B., 2003, in Galactic Star formation Across the Stellar Mass Spectrum, ASP Conference Series, ed. J. M. De Buizer, p. 65
- [\citeauthoryearMac Low et al.1998] Mac Low M., Klessen R. S., Burkert A., Smith M. D., 1998, PhRvL, 80, 2754
- [] Masunaga H., Miyama S. M.; Inutsuka, S., 1998, ApJ, 495, 346
- [] McKee C., Tan J., 2002, Nature, 416, 59
- [\citeauthoryearMcKee & Tan2003] McKee C. F., Tan J. C., 2003, ApJ, 585, 850
- [] Monaghan J. J., 1992, ARA&A, 30, 543.
- [\citeauthoryearMotte, André, & Neri1998] Motte F., André P., Neri R., 1998, A&A, 336, 150
- [\citeauthoryearMurray & Lin1996] Murray S. D., Lin D. N. C., 1996, ApJ, 467, 728
- [\citeauthoryearOsorio, Lizano, & D’Alessio1999] Osorio M., Lizano S., D’Alessio P., 1999, ApJ, 525, 808
- [] Ostriker E. C., Stone J. M., Gammie C. F., 2001, ApJ, 546, 980.
- [\citeauthoryearPadoan & Nordlund2002] Padoan P., Nordlund Å., 2002, ApJ, 576, 870
- [] Shu F. H., Adams F. C., Lizano S., 1987, ARA&A, 25, 23
- [] Testi L., Palla F., Prusti T., Natta A., Maltagliati S., 1997, A&A, 320, 159.
- [] Testi L., Sarget A. I., Olmi L., Onello J. S., 2000, ApJL, 540, L53
- [\citeauthoryearWolfire & Cassinelli1987] Wolfire M. G., Cassinelli J. P., 1987, ApJ, 319, 850
- [\citeauthoryearYorke & Sonnhalter2002] Yorke H. W., Sonnhalter C., 2002, ApJ, 569, 846
- [\citeauthoryearYorke & Kruegel1977] Yorke H. W., Kruegel E., 1977, A&A, 54, 183
- [] Zinnecker H., 1982, in Symposium on the Orion Nebula to Honour Henry Draper, eds A. E. Glassgold et al., New York Academy of Sciences, p. 226