A deeper view of Extremely Red Galaxies: the redshift distribution in the GOODS/CDFS ISAAC field.
Abstract
We have analysed 5-epoch GOODS HST-ACS B, V, and z datasets (V1.0 release), in conjunction with existing VLT-ISAAC imaging in the J, H and bands, to derive estimated redshifts for the sample of 198 Extremely Red Galaxies (ERGs) with (Vega) and selected by Roche et al. (2003) from 50.4 arcmin2 of the GOODS/CDFS field. We find that, at this depth, the ERG population spans the redshift range and over two decades in mass ( to ). Our results show that the dust-corrected red envelope of galaxy evolution is well modelled by a starburst at redshift followed thereafter by passive evolution. We explore the evolution of the ERG luminosity function (LF) from redshifts to and compare it with the global -band LF at redshifts . We find that the bright end of the ERG LF does not decrease from redshifts to and we connect this fact with the presence of progenitors of the local population at redshifts . We determine lower limits of and on the comoving densities of progenitors of local massive galaxies already assembled at redshifts and , respectively. We have investigated the existence of high-redshift Lyman break galaxies massive enough to be included in this ERG sample. Out of an initial list of 12 potential very high redshift candidates, we have identified 2 ERGs which have a high probability of lying at . We discuss the advantages of multi-colour to single-colour selection techniques in obtaining reliable lists of very high-redshift candidate sources, and present revised lower redshift estimates for sources previously claimed as potential dropouts in recent studies.
keywords:
galaxies: evolution – galaxies: formation – galaxies: high-redshift1 Introduction
The study of ‘extremely red galaxies’ (ERGs) is of importance for setting constraints on the first epoch of massive galaxy formation, for exploring the population of dust-reddened starbursts, and for testing models of galaxy formation in general. Usually defined as objects with or (Vega), these galaxies have been widely studied since their discovery by Elston, Rieke & Rieke (1988). The traditional picture identifies the ERGs either with passively evolving elliptical galaxies, or with young starbursts strongly reddened by dust. This mixture has been confirmed by spectroscopic (Dunlop et al. 1996; Soifer et al.1999; Cimatti et al. 2002; Saracco et al. 2003) and sub-millimetre surveys (Cimatti et al. 1998; Dey et al. 1999; Wehner, Barger & Kneib 2002). However, the latest photometric and morphological studies of these objects indicate that the ERG population is perhaps more complex than previously considered (Smail et al. 2002; Miyazaki et al. 2002; Yan & Thompson 2003; Moustakas et al. 2004).
Most previous samples of ERGs have been selected to a limiting magnitude of or brighter, and their inferred redshift distributions peak at . New deeper observations reaching and beyond (Maihara et al. 2001, Saracco et al. 2001) are uncovering ERGs at higher redshifts. In particular, a population of galaxies with very red near-infrared colours has been discovered to lie at redshifts (Totani et al. 2001). Saracco et al.(2004) claim that three massive galaxies of this kind in the Hubble Deep Field South (HDFS) at account for about of the comoving density of the local early-type galaxies. However, these studies are based on small area surveys which cover a few square arcmin of the sky. Deep -band observations in wider areas are required to obtain significant samples of high redshift ERGs and to determine more accurate lower limits for the fraction of massive galaxies already assembled at different redshifts.
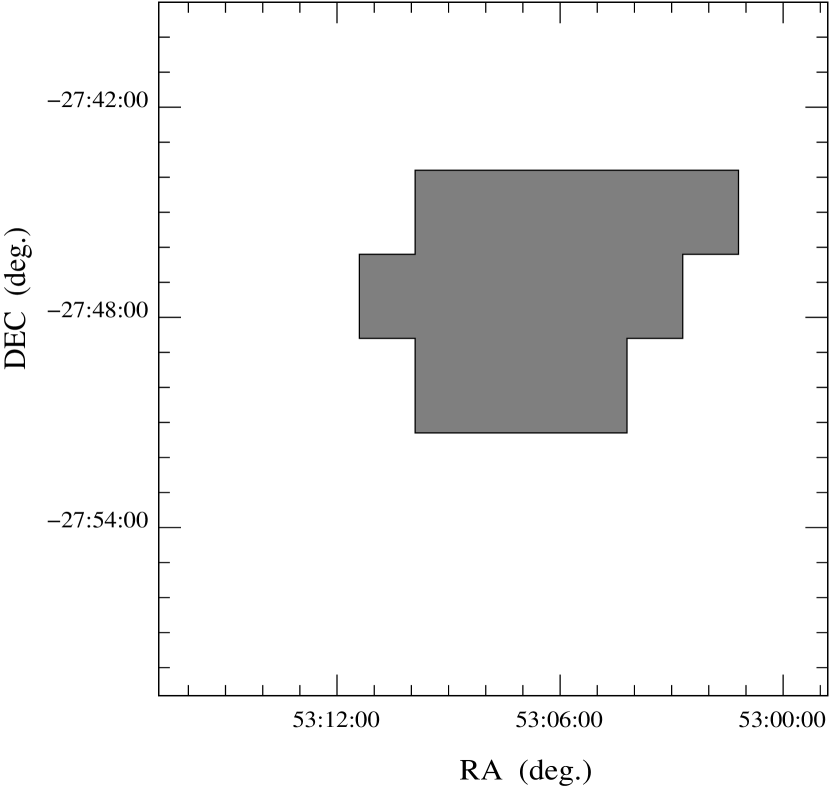
The Great Observatories Origins Deep Survey (GOODS) (Dickinson et al. 2003) is providing unprecedented multiwavelength data in 320 arcmin2 centred on the Chandra Deep Field South (CDFS) and Hubble Deep Field North (HDFN). Within the GOODS/CDFS field, Roche, Dunlop & Almaini (2003) selected 198 ERGs with (Vega) and from the 50.4 arcmin2 for which deep near infra-red (near-IR) data have been obtained with the Infrared Spectrometer and Array Camera (ISAAC) on the ‘Antu’ Very Large Telescope (Antu-VLT). This is the deepest significant sample of ERGs selected to date, and is the subject of the present study. The region covered by the ISAAC observations within the GOODS/CDFS field is shown in fig.1. Other previous studies of ERGs reaching exist in the CDFS. For example, the K20 survey has yielded spectroscopic redshifts for ERGs in 32.2 arcmin2 of this field (Cimatti et al. 2002). More recently, the GOODS team (Moustakas et al. 2004) selected a sample of ERGs from 163 arcmin2 of the GOODS/CDFS field with data from the Advanced Camera for Surveys (ACS) on board the Hubble Space Telescope (HST). The area covered by this brighter ERG sample is three times greater than that covered by the Roche et al. sample studied here. However, the Moustakas et al. sample only reaches a depth of (equivalent to ), and so the present study probes a different (and complementary) region of parameter space to that already explored by the GOODS team.
Roche et al. (2003) studied the number density of ERGs within their sample and compared the results with the predictions of different galaxy formation models. They also demonstrated that the strong clustering displayed by the ERG population extends to the faintest magnitudes. In this work, we present photometric redshift estimates for the ERGs in the Roche et al. sample and explore the resulting implications for the nature and evolution of ERGs.
The layout of this paper is as follows. First, in Section 2, we briefly review the sample selection and explain the details of the multiwavelength photometry. In Section 3 we discuss the photometric redshift techniques applied, and present examples of individual redshift determinations. Then, in Section 4 we present our results and discuss raw and dust-corrected Hubble diagrams (), the red envelope of galaxy evolution, the evolution of the ERG luminosity function (LF), and derived lower limits on the comoving densities of progenitors of local galaxies. We discuss the individual properties of each of our high-redshift () candidate sources and revise the nature of those included in the Hubble Ultra Deep Field (UDF), in the light of the new publicly available ultra-deep images taken with the HST-ACS and the HST-Near Infrared Camera and Multi Object Spectrometer (NICMOS). We also review the existence of an ERG cluster reported by Roche et al. (2003). Finally, we present some concluding remarks in Section 5. We adopt throughout a cosmology with , and .
2 The sample-Multiwavelength photometry

GOODS observations include optical and near-IR imaging in the B, V, I775 and z bands with the ACS/HST and J, H and bands with the ISAAC-VLT. Roche et al. (2003) used ISAAC Ks-band data and ACS -band data to select a sample of 198 ERGs with (Vega) and . They performed the source extraction in the band and photometry in the , J, H and Ks bands using the public code ‘SExtractor’ (Bertin & Arnouts, 1996). All the selected ERGs are at least detections on the -band images. Further details of their photometric measurements from the ground-based data and their preliminary measurements on the -band ACS images are given in their paper. The aperture magnitudes measured on ISAAC images by Roche et al. (2003) and used here correspond to -diameter in all cases.
We performed photometric measurements for the four ACS bands on the stacked GOODS 5-epoch images (V1.0 HST/ACS data release), using the corresponding weighting maps. We looked for counterparts of the -selected ERGs on the I775 and z-band images within an angular radius of . For B and V bands we restricted the search of counterparts to to minimise the presence of interlopers. We also performed the magnitude measurements using the public code ‘SExtractor’. Many ERGs appeared as non-detected in the B and V bands, and some of them as non-detected in the or z bands. The algorithms for computing photometric redshifts depend critically on the adopted value of limiting magnitudes in the case of non detections, and a careful treatment of potential ‘dropouts’ is necessary to prevent the photometric redshift algorithms from finding fake high redshift sources. Therefore, in each case of a ‘SExtractor’ non-detection, we used the IRAF task ‘phot’ to measure aperture magnitudes centred at the ERG -band position. We measured -diameter aperture magnitudes on each ACS filter for those ERGs with . Beyond , we found that little flux was missed using instead of -diameter aperture magnitudes. Thus, for objects with , we used -diameter aperture magnitudes to reduce the random errors, and corrected the values systematically using the average offset between the and -diameter aperture magnitudes measured in each magnitude bin. After this procedure, only a few objects remained as formally non-detected in the V or redder ACS bands.
The photometry of three ERGs included in an initial list of potential very high redshift sources has been revised on the new available ACS and NICMOS ultra deep optical and near-IR images of the Hubble UDF (cf. Section 4.6). The procedure we followed to perform photometric measurements on these images is similar to the one used for the 5-epoch stacked GOODS HST/ACS images.
3 Redshift estimations
We computed photometric redshifts for the ERGs in the Roche et al. (2003) sample with the public code ‘hyperz’ (Bolzonella, Miralles & Pelló, 2000), using the seven passbands described in Section 2 (B, V, I775, z, J, H and Ks) and the GISSEL98 library of Bruzual & Charlot (1993). The code ‘hyperz’ computes the probability of an object being at a given redshift by searching for the best () fit to its photometric spectral energy distribution (SED) provided by any of the template spectra available in the library. The redshift which yields the highest probability is known as the ‘hyperz’ primary solution and, in the following, we refer to the best-fit SED as the one corresponding to this solution. Although this primary solution is the one used in most cases, ‘hyperz’ also allows one to construct a probability density distribution in redshift space for each object. This is very useful for revealing possible degeneracies in the redshift determination, and for assessing the significance of the primary solution. To account for dust obscuration, we applied a Calzetti et al. (2000) reddening law, allowing the extinction in the V-band (AV) to vary between 0 and 1. For the reddest objects, we ran ‘hyperz’ again allowing AV to vary between 0 and 3. This did not produce any substantial changes in the redshift estimations, but does have some impact on the estimated absolute magnitudes and ages.
We also used the public ‘Bayesian photometric redshifts’ (BPZ) code produced by Benítez (2000) to obtain a second, independent set of redshift estimates for the ERGs in our sample. This code computes photometric redshifts using a Bayesian approach (and also has the option of using a maximum likelihood technique like the one used by ‘hyperz’). The agreement between the redshifts estimated by ‘hyperz’ and the BPZ code is very good in most cases. Accordingly, with a few exceptions discussed individually in later sections, we have adopted the ‘hyperz’ results for the ERG sample simply because it provides not only the redshift probability distribution, but also several other useful quantities in the output (e.g. k-corrected absolute magnitudes in a selected filter, V-band dust extinction and age).
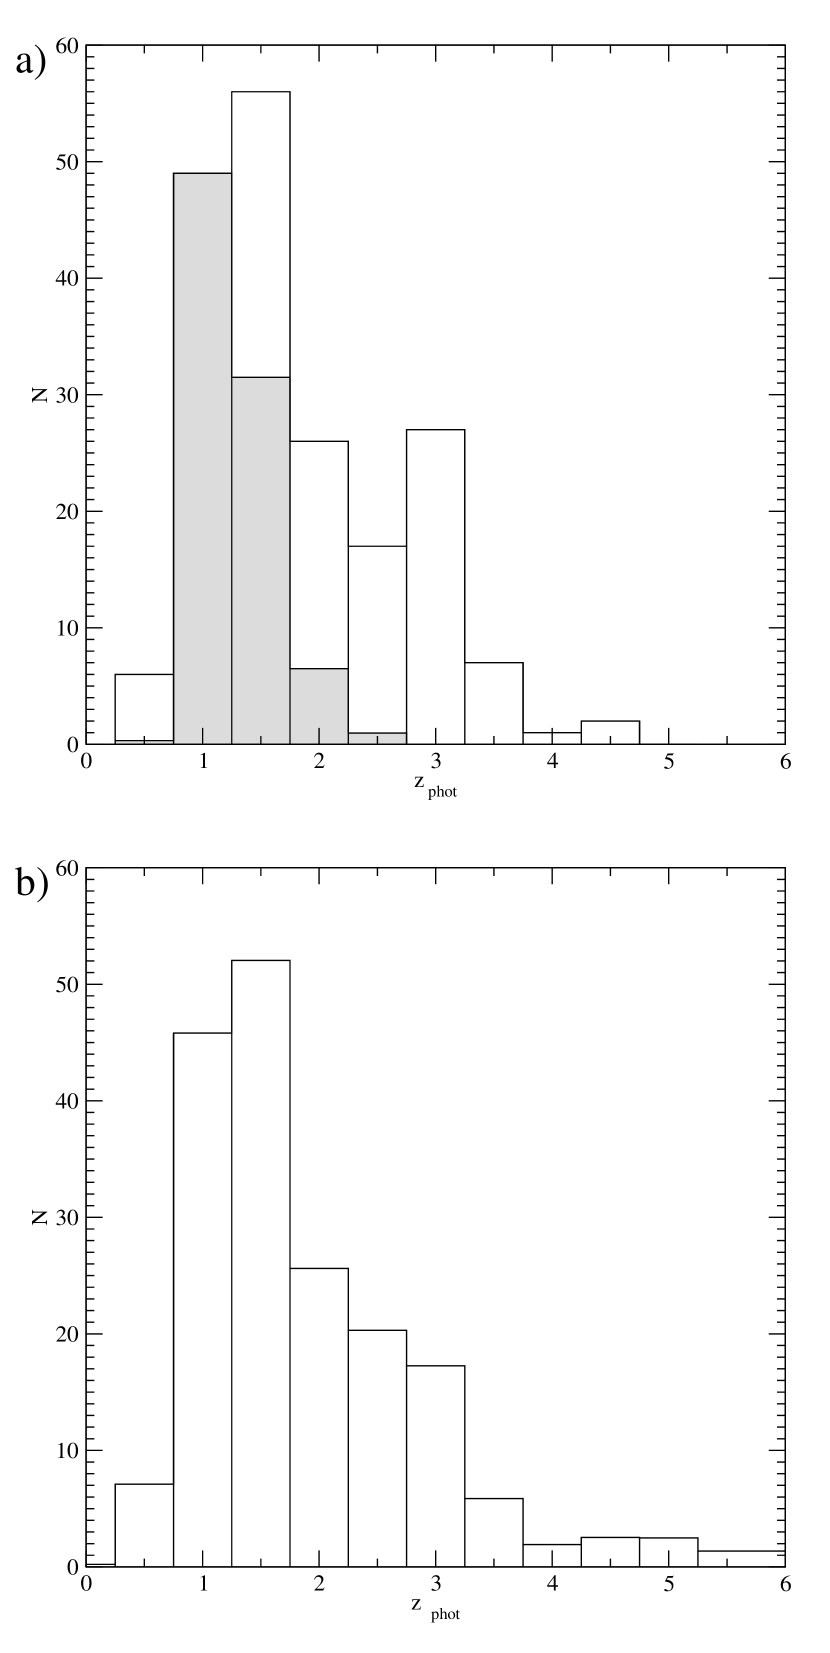
Figure 2 shows examples of the best-fit SEDs (left-hand panels) and redshift probability density distributions (right-hand panels) for three of the ERGs in our sample. In the SED plots, the circles correspond to the measured aperture magnitudes in each filter. The solid-line curves indicate the best-fit templates. The SED shown in fig. 2-a) corresponds to an object with ‘hyperz’ primary solution . The accuracy in the fitting and the small error bars in the photometry are reflected in a relatively small uncertainty in the redshift estimation. The SED shown in fig. 2-b) corresponds to an object with primary solution . In this case, the larger error bars in the photometry produce a wider redshift probability density distribution. Finally, the SED in fig. 2-c) corresponds to an ERG with primary solution . This is an example of an object with significant degeneracy in redshift space: the corresponding redshift distribution also shows non-negligible probabilities for this object to be either at or at .
4 Results
4.1 The redshift distribution
Figure 3 shows our derived redshift distribution for Roche et al. sample of ERGs. A few objects have been excluded either because their light is contaminated by bright neighbours or because they are quite likely to be stars given their very blue colours. These objects are characterised by very low probabilities of being at any redshift as deduced by ‘hyperz’. We constructed the histogram in fig. 3-a) taking into account ‘hyperz’ primary solutions only, for ease of comparison with the Hubble diagrams shown in Section 4.2. For the ERGs with identification numbers e1504 and e1605 in the Roche et al. sample, we adopted the redshifts estimated by the BPZ code by Benítez (2000) instead of the ‘hyperz’ primary solution for reasons which are explained in Section 4.6. This histogram, as well as all the results presented hereafter, include the revised redshifts of the potential high-z candidate ERGs e778, e1113 and e1272, as they were determined after measuring the photometry of these objects on the NICMOS and ACS ultra deep images of the Hubble UDF. We also show in fig. 3-a) the redshift distribution for the shallower sample of ERGs in the HST-ACS field of the GOODS/CDFS obtained by Moustakas et al. (2004) (shaded histogram), after division by a factor of 3.08 in order to normalise their distribution to produce the same number of objects in the redshift bin centred at as found in the present study.
The redshift distribution for the Roche et al. sample spans the range . Moustakas et al. sample, which is approximately two magnitudes shallower, only includes objects up to redshift . The maximum of our redshift distribution of ERGs is located at redshift . We find a secondary maximum at redshift . However, this secondary peak is not statistically significant and disappears when probability densities are used to construct the redshift distribution as shown in fig. 3-b). This latter histogram also includes very small corrections for the incompleteness of the sample111Roche et al. ERG sample is considered to be and complete to and at , respectively. and, thus, should be taken as a more realistic representation of the redshift distribution of the ERGs in the GOODS/CDFS deep ISAAC field.
4.2 The Hubble diagram: vs.
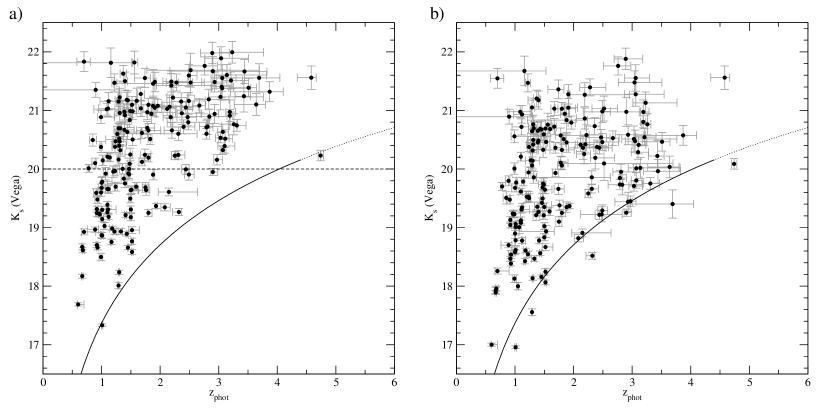
Figure 4 shows the Hubble diagram ( vs. ) for the ERGs in the Roche et al. sample, corresponding to the redshift distribution presented in fig. 3. The plots labelled as a) and b) show the raw and dust-corrected magnitudes as a function of redshift, respectively. Total magnitudes are considered in this case. We computed the dust-corrected magnitudes using the V-band extinction value applied to the best-fit SED in ‘hyperz’. The rest-frame wavelength sampled by the -band is
| (1) |
where is the effective wavelength of the filter, i.e. . In a dust-screen model, the extinction at a wavelength is related to the extinction in the V-band () by
| (2) |
For the Calzetti et al. (2000) reddening law, and is a power law in (cf. ‘hyperz’ user’s manual). The dust-corrected magnitude for each source is given by the difference . It is important to note that we assume the validity of the dust-screen model and the Calzetti et al. (2000) reddening law for modelling the extinction observed in ERGs. We explored the use of other reddening laws in ‘hyperz’ and found that both Milky Way and Large Magellanic Cloud-type laws produce very similar raw and dust-corrected Hubble diagrams for the ERGs in Roche et al. sample. The study of other geometries for the distribution of dust is beyond the scope of this paper, but one should be aware that they could change the relation given by eq. (2) between the extinction and the extinction in the V-band . This might have some impact on the derived properties of the most highly extincted ERGs.
In both plots 4-a) and 4-b), the circles indicate ‘hyperz’ primary solutions. The error bars correspond to 1 confidence levels. The overlaid solid curve shows the empirical K-z relation fitted for massive radiogalaxies (Willott et al. 2003), which approximately corresponds to the locus of passively evolving present-day galaxies formed instantaneously at redshift . The dotted line is a nominal extrapolation of the same law. In fig. 4-a), we have used a dashed line to indicate the region of the Hubble diagram to which the surveys limited at have access. Up to such a magnitude, only sources with are detected within our survey. For a limiting magnitude , the ERGs span the redshift interval and display a large dispersion in the vs. relation. In the raw -magnitude Hubble diagram there is an obvious lack of objects near the radio-galaxy locus beyond redshift . However, comparison with fig. 4-b) shows that this effect is a consequence of the presence of dust, rather than indicating a real absence of intrinsically bright, high-redshift ERGs.
The position of a galaxy in the dust-corrected diagram depends, of course, on its age as well as its mass. The radio-galaxy K-z relation can be interpreted as indicating the behaviour of the highest mass galaxies formed at very high redshift. However, galaxies may appear to be as bright or brighter than high-redshift radio galaxies without being as massive provided their stellar populations are sufficiently young and bright. However, as we show in Section 4.5, most of the galaxies around the radio-galaxy line do in fact appear to at least be massive enough to be the already assembled progenitors of the local population. The comparison of fig. 4-a) and 4-b) also shows that the dispersion in the relation for ERGs is not an effect produced by the presence of different amounts of dust. We see an even larger dispersion for the ERGs in the dust-corrected Hubble diagram. This fact indicates that the ERG population comprises objects spanning a wide range in mass.
To obtain an estimate of the minimum mass of each ERG, we used the -corrected -band absolute magnitude of each source and computed a lower limit for the luminosity the galaxy would have at redshift , assuming passive evolution. We explain the details of the calculation of the -corrected -band absolute magnitudes in Section 4.5. The luminosity L and the absolute magnitude M in a given band are related by the relation , where we considered for h=0.7, from the 2dF local luminosity function (Cole et al. 2001). Although the exact mass-to-light ratio depends on the assumed initial mass function (IMF) and the age of each galaxy, we estimate the mass of each ERG as , where L is the luminosity the galaxy would have today at redshift . Estimating the masses in this way, we find that the ERGs in the Roche et al. sample span two decades in mass, from to .
4.3 The red envelope of galaxy evolution
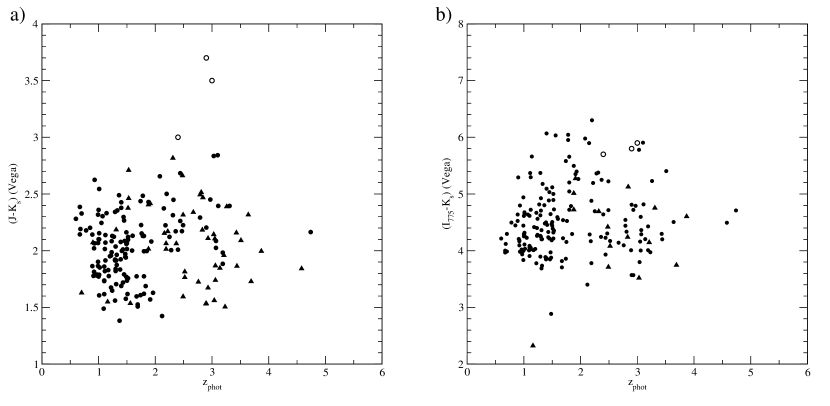
Figures 5-a) and 5-b) show the and colours, respectively, as a function of photometric redshift for the ERGs in the Roche et al. sample. Only ‘hyperz’ primary solutions are considered in this case. In fig. 5-a), the filled circles correspond to those objects with J-band -diameter aperture magnitude above the -confidence limit, in this case (Vega). The up-triangles indicate lower limits to the colours of those objects with , computed as . In fig. 5-b), the mixture of techniques we applied to measure aperture magnitudes on ACS images, i.e. ‘SExtractor’ plus IRAF ‘phot’, does not allow us to set the 2 confidence limit at a given -band magnitude. Thus, we considered as precise colours (filled circles) those with -band magnitude error . For objects with -band magnitude error we computed lower limits for the colours as (up-triangles). For comparison, we have added in both plots, 5-a) and 5-b), the colours of the three massive galaxies in the HDFS at redshift , reported by Saracco et al. (2004) (open circles).
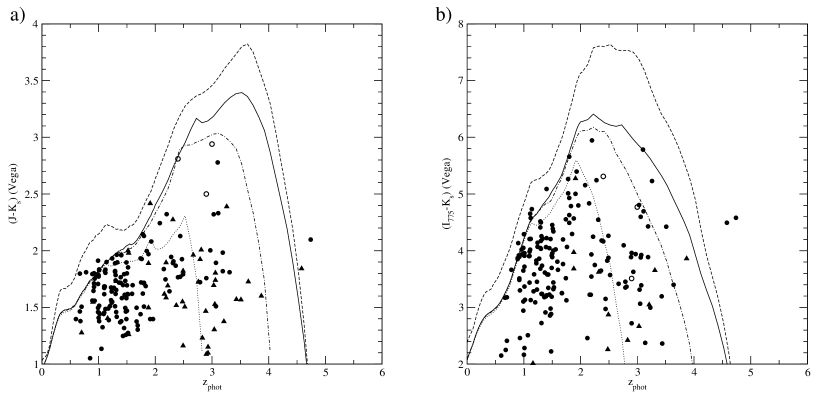
The extremely red colours observed in ERGs are due to two coupled factors: age and dust. As our aim is to study which evolutionary model produces the reddest colours observed in the ERGs, we need to correct for the dust effects in order to separate the contribution to the red colours of the evolved stellar populations. Figures 6-a) and 6-b) show the dust-corrected and colours, respectively, as a function of redshift. We computed the dust-corrections for the colours subtracting from each magnitude the corresponding extinction value given by eq. (2). The symbol labels in both plots of fig. 6 are equivalent to those in fig. 5. We used the public code ‘GALAXEV’ (Bruzual and Charlot 2003) to compute the expected and colours of different kinds of dust-free passively evolving galaxies, in order to obtain a suitable model for the red envelope delimited by the ERG largest colours. We found that an instantaneous starburst at redshift with passive evolution thereafter and solar metallicity (solid lines in fig.6) models quite well the dust-corrected red envelope. A similar starburst formed at redshift , but with a higher metallicity (dashed line), has been added for comparison. The plots in fig. 6 show that solar metallicity is sufficient to explain the reddest colours observed. Even the few apparent outliers at redshift can be explained by such a model once the error bars are taken into account, which are for these objects. On the other hand, the modelling of the expected colours for starbursts at different redshifts allows us to investigate the epoch since when the ERGs lying at redshifts have been following passive evolution. The dotted and dashed-dotted lines in fig. 6 correspond to the modelled colours for starbursts at redshifts and , respectively (both with passive evolution thereafter and solar metallicity ). We see that the reddest ERGs lying at redshifts have been passively evolving since redshift . This does not necessarily mean that these objects have been formed in these epochs, but corresponds to the formation redshifts of the youngest stellar population present in them.
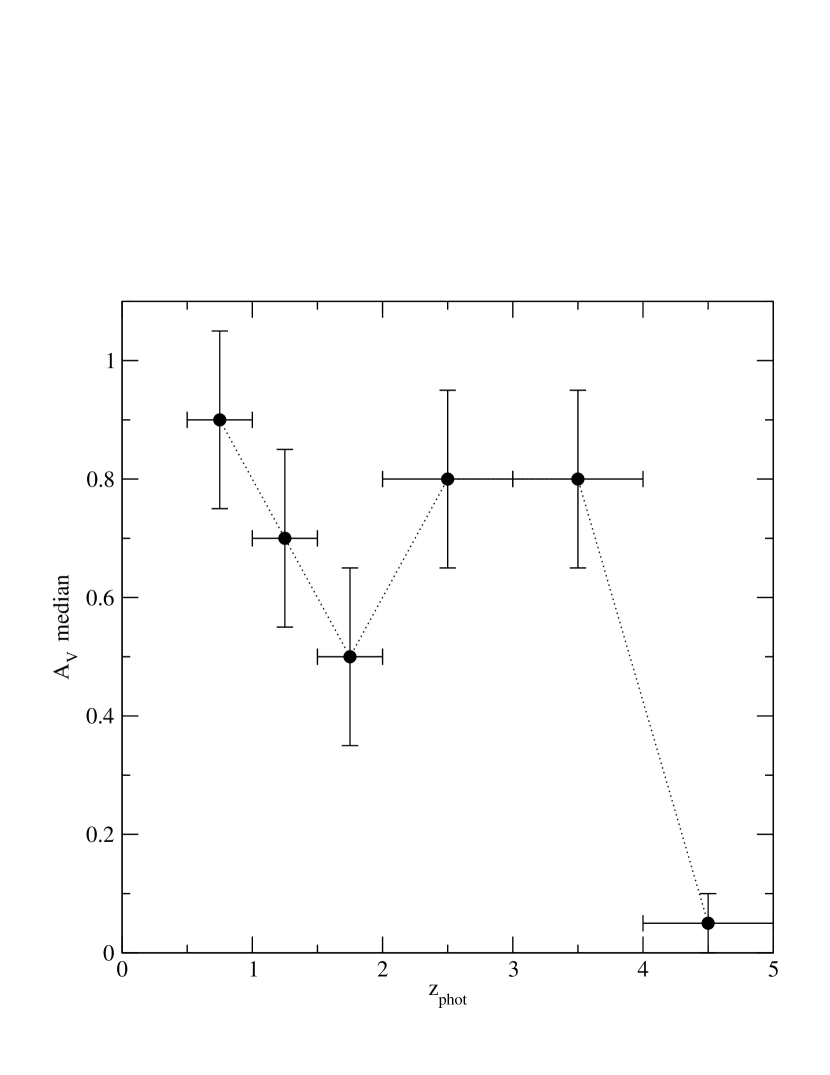
The comparison of fig. 5 and fig. 6 provides a simple and useful way to understand the extent to which the presence of dust is responsible for the original extremely red colours of ERGs. This fact is summarised in fig. 7, where we show the median of the V-band extinction values necessary to deredden the ERG best-fit SEDs at different redshifts. We see that considerable median extinction values () are necessary to explain the red colours observed in ERGs up to redshift . For objects below redshift , the modelled values are very large, illustrating that only extremely dusty starbursts can classify as ERGs at relatively low redshifts. The median of the extinction is lower at redshifts , where perhaps the essentially non-dusty evolved stellar populations are expected to make the most of their contribution. At redshifts , where according to fig. 6 most of the objects seem to have experienced recent starbursts, the median of the extinction increases again. For objects beyond redshift , nearly no extinction is required indicating that, at this stage, the extremely red colours are mainly due to the shift of the Lyman break to optical wavelengths rather than dust.
4.4 The evolving luminosity function of ERGs
Figures 8 and 9 show the luminosity function (LF) of the ERGs in Roche et al. sample in different redshift intervals. We assigned to each object the -band k-corrected absolute magnitude () obtained as part of the ‘hyperz’ output. We considered ‘hyperz’ primary solutions for binning the data in redshift space. We computed the comoving densities per absolute magnitude bin by dividing the number of sources in each bin by the corresponding comoving volume. To take into account the limits of the survey (), we corrected the contribution of each source by a weighting factor , where is the volume determined by the maximum redshift of the bin and is the volume corresponding to the maximum redshift at which the source would still be included in the survey (provided it is lower than the maximum redshift of the bin). We also applied a correction factor to account for a slight incompleteness of the sample at .
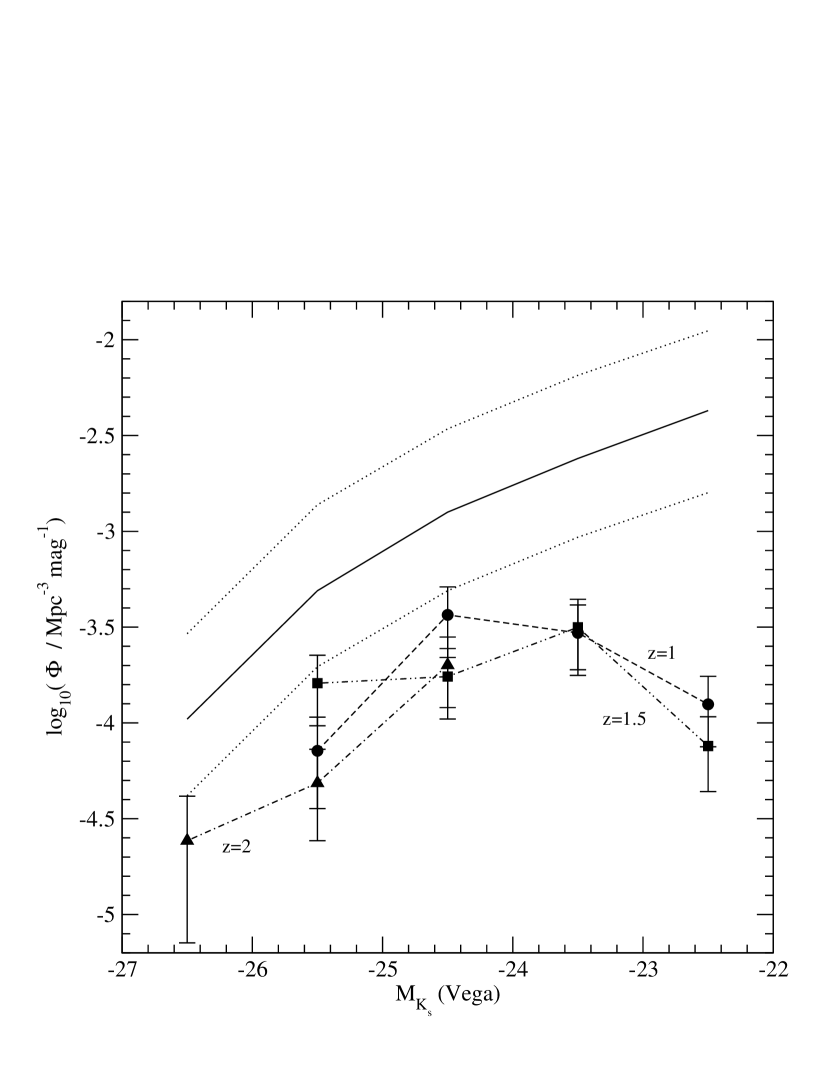
Fig. 8 shows the ERG LF at redshifts , and , indicated by circles, squares and up-triangles, respectively. The error bars correspond to the maximum of the Poissonian errors and the errors due to cosmic variance, which we take on average as 40% in the number counts at these redshifts (cf. Somerville et al. 2003). The inclusion of the cosmic variance is fundamental for highly-clustered populations, as ERGs at redshifts are known to be. The global -band LF at redshifts has been added for comparison. The solid line represents the average -band LF of the HDFS and HDFN, obtained by integrating in each absolute magnitude bin the best Schechter function fitted by Bolzonella, Pelló & Maccagni (2002) for datasets in these fields up to a limiting magnitude of . The dotted lines indicate the largest error bars in the normalisation parameter , corresponding to the fitting of the HDFS data. As expected, our ERG LF reproduces the shape of the bright end of the global -band LF. The differences at fainter magnitudes are at least in part due to the nature of the ERG colour selection. We find only 3 very luminous galaxies with with estimated redshifts [0.75;2.25], 2 of which have redshifts in the interval [1.75;2.25]. These 2 sources have and . For the absolute magnitude range , we do not observe any evolution in the ERG LF from redshifts to . Any fluctuation in the mean values of the LF in this absolute magnitude bin can be accounted for within the cosmic variance error bars. For absolute magnitudes we do not observe any evolution in the LF from redshifts to . The limits of the survey do not allow us to explore the LF at redshift for such faint objects.
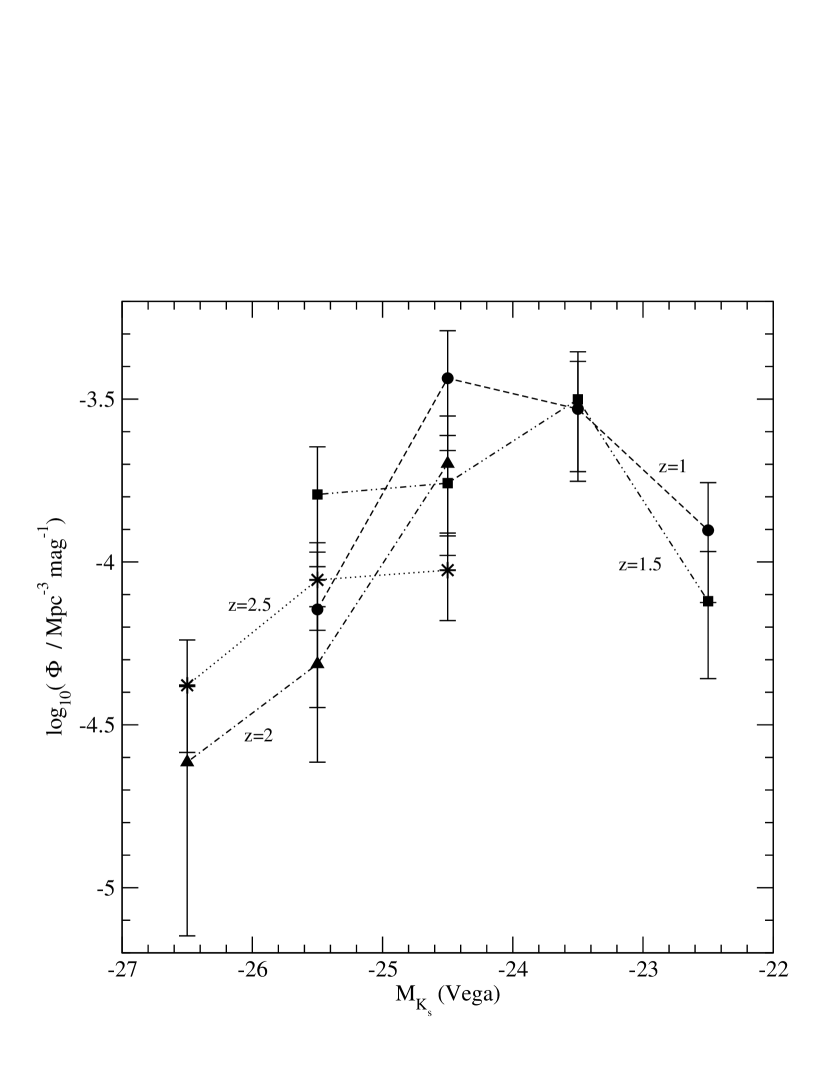
In figure 9, we show again the ERG LF at redshifts and we add the ERG LF at , for comparison. We computed the latter taking into account all the objects in the redshift interval [2.0,3.0]. At these redshifts, we have adopted a slightly lower value for the typical cosmic variance, only 30% in the number of counts on average (Somerville et al. 2003). This plot shows that the bright end of the ERG LF does not decrease significantly from redshifts to . This result confirms the existence of a population of extremely red bright galaxies at high redshifts. We find 7 objects with estimated redshifts in the interval [2.0,3.0] and absolute magnitudes , 6 of which have , placing them among the very reddest objects at these redshifts. Moreover, all of these objects have . In the next section we investigate the change of the absolute magnitudes of ERGs after evolution to redshift and explore the comoving densities of potential progenitors of the local population.
4.5 Comoving densities of massive galaxies
In this section we study the comoving densities of ERGs that will still contribute to the bright end of the -band LF once they evolve down to redshift . If we assume passive evolution for ERGs from the epoch of observation, the maximum dimming of the absolute magnitude can be estimated and, thus, a lower limit to the luminosity each object would have at redshift z=0 obtained. To do this, we need to estimate an evolutionary correction (e-correction) factor at redshift which, when added to the ‘hyperz’ k-corrected absolute magnitude, yields the absolute magnitude the galaxy would have today. The e-correction for each galaxy depends on its spectral type and age. We used the public code ‘GALAXEV’ (Bruzual and Charlot 2003) to compute the absolute magnitudes at redshift of the spectral types corresponding to our ERGs at different ages. The correction applied to each object is the difference in the absolute magnitude the object would have today and at the age it had when its light was emitted. The objects that are considered to be progenitors of the local population are those with -corrected absolute magnitude , given the relationship . In a passive evolution scenario, these ERGs must have contained a minimum stellar mass of when their light was emitted.
Figure 10 shows the comoving densities at different redshifts of the 27 ERGs in Roche et al. sample which are expected to have at redshift under passive evolution (filled circles). We used for h=0.7 (Cole et al. 2001). Once more, we computed the comoving densities dividing the number of sources in each redshift bin by the corresponding comoving volume. We divided the sample in bins of width up to redshift and for redshifts . To compute these comoving densities, we did not use ‘hyperz’ primary solutions but a redshift probability density distribution that we constructed normalising for each source the percentage probabilities given in the ‘hyperz’ output file _log.phot. In this way, each source may contribute in a fraction to different redshift bins. Only sources with ‘hyperz’ primary solutions have been taken into account. We applied a weighting factor of the kind , as it was explained in Section 4.4, to the normalised probability density distribution of each source. However, in each case, the weighting factor has been estimated using only the k-corrected absolute magnitude given by ‘hyperz’ in the output. A more rigurous procedure should take into account a probability density distribution for the absolute magnitudes in correspondence with the probability density distribution for redshifts. We also corrected for the incompleteness of the sample. The error bars for the comoving densities correspond to Poissonian errors in the number of sources, which are dominant in this case. We added for comparison the comoving density of the local population (star-like symbol), which we computed as the average of the values obtained integrating the local -band LFs fitted by Cole et al. (2001) and Kochanek et al. (2001).
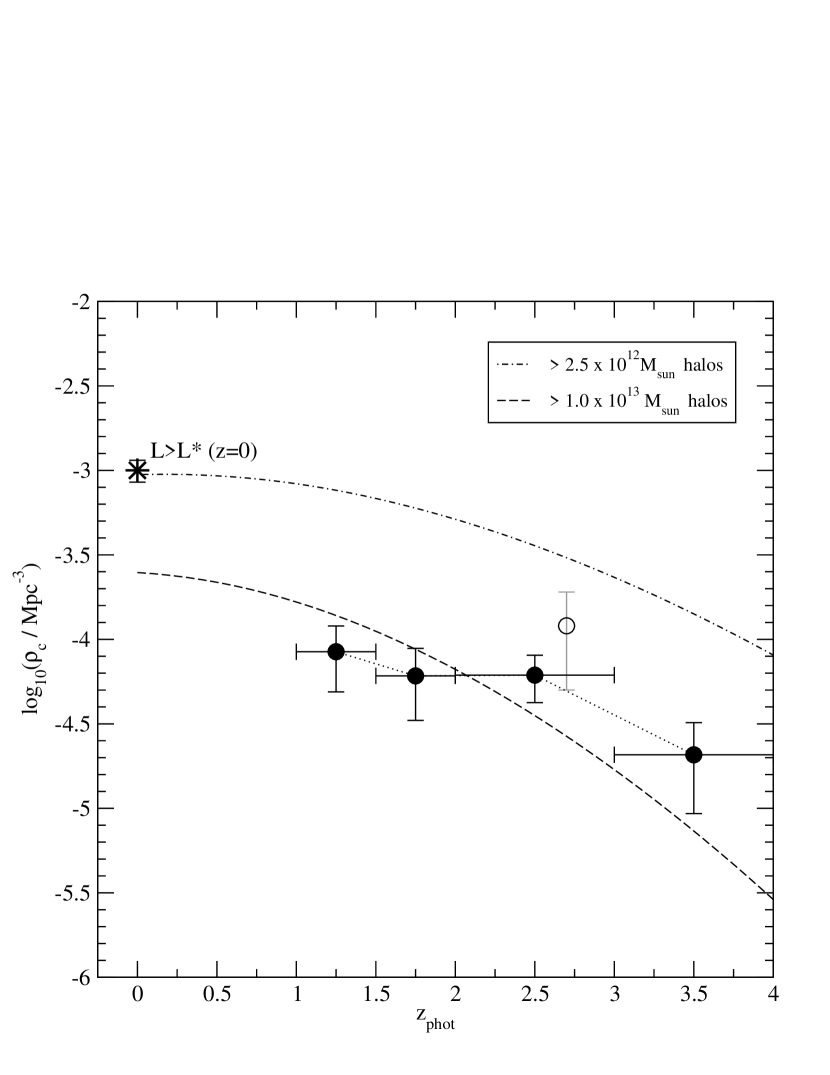
Our results show that there is no significant change in the comoving densities of ERG progenitors of galaxies between redshifts and , which is consistent with the results presented in Section 4.3 for the bright end of the LF. Actually, all the galaxies with in Section 4.3 are included in the progenitors of subsample. The values we obtain for the comoving densities are: for , for , for and for . It is important to note that the relatively small comoving densities at and (more than 10 times smaller than the corresponding value we adopted for local galaxies) could in part be due to the ERG colour cutoff. If this is the case, we should conclude that the ERGs at redshifts cannot account for the whole population of progenitors of the local massive galaxies. Although the ERGs reproduce quite well the shape of the bright end of the global -band LF, the values are lower, indicating that larger comoving densities of massive objects are expected to be obtained in a -selected sample without a colour selection. Thus, the conclusion of a constant comoving density of massive objects from redshifts and is in principle only applicable to ERGs, and may of course not hold for a general -selected sample. The mean value we obtain for the lower limit to the comoving density of progenitors at is only one half of the mean value obtained by Saracco et al. (2004) at a similar redshift (open circle in fig. 10), but there is no significant discrepancy between the results given the large error bars. We conclude that Saracco et al. large mean comoving density might be due to a simple cosmic variance effect and much larger samples of -selected galaxies are necessary to establish a robust estimate of the fraction of the stellar mass already assembled in ERGs at these redshifts. 222Saracco et al. claim to reproduce about of the comoving density of the local massive galaxies, after comparison with the local comoving density of early-type galaxies obtained from the LF fitted by Marzke et al. (1998) using B-band data. Instead, we prefer to compare the comoving densities with the local values obtained integrating more recent LFs directly fitted on K-band data (Cole et al. 2001, Kochanek et al. 2001).
In fig. 10 we show the comoving densities of dark matter halos with masses (dashed lines) at different redshifts, as they are predicted by models of structure formation (Kauffmann & Charlot 1998, Somerville & Primack 1999). We also show the comoving densities of dark matter halos with masses (dashed-dotted lines), a mass threshold deliberately selected to coincide with the comoving densities of galaxies at . At any redshift, our comoving densities of progenitors of local massive galaxies are lower than the corresponding comoving densities of dark matter halos massive enough to host these galaxies. For instance, the comoving densities of halos decreases less than a factor from redshifts to , while the comoving densities of ERGs progenitors of local massive galaxies are more than 5 times below this value. This leads to two extreme interpretations: i) even taking into account the possible production of mergers (i.e. the increasing comoving densities of dark matter halos more massive than a given mass threshold with time), ERGs do not seem to be sufficient to account for all the progenitors of local galaxies. This would reinforce the idea that the ERG colour cutoff must be at least partially responsible for this deficiency, which appears to be more important at lower () than higher () redshifts. ii) ERGs do account for the progenitors of local massive galaxies but the passive evolution scenario is not completely valid. Galaxies which are not sufficiently massive at a given redshift might build up more stellar mass at later epochs and, thus, should also be considered as progenitors of the local galaxy population. The massive ERGs at could instead be progenitors of much more massive () local galaxies, in which case our results show that all of them are already in place at redshift .
Interestingly, the progenitors of galaxies are among the reddest ERGs. At different redshifts, these massive galaxies in the Roche et al. sample have . The mean colours increase with redshift, as it is expected when the 4000 break enters the region between the J and filters. In all cases, . Some of these massive galaxies are among the reddest objects in at redshifts , due to the combined effects of the break and considerable amounts of dust (we find V-band extinction values of up to for these massive objects). The characteristics of these sources are consistent with the ‘hyper extremely red object’ population discovered by Totani et al. (2001). However, not all the reddest objects evolve to sources in a passive evolution scenario. In some cases, the extremely red colours are almost exclusively due to very large dust extinctions. Recently, some extremely red sources have been found to be counterparts of sub-millimetre sources, which are known to be mainly located at redshifts (Dunlop 2001, Aretxaga et al. 2003, Chapman et al. 2003). However it is not yet clear whether the ERGs associated with sub-millimetre sources are primarily high or low mass objects (Frayer et al. 2004).
4.6 Sources beyond redshift - the ERG - Lyman-break connection
In this section we focus on the properties of the Lyman break galaxies in the GOODS/CDFS included in the Roche et al. ERG sample. These objects could be candidates for massive galaxies at very high redshift. Here we summarise the detailed properties of the individual objects and discuss the probability that they are genuinely located at such high redshifts.
Several studies have already been published on the selection of very high redshift candidate sources in the GOODS fields (Stanway, Bunker & McMahon 2003; Bouwens et al. 2003; Bremer et al. 2004; Dickinson et al. 2004). In most of these studies a colour cutoff selection technique has been applied (usually ) to select candidates at redshifts . We find 9 of these candidate sources in the Roche et al. ERG sample. However, we cannot confirm any of these sources as being at very high redshift. We argue that the fraction of low-mass star and lower-redshift ERG contaminants is usually under-estimated when a single-colour selection criterion is applied. Multicolour photometry appears to be a much more powerful way to obtain reliable candidate lists of very high redshift objects, and allows the investigation of degerate solutions in redshift space.
Using 5-epoch GOODS HST-ACS (V1.0) and VLT-ISAAC data, we obtained an initial ‘hyperz’ output list containing 12 sources with a primary solution at , which adopted as candidates for detailed inspection. We present the properties of the complete list of 12 candidate sources in Table 1. We used the public code BPZ (Benítez 2000) to obtain estimated redshifts for these objects in an independent way. We also made an individual study of each of our 12 candidate sources, inspecting their ACS images and analysing their magnitudes and colours in different bands. After a first analysis, we rejected the following 7/12 candidates for the reasons explained below:
-
•
e114-e566-e967-e2386 : these sources appear to be at redshifts from ‘hyperz’ and all of them have . Only e566 is not confirmed by the BPZ code as a very high redshift source (it is estimated to be at redshift ). However, the probabilities associated with the ‘hyperz’ primary solutions, obtained from the minimisation, are very low () in all cases. e967 corresponds to source number 4 in Stanway et al. list and source number 8 in the list of Bremer et al. e114 and e2386 are sources number 13 and 9 in the Bremer et al. list, respectively. These sources are unresolved on ACS images and have quite blue near-IR colours, (Vega) in all cases. e967 and e2386 are significant detections in the V-band ( and , AB, respectively) and e566, in the B-band (, AB). Thus, it is more likely that they are cool stars than high redshift galaxies. Indeed, e967 has been spectroscopically confirmed as such (cf. Dickinson et al. 2004). These cool stars are known to be among the main contaminants of very high redshift candidates.
-
•
e1504: this source has ‘hyperz’ primary solution , but actually has a probability at any redshift between 0 and 10. The BPZ code gives an estimated redshift of for this source. Besides, although it is not detected in the V-band 333even when its flux is manually measured with the IRAF task ‘phot’, it is a significant detection in the B-band (, AB). This source corresponds to object number 9 in the Stanway et al. list.
-
•
e1605: this source has ‘hyperz’ primary solution (with an associated probability ), but the BPZ code gives . This source is not detected on the z-band images, but it could have some flux in the -band (). Its very red near-IR colour, i.e. (Vega), suggests that the estimated redshift from the BPZ code is more reliable in this case.
-
•
e2006: this source has two ‘hyperz’ solutions with similar probabilities. The primary solution is and the secondary one is . The BPZ estimation is . We measured for this object and we do not find it is significantly detected in either the B or V bands. However, the higher redshift solution would imply it is an extremely bright galaxy with a k-corrected absolute magnitude and estimated mass , so we consider that in this case the ‘hyperz’ secondary solution is more likely to be the right answer.
| ERG id | RA(J2000) | DEC(J2000) | hyperz | BPZ | accepted? | COMMENTS |
|---|---|---|---|---|---|---|
| 114 | 3:32:22.46 | -27:50:47.16 | 5.60 | 5.75 | N | Unresolved. |
| 566 | 3:32:24.78 | -27:49:12.91 | 6.69 | 1.28 | N | Unresolved. . |
| 967 | 3:32:18.17 | -27:47:46.48 | 5.39 | 5.70 | N | Spectroscopically confirmed star. |
| 1504 | 3:32:18.17 | -27:46:16.33 | 4.63 | 1.44 | N | |
| 1605 | 3:32:19.67 | -27:46:02.04 | 6.71 | 2.84 | N | . Not detected in z band. |
| 2386 | 3:32:19.23 | -27:45:45.39 | 5.33 | 5.56 | N | Unresolved. |
| 2006 | 3:32:28.81 | -27:44:30.54 | 6.21 | 6.37 | N | Significant secondary solution |
| 778 | 3:32:41.76 | -27:48:24.92 | 4.74 | 5.42 | N | Revised UDF photometry implies |
| 1113 | 3:32:34.65 | -27:47:20.89 | 5.07 | 1.05 | N | Revised UDF photometry implies |
| 1272 | 3:32:41.69 | -27:46:55.40 | 5.03 | 5.48 | N | Revised UDF photometry implies |
| 491 | 3:32:25.95 | -27:49:30.38 | 4.58 | 5.22 | Y | No significant ‘hyperz’ secondary solutions. |
| 1703 | 3:32:37:74 | -27:45:05.41 | 4.74 | 5.38 | Y | No significant ‘hyperz’ secondary solutions. |
3/12 high-z candidate ERGs lie in the Hubble UDF, which images have been recently made publicly available. After revision of the photometry on the HST-ACS and HST-NICMOS ultra-deep optical and near-IR images, we reject also these 3/12 high-z candidates:
-
•
e778: using 5-epoch GOODS HST-ACS (V1.0) and VLT-ISAAC data, the ‘hyperz’ primary solution for this source is (with an associated probability ). The BPZ redshift estimation is . However, after revision of the photometry on the Hubble UDF images, this source appears to be a significant detection in the B-band. The revised ‘hyperz’ primary solution is .
-
•
e1113: this source initially had a ‘hyperz’ primary solution () and secondary solution (). The BPZ code favoured a low redshift solution . We did not detect this source in either the B or V bands on the GOODS V1.0 images. However, it is a clear detection in both the B and V bands on the Hubble UDF images. The revised ‘hyperz’ primary solution is . This source corresponds to object number 2 in Stanway et al. list.
-
•
e1272: this source initially had a ‘hyperz’ primary solution ( ) and no significant secondary solution. The BPZ estimation was . It was not a significant detection in either the B or V bands on the GOODS V1.0 images, but it is on the Hubble UDF maps. The revised ‘hyperz’ primary solution is .
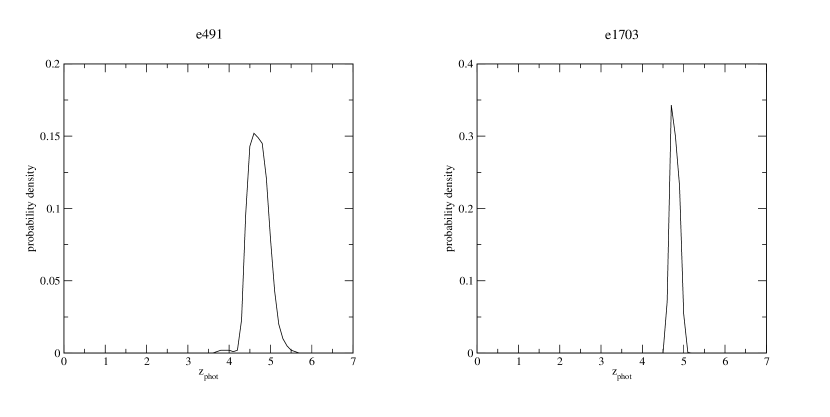
We accept the remaining 2/12 as candidates, whose redshift probability density distributions we show in fig. 11:
-
•
e491: ‘hyperz’ primary solution is (with an associated probability ). The BPZ code estimates a redshift of . There are no significant secondary solutions for the redshift of this source in ‘hyperz’. The -band k-corrected absolute magnitude for this galaxy is and we estimate a mass of . This object has and it is not detected in either the B or V bands.
-
•
e1703: this source has a ‘hyperz’ primary solution ( ) and no significant secondary solution. The BPZ redshift is . The estimated -band k-corrected absolute magnitude for this source is and the estimated mass is . It has and it is not detected in either the B or V bands.
Finally, we list other ERGs in the Roche et al. sample which are among the very-high redshift candidates selected by other authors, and for which we obtain lower redshift estimates:
| ERG id | Author | Author’s id | ‘hyperz’ |
|---|---|---|---|
| 82 | Bremer et al. | 7 | 1.40 |
| 309 | Bremer et al. | 6 | 2.32 |
| 225 | Dickinson et al. | SiD013 | 1.74 |
| 1423 | Bremer et al. | 2 | 1.60 |
From the sources listed above, only e309 has a very-high-redshift secondary solution, although with negligible significance, at .
To summarise, we conclude that, within the limits of our survey, only a few ERGs are likely to be at very high redshifts. Deeper near-IR selected samples of galaxies are necessary to confirm or refute the rarity of massive objects assembled at very early epochs.
4.7 Review of the ERG cluster candidate at redshift
Roche et al. (2003) found 10 ERGs within a radius of the Chandra source XID:58 (RA=3:32:11.85, DEC=-27:46:29.14, J2000), which is itself a counterpart of the ERG identified as e1435 in Roche et al. list. This overdensity suggested the presence of an ERG cluster at redshift , based on the photometric redshift of the Chandra source XID:58, estimated as by Mainieri (2003). Based on the source colours, Roche et al. argued that 7/9 of the ERGs around XID:58 (e1435) could be part of that cluster. In the following table, we present our redshift estimates (both primary and secondary) for e1435 and the 7 surrounding sources that could be associated with it.
| ERG id | (primary) | (sec.) |
|---|---|---|
| 1333 | 3.10 | 1.78 |
| 1341 | 1.52 | 1.01 |
| 1390 | 1.29 | 1.67 |
| 1404 | 1.52 | 1.78 |
| 1423 | 1.60 | 1.34 |
| 1435 (XID:58) | 1.85 | 1.30 |
| 1464 | 3.19 | 1.48 |
| 1481 | 1.30 | 1.01 |
Our estimated redshifts seem to confirm the presence of a cluster at redshift . However, it is not clear whether all the sources listed above belong to it. e1333 and e1464 seem to be higher redshift sources, although the ‘hyperz’ secondary solution might locate e1464 at redshift . For e1435 (counterpart of XID:58) we estimate a redshift , a value somewhat higher than Mainieri’s estimation. Our secondary solution, on the contrary, is closer to their value. The sources which seem to be part of a cluster at redshift are e1341, e1404, e1423 and e1481.
Roche et al. also suggested that the 2/9 remaining ERGs around XID:58 could be associated with another X-ray source (Chandra XID:149), which is spectroscopically confirmed to be at redshift (Szokoly et al. 2003). Our estimated redshifts for these 2 remaining ERGs are:
| ERG id | (primary) | (sec.) |
|---|---|---|
| 1311 | 1.05 | 0.61 |
| 1467 | 1.07 | 5.24 |
The ‘hyperz’ primary solutions seem to confirm that these 2 ERGs are actually associated with the X-ray source XID:149.
5 Summary and conclusions
In this paper we have presented estimated redshifts for the Extremely Red Galaxies selected by Roche et al. (2003) in the 50.4 arcmin2 of the GOODS/CDFS deep ISAAC field to a limiting magnitude . This is the deepest significant sample of ERGs selected to date and constitutes a complement to other shallower but wider surveys of ERGs in the same field (Moustakas et al. 2004).
We have used multicolour photometry in seven passbands (B,V, , z, J, H and ) to compute photometric redshifts using the public code ‘hyperz’. The B,V, and z magnitudes have been measured on the stacked 5-epoch GOODS ACS images (V1.0 data release). We have obtained the redshift distribution and the corresponding Hubble diagram (), which show the existence of ERGs up to redshifts at this depth. The ERG population is characterised by a large dispersion in the relation. We find that this dispersion is even more important in the dust-corrected Hubble diagram, indicating that the ERG populaton is composed of objects spanning a wide range in mass. We estimate that the ERGs in Roche et al. sample span two decades in mass, from to .
We have studied the red envelope of galaxy evolution, determining the galaxy template which best describes the ERG dust-corrected reddest colours observed in the Roche et al. sample as a function of redshift. We find that a starburst formed at redshift with passive evolution thereafter and solar metallicity provides a very good description of the red envelope of ERG evolution for objects selected with . Our work indicates that the simplified traditional picture for ERGs as either old elliptical galaxies or young dusty starbursts can no longer be sustained. The colours of many of the reddest ERGs can only be explained by the combined effects of evolved stellar populations and dust.
We have also explored the evolution of the ERG luminosity function from redshifts to . The ERG LF at redshifts reproduces the shape of the bright end of the global -band LF, as perhaps expected. We find no evolution in the bright end of the LF of ERGs from redshifts to () and from redshift to (). This effect cannot be deduced from inspection of the Hubble diagram for ERGs, constructed using the raw magnitudes. Only after the application of dust corrections are some ERGs revealed as bright and massive galaxies.
One of the main goals in the selection of ERG samples is to trace the progenitors of very luminous local galaxies (). Only a small fraction () of the ERGs in the Roche et al. sample can evolve into such luminous galaxies under passive evolution. At redshifts , we find that the comoving density of ERGs progenitors of massive galaxies is less than of the local value. Between redshifts and , models only predict a decrease in the comoving densities of dark matter halos massive enough as to host local galaxies by a factor 1.5-2. This suggests that either ERGs cannot account for the whole population of local massive galaxies or the passive evolution scenario is not completely valid. This deficiency appears as being more dramatic at lower () than higher () redshifts, suggesting that ERGs could be rather better tracing the progenitors of local massive galaxies present at early epochs.
Finally, we have investigated the existence of Lyman break galaxies massive enough to be included in an ERG sample. Out of an initial candidate list of 12 sources, we only confirm 2 ERGs as having high probabilities of being located at redshifts . Deep observations in wider areas are crucial in order to constrain lower limits on the fraction of massive galaxies with the bulk of their stellar mass already assembled at very high redshifts.
Several open questions still remain for the ERG population in the GOODS/CDFS field. An important issue is to understand how ERG morphology changes with redshift, a problem we plan to study in a future paper. Also, very deep spectroscopic observations scheduled with the Gemini Multiobject Spectrograph (GMOS) will provide more accurate redshifts for a subset of the ERGs in the Roche et al. sample, allowing a detailed study of their properties.
Acknowledgements
This paper is based on observations made with the Advanced Camera for Surveys and the Near Infrared Camera and Multi Object Spectrometer on board the Hubble Space Telescope operated by NASA/ESA and with the Infrared Spectrometer and Array Camera on the ‘Antu’ Very Large Telescope operated by the European Southern Observatory in Cerro Paranal, Chile, and form part of the publicly available GOODS datasets. We thank the GOODS teams for providing reduced data products. We thank Will Percival for providing us a code to compute comoving densities of dark matter halos. We also thank the referee, Tomonori Totani, for his suggestions and comments, which enriched the discussion of results in this paper.
KIC aknowledges funding from a POE-network studentship and the Overseas Research Scheme Award (ORS/2001014037). JSD, RJM and NDR acknowledge PPARC funding.
References
Aretxaga I., Hughes D. H., Chapin E. L., Gaztañaga E., Dunlop J. S., Ivison R. J., 2003, MNRAS, 342, 759
Benítez N., 2000, ApJ, 536, 571
Bertin E., Arnouts S., 1996, A&A, 117, 393
Bolzonella M., Miralles J.-M., Pelló R., 2000, A&A, 363, 476
Bolzonella M., Pelló R., Maccagni D., 2002, A&A, 395, 443
Bouwens R. J., Illingworth G. D., Rosati P., Lidman C. et al., 2003, ApJ, 595, 589 (astro-ph/0306215)
Bremer M.N., Lenhert M.D., Waddington I., Hardcastle M.J., Boyce P.J., Phillipps S., 2004, MNRAS, 346, L7 (astro-ph/0306587)
Bruzual A. G., Charlot S., 1993, ApJ, 405, 538
Bruzual G., Charlot S., 2003, MNRAS, 344, 1000
Calzetti D., Armus L., Bohlin R. C., Kinney A. L., Koornneef J., Storchi-Bergmann T., 2000, ApJ, 533, 682
Chapman S. C., Blain A. W., Ivison R. J., Smail I. R., 2003, Nature, 422, 695
Charlot S., Fall S. M., 2000, ApJ, 539, 718
Cimatti A., Andreani P., Röttgering H., Tilanus R., 1998, Nature, 392, 895
Cimatti A., Daddi E., Mignoli M., Pozzetti L. et al., 2002, A&A, 381, L68
Cole S., Norberg P., Baugh C. M., Frenk C. S. et al., 2001, MNRAS, 326, 255
Dey A., Graham J. R., Ivison R. J., Smail I., Wright G. S., Liu M. C., 1999, ApJ, 519, 610
Dickinson M., Giavalisco M., The GOODS Team, 2003, in: The Mass of Galaxies at Low and High Redshift, ESO Astrophysics Symposia, p. 324, eds. Bender R. & Renzini A., Springer.
Dickinson M., Stern D., Giavalisco M., Ferguson H. C. et al., 2004, ApJ, 600, L99 (astro-ph/0309070)
Dunlop J., Peacock J., Spinrad H., Dey A., Jiménez R., Stern D., Windhorst R., 1996, Nature, 381, 581
Dunlop J.S., 2001, in van Bemmel I.M., Wilkes B., Barthel P., ed., FIRSED2000, New Astronomy Reviews, 45, Elsevier, p.609
Elston R., Rieke G.H., Rieke M.J., 1988, ApJ, 331,77
Frayer D.T., Reddy N. A., Armus L., Blain A.W., Scoville N. Z., Smail I., 2004, AJ, 127, 728 (astro-ph/0310656)
Kauffmann G., Charlot S., 1998, MNRAS, 297, L23
Kochanek C.S. et al., 2001, ApJ, 560, 566
Maihara T., Iwamuro F., Tanabe H., Taguchi T. et al., 2001, PASJ, 53, 25
Mainieri V., 2003, PhD thesis, Univ. Roma Tre
Marzke R.O., da Costa L.N., Pellegrini P.S., Willmer C.N.A., Geller M.J., 1998, ApJ, 503, 617
Miyazaki M. et al., 2003, PASJ, 55, 1079
Moustakas L., Casertano S., Conselice C., Dickinson M. E. et al., 2004, ApJ, 600, L131 (astro-ph/0309187)
Roche N. D., Dunlop J., Almaini O., 2003, MNRAS, 346, 803 (astro-ph/0303206)
Saracco P., Giallongo E., Cristiani S., D’Odorico S., Fontana A., Iovino A., Poli F., Vanzella E., 2001, A&A, 375, 1
Saracco P., Longhetti M., Severgnini P., Della Ceca R., Mannucci F., Bender R., Drory N., Feulner G., Ghinassi F., Hopp U., Maraston C., 2003, A&A, 398, 127
Saracco P. et al. 2004, A&A, 420, 125 (astro-ph/0310131)
Smail I., Owen F. N., Morrison G. E., Keel W. C., Ivison R. J., Ledlow M. J., 2002, ApJ, 581, 844
Soifer B.T., Matthews K., Neugebauer G., Armus L., Cohen J.G., Persson S.E., Smail I., 1999, AJ, 118, 2065
Somerville R. S., Primack J. R., 1999, MNRAS, 310, 1087
Somerville R. S., Lee K., Ferguson H. C., Gardner J. P., Moustakas L. A., Giavalisco M., 2004, ApJ, 600, L171 (astro-ph/0309071)
Stanway E. R., Bunker A. J., McMahon R. G., 2003, MNRAS, 342, 439 (astro-ph/0302212)
Szokoly G. P., Bergeron J., Hasinger G., Lehmann I. et al., 2003, submitted to ApJ supplement (astro-ph/0312324)
Totani T., Yoshii Y., Iwamuro F., Maihara T., Motohara K., 2001, ApJ, 558, L87
Wehner E. H., Barger A. J., Kneib J.-P., 2002, ApJ, 577, L83
Willott C. J., Rawlings S., Jarvis M. J., Blundell K. M., 2003, MNRAS, 339, 173
Yan L., Thompson D., 2003, ApJ, 586, 765