An XMM-Newton observation of the Seyfert 1 galaxy 1H 0419-577 in an extreme low state
Abstract
Previous observations of the luminous Seyfert 1 galaxy 1H 0419-577 have found its X-ray spectrum to range from that of a typical Seyfert 1 with 2–10 keV power law index 1.9 to a much flatter power law of 1.5 or less. We report here a new XMM-Newton observation which allows the low state spectrum to be studied in much greater detail than hitherto. We find a very hard spectrum (1.0), which exhibits broad features that can be modelled with the addition of an extreme relativistic Fe K emission line or with partial covering of the underlying continuum by a substantial column density of near-neutral gas. Both the EPIC and RGS data show evidence for strong line emission of OVII and OVIII requiring an extended region of low density photoionised gas in 1H 0419-577. Comparison with an earlier XMM-Newton observation when 1H 0419-577 was ‘X-ray bright’ indicates the dominant spectral variability occurs via a steep power law component.
1 Introduction
1H 0419-577 (also known as LB 1727) is a radio-quiet (8.4 GHz flux 3 mJy; Brissenden et al.1987) Seyfert galaxy at a redshift z = 0.104 and one of the brightest AGN in the extreme ultra-violet, being detected by both the ROSAT Wide Field Camera (Pye et al. 1995) and EUVE (Marshall et al. 1995). Optical spectra from the AAT (Turner et al. 1999) and ESO (Guainazzi et al. 1998) showed 1H 0419-577 to be a typical broad line Seyfert 1 with a strong ‘Big Blue Bump’.
1H 0419-577 was observed by XMM-Newton in December 2000, for 8 ksec, although a command error meant X-ray data were restricted to the EPIC pn-camera. Analysis of the X-ray spectrum found a high 2–10 keV luminosity of erg s-1, with a ‘canonical’ Seyfert 1 power law continuum of , together with a strong soft X-ray excess (Page et al. 2002). However, simultaneous ROSAT HRI and ASCA (Turner et al. 1999) and BeppoSAX (Guainazzi et al. 1998) observations of 1H 0419-577 four years earlier had found an unusually hard spectrum for a Seyfert 1 galaxy, with 1.4, and only a very weak ‘soft excess’. A still earlier ROSAT observation of 1H 0419-577 , in 1992, showed the source had once more been in a high/soft state (Guainazzi et al. 1998). 1H 0419-577 therefore appears to exhibit unusually large spectral variability, with a factor-of-10 change in soft X-ray flux and variations in power law index by , over several years or less. In this respect, 1H 0419-577 is similar to Galactic black hole sources, which frequently vary between low/hard and high/soft states (see Zycki et al. 2001 for a review). Although the spectral changes in 1H 0419-577 are not quite so extreme, the unusually large variability makes it a particularly interesting probe of the accretion-driven processes that make AGN characteristically powerful X-ray emitters.
The impression from the published observations of 1H 0419-577 is that the soft X-ray flux shows the most dramatic changes, much greater than the integrated hard X-ray flux, suggesting the spectral change is driven by the thermal disc emission. In the framework of the widely accepted disc/corona model (Haardt and Maraschi 1991), where thermal photons from the accretion disc are Compton scattered by high energy electrons to form the observed X-ray power law, an enhanced disc emission should cool the electrons and lead to a steeper power law. Structural changes in the scattering corona may also be required by the observed power law slope change of , with the additional constraint that the total 2-10 keV luminosity increased by only 20 percent over the same 1996-2000 period (Page et al. 2002).
In considering changes in the structure of the disc, one possibility is that the low/hard state corresponds to a truncated inner disc, or ADAF flow (which would lead to reduced reflection, no broad Fe K line, and a weaker coupling between the disc and the corona). In that simple picture a hot, ‘photon-starved’ corona could evolve to a high/soft state when a higher accretion rate extended the disc boundary inward, with enhanced thermal emission, a steeper power law and broad Fe K line. That might describe the change occurring in 1H 0419-577 between 1996 and 2000 (though the sensitivity of none of the contemporary observations was sufficient to usefully constrain the Fe-K emission line; Guainazzi et al. 1998,Turner et al. 1999, Page et al.2002).
To improve the X-ray data on 1H 0419-577 a new series of 6 XMM-Newton observations, at approximately 3-monthly intervals over the period September 2002 to November 2003, was recently completed. The first of those new observations, when 1H 0419-577 was found to be extremely faint, is reported in the present paper.
2 Observations
The first XMM-Newton observation of 1H 0419-577 in the new series took place on 5 September 2002 (orbit 512) yielding a useful exposure of 14.9 ksec. Five further observations of similar length were successfully carried out over the following 15 months and will be reported later. The present paper describes the results from the first new observation, which are of particular interest given the extremely low flux-state in which 1H 0419-577 was found. X-ray data were available throughout the observation from the EPIC pn (Strüder et al.2001) and MOS (Turner et al. 2001) cameras, and the Reflection Grating Spectrometer/RGS (den Herder et al. 2001). In addition the Optical Monitor (Mason et al. 2001) obtained simultaneous flux measurements in V,B,U and 2 ultraviolet wavebands.
The X-ray data were first screened with the XMM SAS v5.4 software and events corresponding to patterns 0-4 (single and double pixel events) were selected for the pn data and patterns 0-12 for MOS1 and MOS2, the latter then being combined. A low energy cut of 300 eV was applied to all X-ray data and known hot or bad pixels were removed. Source counts were obtained from a circular region of 45′′ radius centred on 1H 0419-577 , with the background being taken from a similar region offset from, but close to, the source. The X-ray light curve of 1H 0419-577 was essentially flat throughout the observation and the background rate was low. We therefore integrated the total data set for spectral analysis. Individual EPIC spectra were binned to a minimum of 20 counts per bin to facilitate use of the minimalisation technique in spectral fitting. RGS data were initially grouped in sets of 10 spectral bins to aid the detection of weak features. Spectral fitting was based on the Xspec package (Arnaud 1996) and all fits included absorption due to the line-of-sight Galactic column . Errors are quoted at the 90% confidence level ( for one interesting parameter).
3 EPIC spectrum
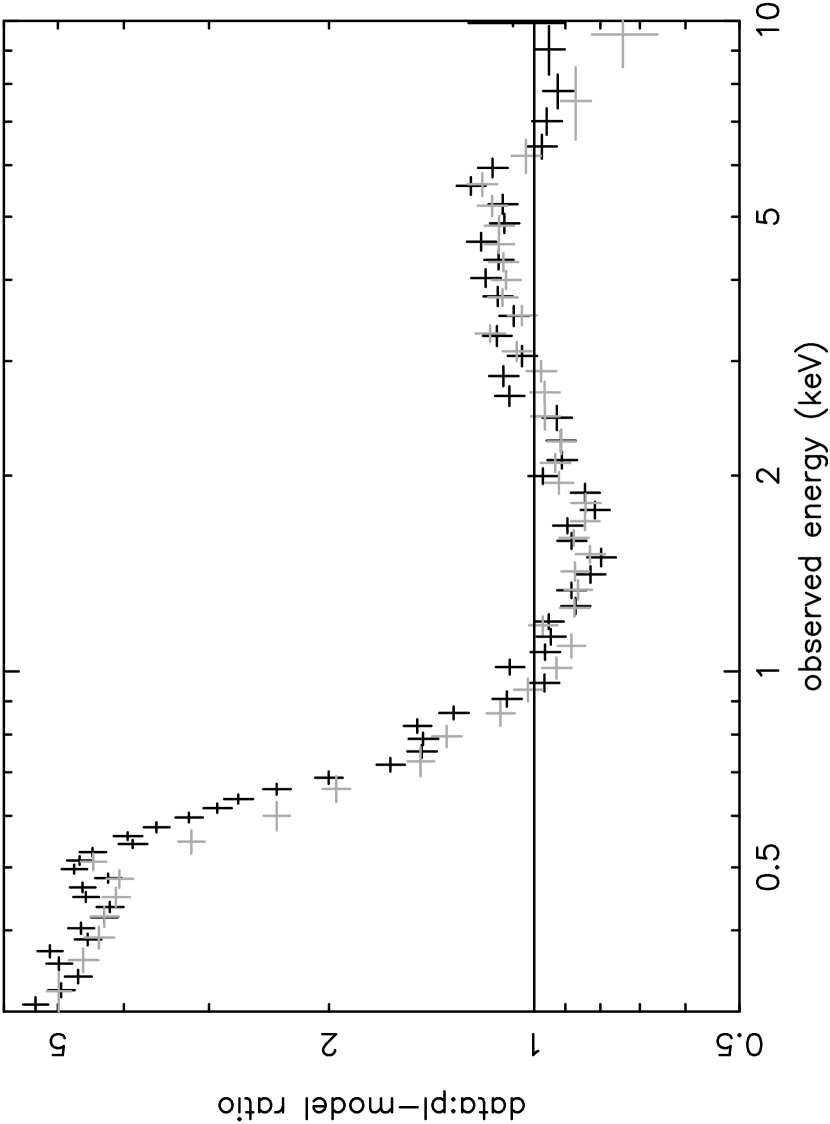
Figure 1 shows the overall shape of the EPIC 0.3–10 keV spectrum, compared with a simple power law fit, with photon index 1.49. In addition to the usual (but more extreme) curvature found in such a fit to Seyfert 1 spectra, sharp features are seen in both pn and MOS data at 0.5 keV and 6 keV. The former feature lies close to the neutral oxygen edge in the instrument response, but also coincides with potentially strong OVII and OVIII emission lines (a possibility we check in Section 4 with the higher resolution RGS data). The high energy spectral feature is suggestive of a strong, relativistically broadened Fe K emission line or a deep Fe K absorption edge. We test those alternatives below.
3.1 2–10 keV spectral fit with a Laor line and continuum reflection
We began our spectral analysis of the EPIC data by fitting a power law over the hard X-ray (2–10 keV) band, hoping thereby to exclude the effects of soft X-ray emission and/or low energy absorption. This fit yielded an extremely flat power law, with photon index of 1.06 (pn) and 1.02 (MOS). Statistically the simple power law fit over the 2–10 keV band was quite good, with of 692 for 626 degrees of freedom (dof). However, the spectral feature below 6 keV is clearly seen in both pn and MOS data (figure 2). The addition of an absorption edge improved the fit ( of 617/622 dof), with an edge energy (in the AGN rest-frame) of 7.100.06 keV (pn) and 7.070.07 keV (MOS). The coincidence of this value with the K-edge of neutral Fe is a clear indicator of strong reflection or line-of-sight absorption in ‘cold’ matter. However, the power law plus absorption edge fit still left substantial curvature in the data:model residuals.
Since the spectral curvature in the 2–6 keV band is reminiscent of an extreme relativistic Fe K emission line, a Laor emission line (Laor 1991) was then added to the power law continuum (without the added absorption edge). An excellent fit was then obtained ( of 589 for 620 dof), for a (rest frame) line energy of 6.40.3 keV, disc emissivity index 4.5 and inner radius rin1.5 rg, where rg is the gravitational radius. The disc inclination was 444∘ in this fit. In addition to being extremely broad the required line equivalent width (EW) was also large, at 0.9 keV in both pn and MOS spectral fits. The underlying power law slope was essentially unchanged by the addition of the Laor emission line.
Since the Laor line arises by reflection (implicitly from the inner accretion disc) it must be accompanied by strong continuum reflection in a physically realistic fit. Given the above absorption edge fit lies close to 7.1 keV (the K-edge energy of neutral Fe) we chose to model the continuum reflection with PEXRAV in Xspec (Magdziarz and Zdziarski 1995), setting the high energy cut-off at 150 keV, with solar abundances and the reflection factor R initially at 4 (to match the high Laor line EW). The subsequent best-fit, with R set free, was again very good ( of 584 for 619 dof), with the power law slope increased by 0.34 in both pn and MOS (normalisation ph cm-2 s-1), and a reflection factor R=3.51.5. The Laor line parameters were little changed by the addition of the continuum reflection, the line being still broad and strong.
3.2 Extending the spectral fit to 0.3 keV
Fixing the above 2–10 keV spectral parameters and extrapolating the fit to 0.3 keV showed a shallow deficit of flux between 1–2 keV and a strong excess below 1 keV. The addition of a blackbody component of kT 90 eV modelled the soft excess quite well, but it was necessary to free the power law and Laor line parameters to fit the data at 1–2 keV. A flattening of the power law indices by 0.14 and an increase in the Laor line EW by 200 eV yielded an overall (0.3-10 keV) of 1135 for 1045 dof. The narrow peak in observed flux at 0.5 keV (visible in figures 1 and 2) was then the main contributor to the data:model residuals. The addition of a gaussian emission line to model this feature gave a further significant improvement to the broad-band fit, which was then formally acceptable ( of 991 for 1039 dof), for a narrow line (=4020 eV) at 0.610.01 keV (pn) and 0.570.01 keV (MOS), with an EW50 eV.
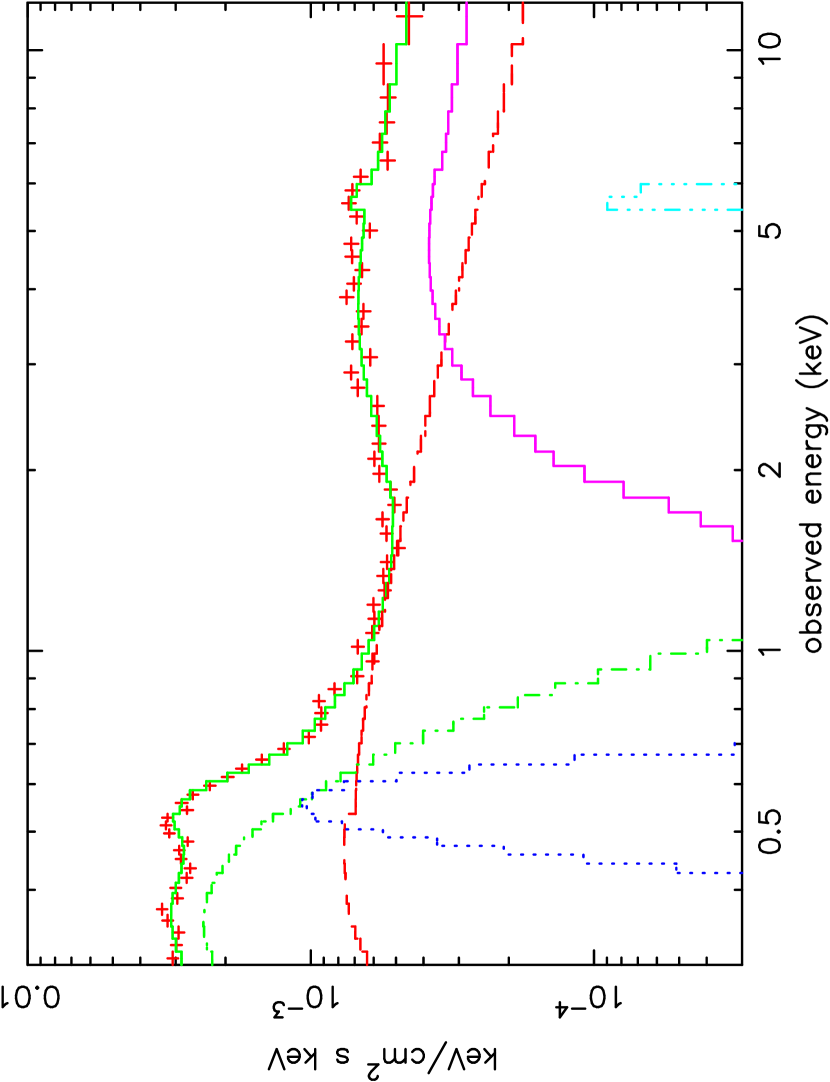
We illustrate the overall ‘Laor line/PEXRAV’ model spectrum in figure 3 and list the parameters of the model in Table 1. While complex, this model does provide an excellent fit to the data. We briefly discuss the physical implications in section 6.1.
The good match of model and data allows the mean X-ray fluxes and luminosity of 1H 0419-577 during the September 2002 XMM-Newton observation to be derived. These were erg s-1 cm-2 (0.3–1 keV), with 67 percent in the blackbody component, erg s-1 cm-2 (1–2 keV), and erg s-1 cm-2 (2–10 keV). Combining these fluxes yields a 0.3–10 keV luminosity for 1H 0419-577 in the ‘low state’ of erg s-1 ( km s-1 Mpc-1).
3.3 Partial covering fit
Several recent studies (eg. Inoue and Matsumoto 2003, MCG-6-30-15; Pounds et al. 2003a, PG1211+143) have pointed out that partial covering of the power law continuum by absorbing matter can impose spectral curvature over the 3–7 keV band very similar in appearance to a relativistic Fe K emission line. To test this alternative fit for the low state EPIC data of 1H 0419-577 we next considered a model in which a fraction of the power law continuum is obscured by an ionised absorber, using the ABSORI model in Xspec. The outcome was that both the 3–6 keV spectral curvature and the absorption edge (observed at 6.4 keV, but at 7.1 keV in the AGN rest frame) were well fitted with 6015 percent of the power law being covered by weakly ionised matter of ionisation parameter (= )0.3 erg cm s-1 and column density = 4.30.4 cm-2. The power law index in this fit was less extreme, with 1.48 (pn) and 1.36 (MOS). While these partial covering parameters are not unique, non-solar abundances and a range of ionisation parameter allowing alternative fits to the spectral curvature, the observed absorption edge near 7 keV requires the mean ionisation state to be low. Higher resolution spectra will be required to further constrain such absorbing matter.
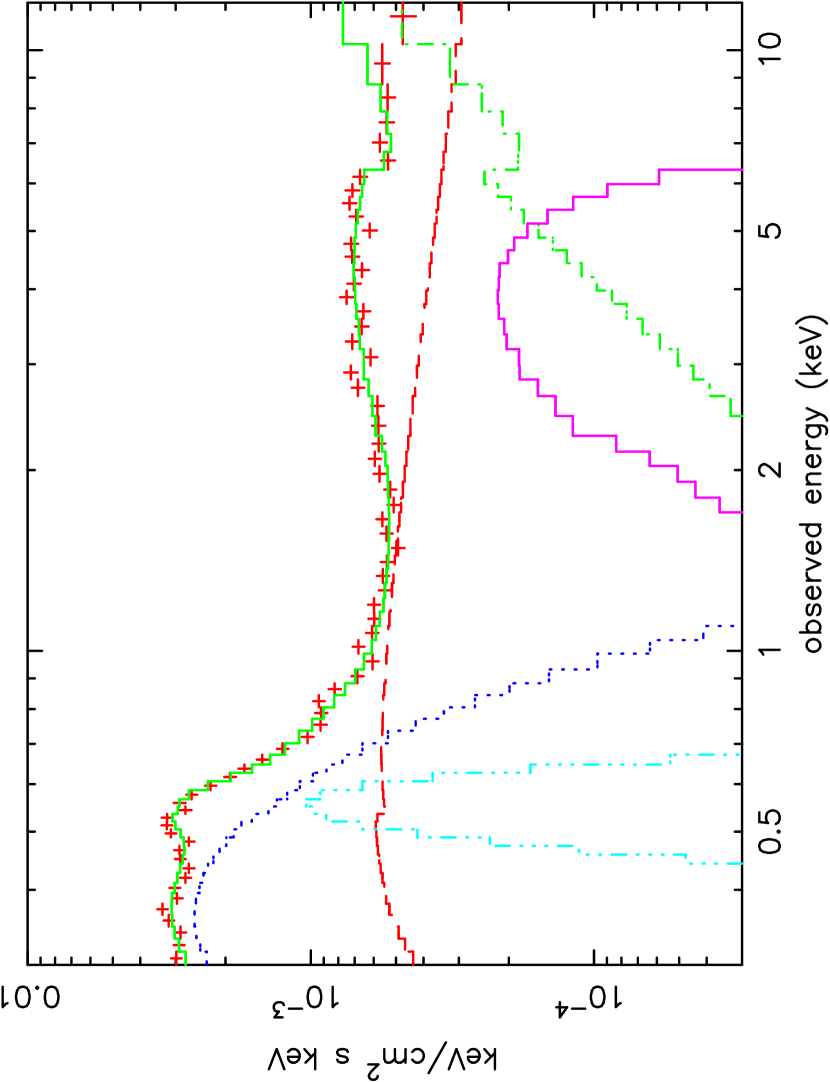
Unlike for the Laor line/PEXRAV model, extrapolation of the 2–10 keV partial covering model remained a good fit to 1 keV, below which a blackbody component was required to model the strong soft excess. Once again, this broad-band continuum fit left a significant excess of flux near 0.5 keV. Modelling this feature with a gaussian emission line produced similar parameters to those found in section 3.2, giving a 0.3–10 keV broad-band fit of very similar overall quality ( of 997 for 1038 dof). In this partial covering fit it is interesting to note the data:model residuals now show an excess just below 6 keV. Adding, finally, a gaussian emission line to the partial covering model gave a further small, but statistically significant, improvement of 16 for 4 additional parameters. The full details of the partial covering fit are listed in Table 2, and the model is illustrated in figure 4. We discuss the physical implications of this model and compare it with the Laor line/PEXRAV model in section 6.1.
To clarify the 0.5 keV emission feature seen in both the above fits to the EPIC spectra, and search for other structure in the soft X-ray spectrum of 1H 0419-577 , we then examined the simultaneous RGS data.
4 Spectral lines in the RGS data
Both Laor and PC fits to the EPIC data indicate a strong soft excess above an extension of the hard power law, and a narrow emission feature at 0.55-0.65 keV.
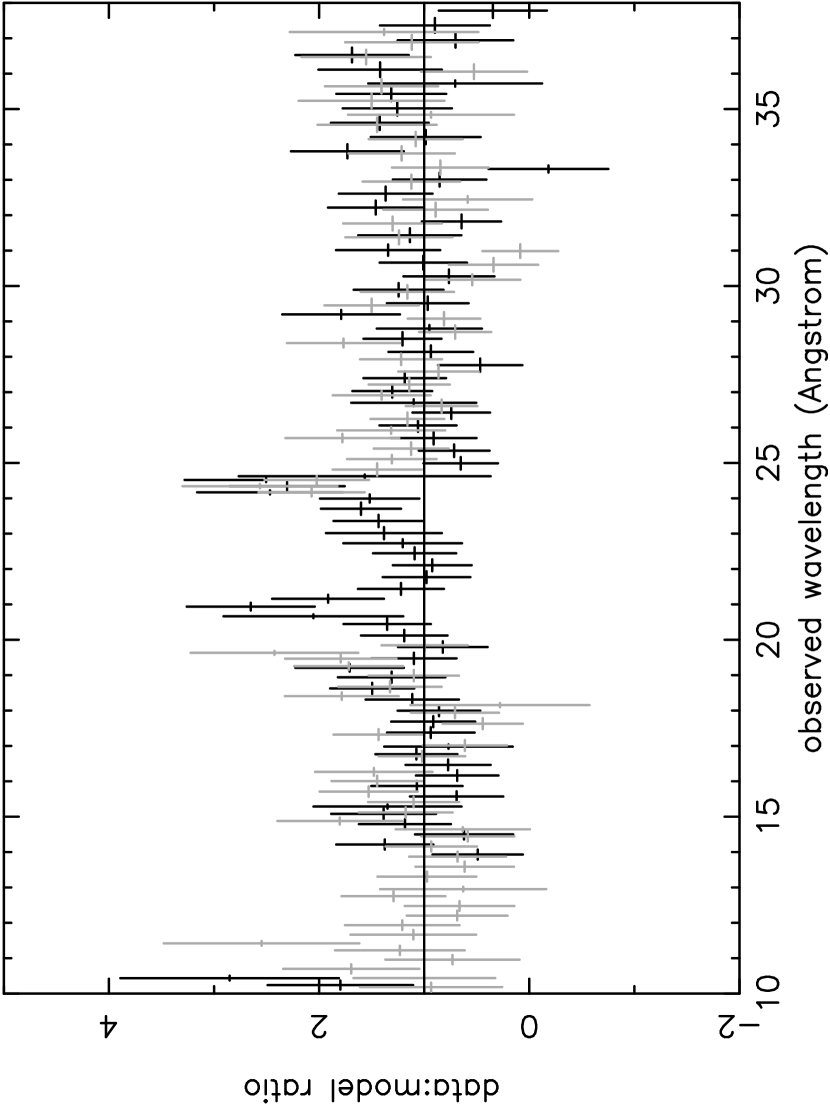
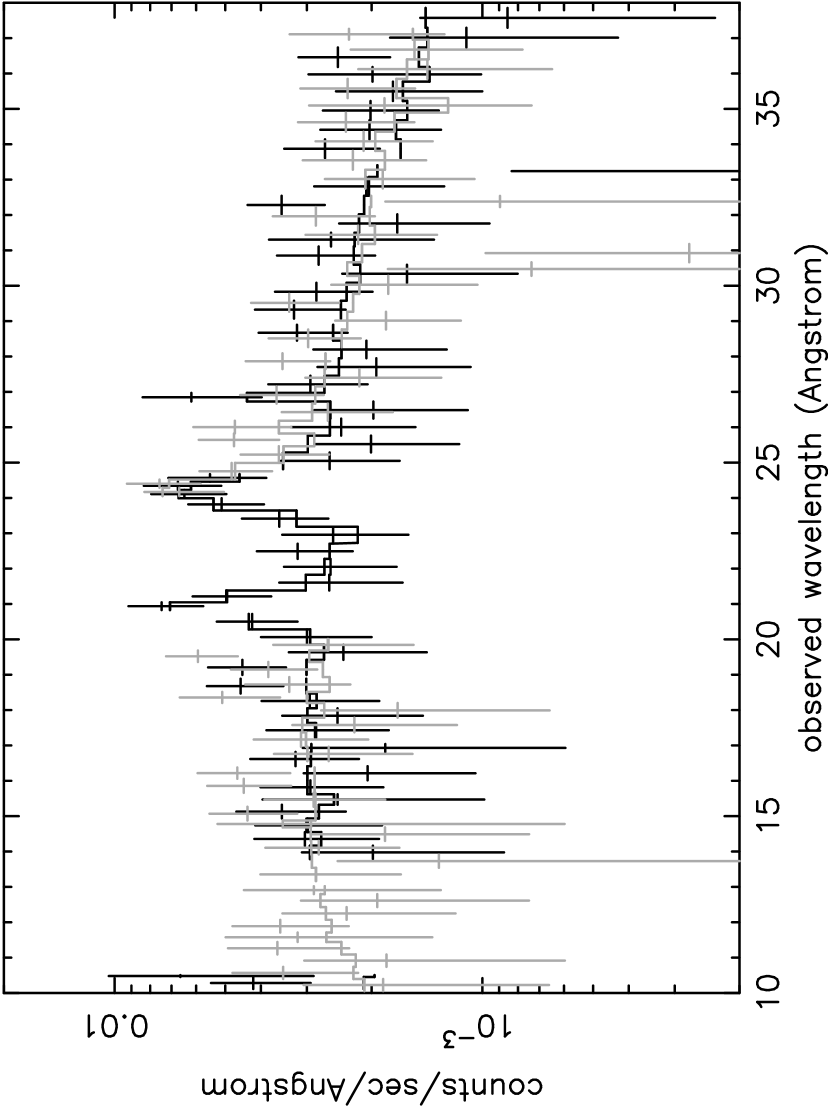
To gain further insight on the soft X-ray spectrum we examined the simultaneous XMM-Newton grating data of 1H 0419-577. We began by jointly fitting the RGS-1 and RGS-2 data with a power law and black body continuum (from the corresponding EPIC 0.3–10 keV fits) and examining the data:model residuals by eye. The only obvious features (figure 5) were emission lines observed at 21 and 24 . To quantify these features we then added gaussian emission lines to the power law plus blackbody continuum fit in Xspec, with wavelength, line width and flux as free parameters. In each case the line width is unresolved, indicating a FWHM2000 km s-1, though this value is not well constrained given the low RGS count rates. The fitted spectrum is shown in figure 6.
In the rest frame of 1H 0419-577 the line wavelengths are 22.020.05 and 18.990.05 , corresponding closely to the laboratory wavelengths of the forbidden OVII line (22.095 ) and the resonance OVIII Ly line (18.969 ). The fitted line fluxes were ph s-1 cm-2 and ph s-1 cm-2, respectively, corresponding to equivalent widths of 18 and 28 eV. When blended in the lower resolution EPIC data these 2 strong emission lines match well with the gaussian emission feature required in both pn and MOS spectral fits. The statistical quality of the joint RGS fit was significantly improved by the addition of the two lines, with a reduction in of 36 for 4 fewer dof.
Although the constraints on other emission (or absorption) lines in the RGS data are weak, due to the low flux state of 1H 0419-577, the dominance of the forbidden line of the OVII triplet is a clear signature of a photoionised plasma, with an electron density cm-3 (Porquet and Dubau 2000). The equally strong OVIII Ly emission indicates an ionisation parameter (= , where n is the gas density at a distance r from the ionising source of luminosity L) of order 4510 (Kallman and McCray 1982). Assuming a solar abundance of oxygen, with 40 percent in OVII, 50 percent of recombinations from OVIII direct to the ground state, and a low temperature recombination rate of cm3 s-1 (Verner and Ferland 1996), we deduce an emission measure for the forbidden line flux of order cm-3.
A further constraint on this ionised emission region can be obtained from the relevant ionisation parameter. Assuming a ‘typical’ (mean 1H 0419-577 flux) ionising luminosity for K-shell oxygen of LOX erg s-1, with 45, we find nr2 cm-1. Combining this value with the above emission measure then gives r cm for a uniform spherical distribution of photoionised gas, and a particle density n cm-3. Such a low density plasma would have an equilibration time of 1 year, supporting the above assumption of a flux-averaged ionising luminosity. In our analysis of the later XMM-Newton observations of 1H 0419-577 it will be instructive to see how the strong line emission from OVII and OVIII varies, if at all, noting also the light travel time across a region as large as we estimate will be 30 years.
5 Comparison with the earlier high flux XMM-Newton observation
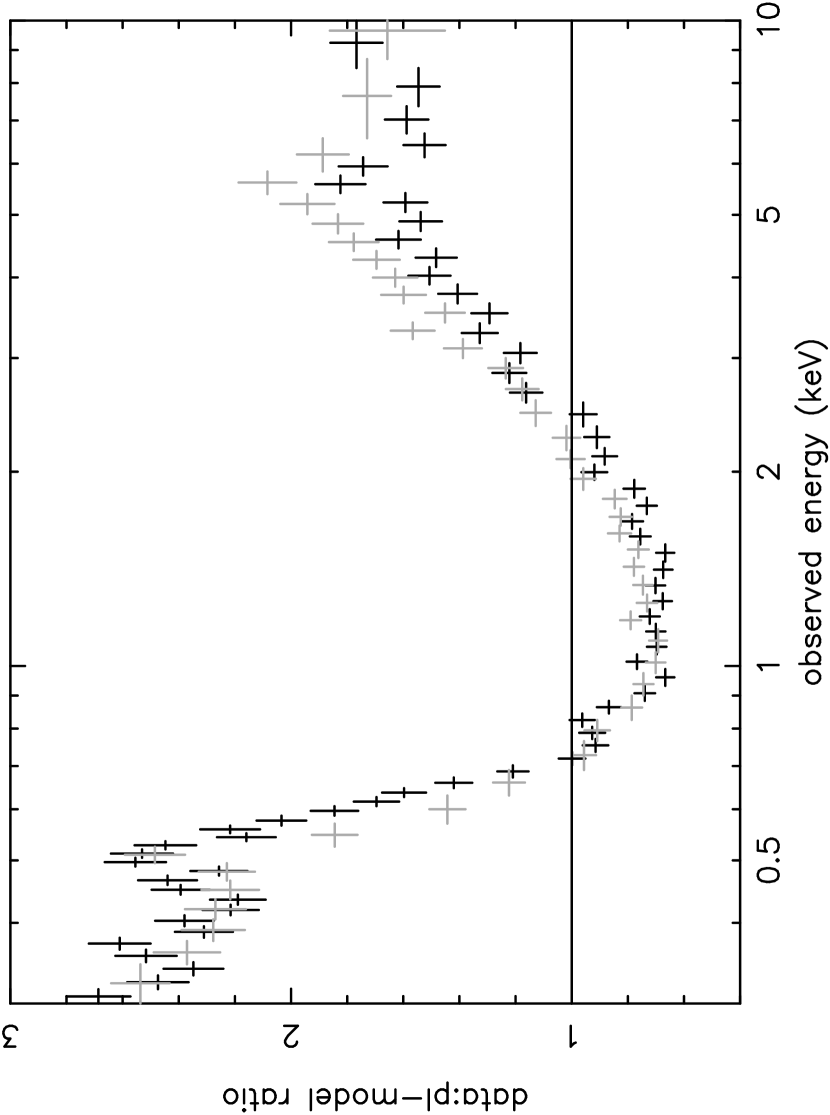
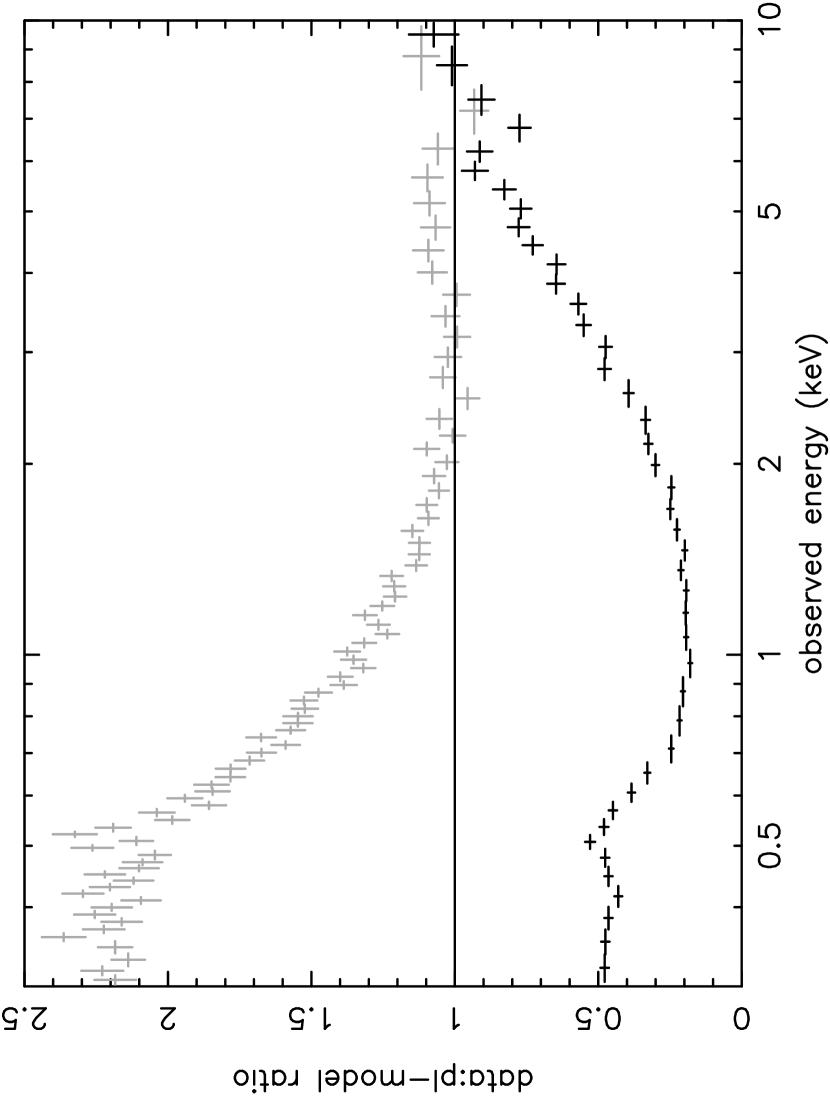
A detailed analysis of the large-scale spectral variability in 1H 0419-577 should be possible by combining the data from all 6 XMM-Newton observations made over the 15-month period from September 2002. The scale of the broad-band variability may already be indicated, however, by comparing the present low flux state spectrum with the previously published pn observation from December 2000 (Page et al. 2002). Figure 7 illustrates the degree of variability by comparing the ratio of the December 2000 data to the best-fit 2–10 keV power law (=1.9), with the ratio of the September 2002 data to the same power law. The two data sets are seen to be quite similar at the highest energies, while diverging strongly below 5 keV.
To assess the gross features of the spectral variability we then obtained the difference spectrum of the two background-subtracted pn data sets (adjusted for the different exposures) and compared the resulting data with a simple power law. The fit was surprisingly good, with a power law of =2.450.1 modelling the difference spectrum closely from 0.3–2 keV (figure 8). To check the apparent steepening of the power law at higher energies we re-grouped the data to a minimum of 500 bins, to ensure adequate statistics in the highest energy data points. Fitting the difference spectrum above 2 keV then confirmed a significant steepening in the spectral slope, to =2.70.1 (2–10 keV).
That comparison of the new ‘low state’ EPIC spectrum with the earlier ‘high state’ spectrum shows rather unambiguously that the large scale spectral variability in 1H 0419-577 is dominated by a steep power law component. Furthermore, the steep power law fit to the difference spectrum, 2.45, implies that no ‘separate’ variable soft emission (blackbody) component is required. The gradual steepening of the difference spectrum at higher energies appears to be real and may offer an important clue to the physical origin of the variable component. One obvious candidate is Comptonisation and a trial fit with compTT in Xspec (Titarchuk 1994) gave an excellent fit ( of 101 for 105 dof), with input photons of kT70 eV and an optically thick Comptonising plasma (=4.51) at kT=2.60.9 keV reproducing the mean slope and high energy downturn in the difference spectrum.
Future analysis of the full XMM-Newton data set should shed further light on this interesting outcome.
6 Discussion
There are three points of particular note resulting from the XMM-Newton observation of 1H 0419-577 reported here.
Particularly remarkable is the extremely hard (flat) power law spectrum that approximates to the EPIC data over the 2–10 keV band. A spectral index 1.0 is flatter than any reported previously for this highly variable source, lying below all previous X-ray spectra (see fig.3 in Page et al. 2002). In comparison we recall the 2–10 keV continua of radio quiet AGN have a photon index usually in the range =1.7–2.0 (Nandra and Pounds 1994, Reeves and Turner 2000). Second, although the RGS features are relatively faint, the unambiguous detection of emission lines of OVII and OVIII provides clear evidence for an extended region of photoionised gas in the nucleus of 1H 0419-577. Finally, a comparison of the raw EPIC data with data obtained in December 2000, when 1H 0419-577 was considerably brighter, gives a model-independent indication that the large-scale spectral variability in 1H 0419-577 is primarily due to a variable, steep power law component.
6.1 Relativistic Fe K line or partial covering?
However modelled, the 2-10 keV spectrum of 1H 0419-577 observed in September 2002 was very unusual. Although the addition of strong reflection, or of partial covering, allowed for a steeper underlying power law continuum, it remained sufficiently flat to require rather extreme conditions for Comptonisation models ( Svensson 1994, Haardt et al. 1997), suggesting in particular a ‘photon starved’ scenario’. Although still to be proven by the analysis of further observations, the simple form of the difference spectrum ( obtained by subtracting the present EPIC spectrum from that of December 2000) suggests the hard ‘low state’ spectrum remained ‘constant’ over that 21 month interval. The implication might be for a ‘core’ accretion disc component that is located in a region of high gravity (the reflection-dominated Laor line fit), or is overlain by substantial cool absorbing matter.
Our finding that extreme relativistic Fe K emission line and partial covering models fit the spectral curvature in the 3–7 keV band equally well adds to a growing number of such cases, most recently the low luminosity Seyfert NGC 4051 (Pounds et al. 2003c). Both models raise obvious questions in applying to a low flux state as seen here for 1H 0419-577. In the former case there is the concern that strong illumination of the innermost accretion disc, required to explain the extreme relativistic broadening of the Fe K emission line, is counter-intuitive when the X-ray luminosity is apparently so low ( but see Miniutti and Fabian 2003), while in the latter the partial covering requires a structured absorber covering the hard X-ray source, but not the region of soft X-ray emission. Statistically, our fits to the EPIC data are equally good and - once again - higher energy data is needed to discriminate between the two models. Although not conclusive, it is interesting to note that extending the EPIC fits to 12 keV offers some support for the PC model, where the data:models residuals remain small (figure 4), whereas for the Laor line/PEXRAV model the flatter model continuum significantly over-predicts the data (figure 3).
Further circumstantial evidence in favour of the PC model fit may be taken from the detection, in that case, of a non-relativistic Fe K emission line. The line is weak, having an EW (against the total power law continuum) of only 85 eV, and hence poorly constrained. Although the line energy is only barely compatible with fluorescence from neutral iron, the partial covering model does offer a natural origin for an Fe K emission line of that order, by continuum absorption and fluorescent re-emission from the substantial column of overlying gas (Makishima 1986). Incidentally, that explanation would leave little room for the narrow 6.4 keV line found to be a prominent feature in many lower luminosity Seyfert galaxies ( and believed to arise from matter distant from the black hole, eg a molecular torus), consistent with an emerging view that the EW of the narrow Fe K line is anti-correlated with luminosity (Page et al. 2003).
6.2 Extended photoionised gas in 1H 0419-577
Although only 2 emission lines were clearly detected in the RGS spectrum of 1H 0419-577, taken together they provide a surprisingly powerful diagnostic of the emitting gas. Most useful is the detection of the forbidden line of OVII, since its relative strength (in the OVII triplet) shows photoionisation to be the dominant process and sets a limit on the plasma density, while the measured line flux provides a straightforward estimate of the emission measure. The detection of a similarly strong OVIII Ly resonance line (usually seen in absorption in Seyfert 1 galaxies, and perhaps enhanced here due to the low continuum flux of 1H 0419-577 ), allows the ionisation parameter of the photoionised gas to be calculated, assuming a common location of the OVII and OVIII gas. The emission measure and ionisation parameter then provide estimates of the scale ( cm) of a spherical emission region of particle density cm-3. A corresponding mass for this extended gas envelope is then . Although evidence that this gas is associated with an outflow must await a search for the corresponding absorption lines in the later XMM-Newton observations of 1H 0419-577, a typical (Seyfert 1) outflow velocity of 300 km s-1 (eg Kaspi et al. 2002) could replenish this region in years.
6.3 Spectral variability
Comparison of the EPIC pn data from the observation reported here, with that from a much brighter state of 1H 0419-577 in December 2000, has yielded some fascinating indicators. The large-scale change in the X-ray spectrum can be described by a variable intensity, fixed slope, power law, which is sufficiently steep as not to require a separate variable soft (blackbody) component. This is similar to the conclusion of Fabian et al. (2003) from the long XMM-Newton observation of MCG-6-30-15, though in that case the index of the variable power law component was lower. We also note, if the hard power law component does remain unchanged (as implied by the simple form of the difference spectrum), then it seems reasonable to conclude that the corresponding emission mechanism and location are physically distinct from the variable power law component.
If the variable X-ray component arises by Comptonisation of accretion disc photons, the scale of spectral change between the two XMM-Newton observations may be sufficiently great to require a structural change in the inner accretion disc and/or corona. We have some evidence that the thermal disc emission was significantly stronger during the December 2000 observation, since the the OM UVW1 channel (the only one live) was 0.9 mag brighter than on the second occasion. Again, it is interesting to note that the variable power law component has a spectral index (2.5) similar to that predicted for scattering in an optically thick (1) corona (Haardt et al. 1997), suggesting the change is mainly in the scattering medium. Our simple compTT fit to the difference spectrum (section 5) is consistent with that interpretation.
In addition to direct or up-scattered disc radiation, a significant emission component might be associated with an energetic outflow, as recently found in several luminous AGN (Chartas et al. 2002, Pounds et al. 2003a,b, Reeves et al. 2003). While in those cases where high velocity outflows have been confirmed they appear to be linked to a high (Eddington or super-Eddington) accretion rate (King and Pounds 2003), the evidence for column densities of highly ionised gas in excess of cm-2 is becoming more common for Seyfert 1 galaxies (eg Bianchi et al. 2003). The important point is that the kinetic energy in a high velocity flow can be comparable to the accretion energy, offering the possibility - perhaps via shocks in the outflow - of an additional X-ray emission component. It is interesting to speculate that the steep power law characterising the spectral variability in 1H 0419-577 might arise in this way, by providing the additional Comptonising electrons or even by thermal emission.
The extensive new XMM-Newton observations of the large-scale spectral variability of 1H 0419-577 should shed new light on the emission mechanism(s) which make AGN characteristically powerful X-ray sources.
7 Summary
A new XMM-Newton observation of the luminous Seyfert 1 galaxy 1H 0419-577 has found the source to be in an extreme low flux state. The 2–10 keV spectrum is unusually hard, being approximated by a power law of 1.0. However, significant residuals are seen in the power law fit, which can be modelled by either a relativistic Fe K emission line or by partial covering by a substantial column of near-neutral gas. Detection of emission lines of OVII and OVIII indicate the presence in 1H 0419-577 of an extended region of highly ionised gas. A comparison of the present X-ray spectrum of 1H 0419-577 with that obtained in a short observation by XMM-Newton 2 years earlier, when the source was much brighter, shows that the spectral variability is dominated by a previously unrecognised steep power law component.
8 Acknowledgments
The results reported here are based on observations obtained with XMM-Newton, an ESA science mission with instruments and contributions directly funded by ESA Member States and the USA (NASA). The authors wish to thank the SOC and SSC teams for organising the XMM-Newton observations and initial data reduction. KAP is pleased to acknowledge a Leverhulme Trust Emeritus Fellowship.
References
-
(1)
Arnaud K.A., 1996, ASP Conf. Series, 101, 17
-
(2)
Bianchi S., Balestra I., Matt G., Guainazzi M., Perola G.C., 2003, A&A, 402, 141
-
(3)
Brissenden R.J.V. Tuohy I.R., Remillard R.A., Buckley D.A., Bicknell G.V, Bradt H.V, Schwartz D.A., 1987, PASAu, 7, 212
-
(4)
den Herder J.W. et al., 2001, A&A, 365, L7
-
(5)
Fabian A.C., Ballantyne D.R., Merloni A., Vaughan S., Iwasawa K., Boller Th., 2002, MNRAS, 331, L35
-
(6)
Fabian A.C, Vaughan S., 2003, MNRAS, 340, L28
-
(7)
Guainazzi M. et al., 1998, A&A, 339, 327
-
(8)
Haardt F., Maraschi L., 1991, ApJ, 380, L51
-
(9)
Haardt F., Maraschi L., Ghisellini G., 1997, ApJ, 476, 620
-
(10)
Inoue H., Matsumoto C., 2003, PASJ, 55, 635
-
(11)
Kallman T., McCray R., 1982, ApJS, 50, 263
-
(12)
Kaspi S. et al., 2002, ApJ, 574, 643
-
(13)
King A.R., Pounds K.A., 2003, MNRAS, 345, 657
-
(14)
Laor A., 1991, ApJ, 376, 90
-
(15)
Magdziarz P., Zdziarski A.A., 1995, MNRAS, 273, 837
-
(16)
Makishima K., 1986, in Physics of Accretion onto Compact Objects, Lecture Notes in Physics, vol.226,
Eds, Mason, Watson and White, Springer-Verlag, p. 249
-
(17)
Marshall H.L., Fruscione A., Carone T.E., 1995, ApJ, 439, 90
-
(18)
Mason K.O., et al., 2001, A&A, 365, L36
-
(19)
Miniutti G., Fabian A.C., 2003, MNRAS, submitted (astro-ph/0309064)
-
(20)
Nandra K., Pounds K.A., 1994, MNRAS, 268, 405
-
(21)
Page K., Pounds K.A., Reeves J.N., O’Brien P., 2002, MNRAS, 330, L1
-
(22)
Page K., O’Brien P,T., Reeves J.N., Turner M.J.L., 2003, MNRAS, 347, 316
-
(23)
Porquet D., Dubau J. 2000, A&A, 143, 495
-
(24)
Pounds K.A, Reeves J.N., King A.R, Page K.L, O’Brien P.T., Turner M.J.L., 2003a, MNRAS, 345, 705
-
(25)
Pounds K.A, King A.R, Page K.L, O’Brien P.T., 2003b, MNRAS, 346, 1025
-
(26)
Pounds K.A., Reeves J.N., King A.R., Page K.L., 2003c, MNRAS, submitted (astro-ph/0310257)
-
(27)
Pye J.P. et al., 1995, MNRAS, 274, 1165
-
(28)
Reeves J.N., Turner M.J.L., 2000, MNRAS, 316, 234
-
(29)
Reeves J.N., O’Brien P., Ward M.J., 2003, ApJ, 593, L65
-
(30)
Strüder L.et al., 2001, A&A, 365, L18
-
(31)
Svensson R., 1994, ApJS, 92, 585
-
(32)
Titarchuk L., 1994, ApJ, 434, 313
-
(33)
Turner T.J. et al., 1999, ApJ, 510, 178
-
(34)
Turner M.J.L. et al., 2001, A&A, 365, L27
-
(35)
Verner D.A., Ferland G.J., 1996, ApJS, 103, 467
-
(36)
Zycki P.T., Done C., Smith D.A., 2001, MNRAS, 326, 1367

| power-law | OVII/OVIII emission | ||||||
|---|---|---|---|---|---|---|---|
| instrument | E (keV) | (eV) | fluxaa10-6 ph cm-2 s-1 | EW (eV) | /dof | ||
| pn | 1.260.09 | 0.610.01 | 4020 | 2.50.6 | 53 | 991/1039 | |
| MOS | 1.230.09 | 0.570.01 | 2.20.8 | 45 | |||
| blackbody | Laor line | ||||||
| instrument | kT (eV) | E (keV) | rin (rg) | () | EW (keV) | ||
| pn+MOS | 922 | 6.90.4 | 7.50.5 | 1.30.2 | 464 | 1.10.3 | |
| power-law | partial covering absorber | |||||
| instrument | norm.aa10-4 ph cm-2 s-1 keV-1 | norm.aa10-4 ph cm-2 s-1 keV-1 | NHbb1022 cm-2 | |||
| pn | 1.500.05 | 6.30.2 | 9.61.4 | 4.30.4 | 0.3 | |
| MOS | 1.380.06 | 6.20.2 | 7.21.4 | |||
| blackbody | OVII/OVIII emission | |||||
| instrument | kT (eV) | E (keV) | (eV) | fluxcc10-6 ph cm-2 s-1 | EW (eV) | |
| pn | 872 | 0.610.01 | 4815 | 2.90.7 | 65 | |
| MOS | 0.570.01 | 2.51.6 | 53 | |||
| emission line | ||||||
| instrument | E (keV) | (eV) | fluxcc10-6 ph cm-2 s-1 | EW (eV) | /dof | |
| pn | 6.210.11 | 160110 | 118 | 84 | 981/1034 | |
| MOS | 107 | 88 | ||||