An old galaxy group: Chandra X-ray observations of the nearby fossil group NGC 6482
Abstract
We present the first detailed X-ray observations, using Chandra , of NGC 6482 – the nearest known ‘fossil group’. The group is dominated by an optically luminous giant elliptical galaxy and all other known group members are at least two magnitudes fainter. The global X-ray properties (luminosity, temperature, extent) of NGC 6482 fall within the range of other groups, but the detailed properties show interesting differences. We derive the gas temperature and total mass profiles for the central 30 kpc () using ACIS spatially resolved spectroscopy. The unusually high ratio is found to result from a high central gas density. The temperature profile shows a continuous decrease outward, dropping to 0.63 of its central value at 0.1. The derived total mass profile is strongly centrally peaked, suggesting an early formation epoch. These results support a picture in which fossil groups are old, giving time for the most massive galaxies to have merged (via the effects of dynamical friction) to produce a central giant elliptical galaxy.
Although the cooling time within is less than a Hubble time, no decrease in central temperature is detected. The entropy of the system lies toward the low side of the distribution seen in poor groups, and it drops all the way into the centre of the system, reaching very low values. No isentropic core, such as those predicted in simple preheating models, is present. Given the lack of any central temperature drop in the system, it seems unlikely that radiative cooling can be invoked to explain this low central entropy. The lack of any signature of central cooling is especially striking in a system which appears to be old and relaxed, and to have a central cooling time years. We find that the centrally peaked temperature profile is consistent with a steady-state cooling flow solution with an accretion rate of 2 M⊙ yr-1, given the large work arising from the cuspy mass profile. However, solutions involving distributed or non-steady heating cannot be ruled out.
keywords:
galaxies: clusters: general - galaxies: elliptical - galaxies: haloes - intergalactic medium - X-ray: galaxies - X-rays: galaxies: clusters1 Introduction
In a cosmological hierarchy where smaller systems form prior to the collapse and virialization of more massive systems, groups form before clusters. However, distinguishing old groups among all the groups observed today has generally proved impossible. In galaxy groups, galaxy mergers can occur efficiently because of their low velocity dispersion, similar in some cases to the internal velocity dispersions of galaxies. In an old, relatively isolated group with little subsequent infall, there may be sufficient time for most massive galaxies (but not the low mass galaxies) to lose energy via dynamical friction and merge, producing a system consisting of a giant central elliptical galaxy, dwarf galaxies and an extended X-ray group halo. This is one of the proposed scenarios for the formation of giant isolated elliptical galaxies and has its origins in the galactic cannibalism of Hausman & Ostriker (1978). The observation of ‘fossil’ systems (Ponman et al., 1994) gave the first direct clue to the above mechanism. Numerical simulations (Barnes, 1989) suggest that a few billion years is required for compact group members to merge and form a single elliptical galaxy. It is then feasible to form such a system in a Hubble time, but if it falls into a cluster during this process then the evolutionary history will be obscured.
There are about a dozen such systems identified (Ponman et al., 1994; Vikhlinin et al., 1999; Mulchaey & Zabludoff, 1999; Jones et al., 2000; Romer et al., 2000; Matsushita, 2001; Jones et al., 2003) but few of them have been studied in detail. Based on their space density, and using a precise definition of such a system, Jones et al. (2003) estimate that fossil systems represent 8%-20% of all systems with the same X-ray luminosity, and are as numerous as poor and rich clusters combined. Therefore studying these systems gives us information about the formation of giant elliptical galaxies at redshifts which are readily accessible and without the additional complications of infall into clusters.
Jones et al. (2003) found that fossil systems had an unusually high ratio compared to normal groups, and suggested that the high X-ray luminosity was due to a high density of hot gas, reflecting an early epoch of formation when the Universe was denser. Alternatively, Vikhlinin et al. (1999) suggested that such systems have an unusually high mass-to-light ratio and thus represent partially failed groups with low star formation efficiencies. If the distinctive properties of fossil groups arise from an unusually early collapse epoch, then they should have strongly peaked mass profiles (e.g. Navarro et al. 1995). They are expected to contain central cool gas, because no merger induced mixing has taken place recently. It has also been suggested that these systems should contain lower gas entropy (Jones et al., 2003). A given amount of energy injected at a high density epoch should result in lower entropy than if it is injected at a later, low density, epoch.
The discovery of fossils, and measurements of their X-ray properties, has so far been based on ROSAT observations. In this paper we report on a detailed Chandra observation of the nearest known fossil group.
This paper is organised as following: Section 2 briefly reviews the group properties and describes the data and preparations. The results from imaging and spectral X-ray analysis are presented in section 3. Section 4 describes the distribution of mass and mass-to-light ratio. X-ray scaling relations are discussed in section 5. A discussion and concluding remarks are summarised in section 6.
2 Observation and Preparation
2.1 The group
The NGC 6482 group was selected for Chandra observations via a search for nearby fossil groups, based on a sample of isolated optically luminous elliptical galaxies. The isolation criteria were that all galaxies listed in NED within 0.75 Mpc and 1000 km s-1 of the elliptical galaxies were required to be more than 2 magnitudes fainter. In addition, the X-ray luminosity, based on the ROSAT All-Sky Survey, was required to be 1042 erg s-1, much greater than normal ellipticals and meeting the Jones et al. (2003) definition of a fossil group.
The closest galaxy [or group] found which satisfied these criteria was NGC 6482 (RA. 17:51:48.83 and Dec. +23:04:18.9; J2000), at a redshift . This is a giant elliptical galaxy and brightest group member. There are 5 confirmed members of this group within arcmin of the brightest member. These are NGC 6482, UGC 11018, MRK 895, UGC 11024 and CGCG 141-014. The second brightest galaxy, UGC 11024, has a total (2MASS) J magnitude of 11.41, compared with Jtot=9.35 for NGC 6482. Thus all the known members are indeed more than 2 magnitudes fainter than the brightest galaxy.
There are more than 20 2MASS near-IR galaxy detections within arcmin, the area limited to the locations of the above members, with a total J-magnitude ranging from 14.2 to 15.5, but there is no independent source to confirm their group membership. The velocity dispersion of the group is 242 km s-1 calculated using the heliocentric velocities of individual group members (NED, NASA/IPAC Extragalactic Database).
Analysis of a pointed ROSAT PSPC observation showed that NGC 6482 was at the centre of extended X-ray emission. The X-ray luminosity was erg s-1. An X-ray point source coincident with NGC 6482, probably an AGN, hampered a detailed analysis. Goudfrooij et al. (1994) have noted the presence of a radio source and emission-line gas and dust in the nucleus of NGC 6482, probably also associated with the active nucleus. The derived mass of ionised gas and dust is typical of other elliptical galaxies in the study. This study also shows that there is no strong dust lane in the brightest group galaxy suggesting the absence of any recent merger induced mixing.
km s-1 Mpc-1 and are assumed throughout this paper. At the redshift of NGC 6482 the luminosity and diameter distances are 56.7 Mpc and 55.2 Mpc, respectively and 1 arcsec 0.268 kpc.
2.2 Chandra observation and data preparation
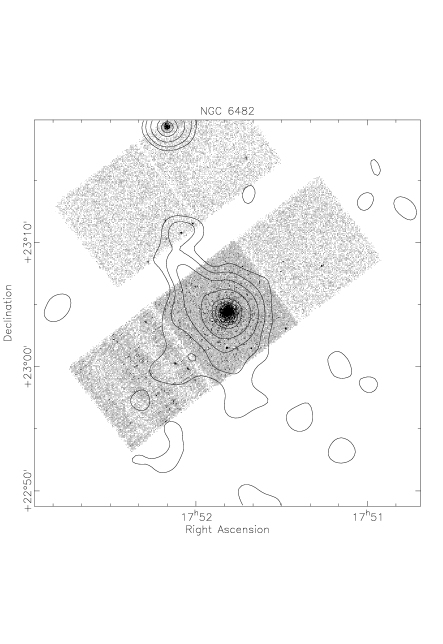
NGC 6482 was observed using Chandra ACIS-S on 2002 May 20. The target was located at the centre of chip 7 (S3), a back-illuminated CCD. The total exposure time was over 19 ks. Bad pixels were removed using the supplied bad pixel file. Background flares were also removed from the event 2 file leaving us with a useful exposure time of just over 18 ks. This study is limited to the S3 chip which is entirely illuminated by the X-ray emission from the source. A fraction of the X-ray emission is lost in the gaps between the chips (Fig. 1) and closest part of chip 2 (to the NE) contains point sources which appear to be the main source of the observed elongation in the ROSAT image. For this analysis, unless stated otherwise, the standard CIAO v2.3 routines and tools were used.
2.2.1 Spatial analysis
Based on our ROSAT analysis, it was suspected that the X-ray emission extends beyond the chip under study, S3, and that blank sky observations must be used to estimate the background. We use those provided in the CAIO calibration data base CALDB. The lowest flux regions at the edges of the S3, which are the closest to being ‘source free’, show a 30% higher soft X-ray flux on average compared to the flux from the same regions at the re-projected blank sky observation. At the same time the hard X-ray count rate measured for the same regions shows no offset, confirming that the diffuse source emission has fully covered the chip. The background estimated from surrounding chips cannot be directly used since they are all front-illuminated. Thus a background image from blank sky observations with energies from 0.3-2.0 keV was used for the spatial analysis.
Point sources were detected using the CIAO wavelet detection algorithm and replaced by their local surrounding mean counts before any spatial analysis was carried out. Vignetting and other sensitivity variations were corrected for, using an exposure map appropriate for the energy band.
2.2.2 Spectral analysis
We extracted ACIS spectra in successive circular annuli, in the energy range limited to 0.5-2.0 keV, excluding point sources. The background was chosen for each annulus separately, to account for vignetting, and from the same region on the re-projected blank sky observations to account for local variations within the chip.
The spectra were fit with absorbed hot plasma models and the APEC (Smith et al., 2001) model was found to give the best fit. A fixed hydrogen column density of was included in the model to account for Galactic absorption. An integrated spectrum was first extracted from a large region, of 3 arcmin radius. A mean temperature of 0.66 keV and an unabsorbed flux of erg s-1 cm-2 (0.5-2 keV) was found. However, the fit was poor with a reduced of about 1.5. This high from a single temperature fit is not surprising, since we will see below that a strong temperature gradient is present in the X-ray emitting plasma. Absorption intrinsic to the source was also required by the fit, with a value of .
3 Results
3.1 X-ray morphology and surface brightness
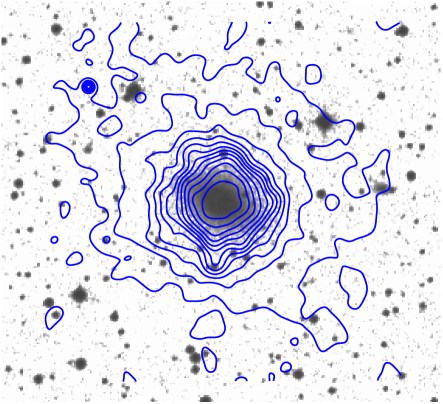
The diffuse 0.3-2 keV X-ray emission, (see Fig 2), shows a rather relaxed X-ray morphology in the core of the group. For the production of this image, point sources were removed, the background subtracted, and the binned image adaptively smoothed and corrected using the exposure map. The X-ray contours in the central region are circularly symmetric but the outer region shows a moderate NE-SW elongation.
3.1.1 Hardness ratio map
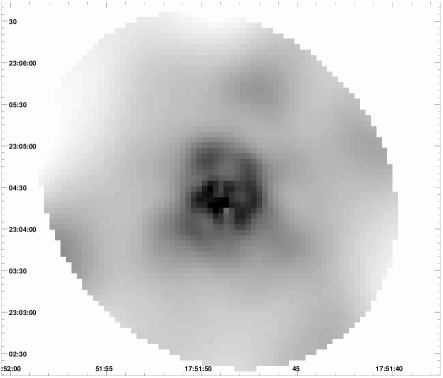
To study any possible substructure and its significance, a hardness ratio map was obtained by dividing the adaptively smoothed diffuse emission image in a hard band by that in a soft band. The soft image contains photons with energies from 400 eV to 900 eV. The hard image consisted of photons with energy ranging from 900 eV to 2 keV. We replaced the point sources by their surrounding counts before smoothing the hard band binned image using the task in CIAO . The same scale map is then used to smooth the soft band image as well as the associated background and exposure map images (i.e. all these are smoothed in an identical way). Before deriving the hardness ratio map, the corresponding backgrounds were subtracted from the soft and hard images. The hardness ratio map is limited to the central 3 arcmin radius, Fig. 3, due to the limited S/N. The relatively uniform and circularly symmetric distribution of the hardness ratio suggests that the system is relatively relaxed and has not experienced a violent or strong perturbation recently, as caused by mergers and starforming activity. Small scale features at the centre of the map are found to be at the noise level and most likely due to the unresolved point sources or inaccurate replacement by local diffuse emission after point source removal . We therefore assume that the system is spherically symmetric and is in hydrostatic equilibrium.
3.1.2 Gas density profile
The radial surface brightness profile extracted from the inner 200 arcsec of the 0.3-2.0 keV image, was fitted using a one-dimensional -model,
| (1) |
where and are the core radius and index, and the central surface brightness.
Under the assumptions of spherical symmetry and isothermal gas, the above surface brightness profile implies a 3-dimensional gas number density density distribution given by
| (2) |
Fitting the -model given by equation 1, excluding the central point source, we found and core radius, arcsec, but the reduced was large, 7.5. Excluding 5 arcsec from the central region improved the by factor of 2 but it is still far from a good fit to the surface brightness at the central region of the system which is crucial in the estimation of other physical quantities such as mass and gas density.
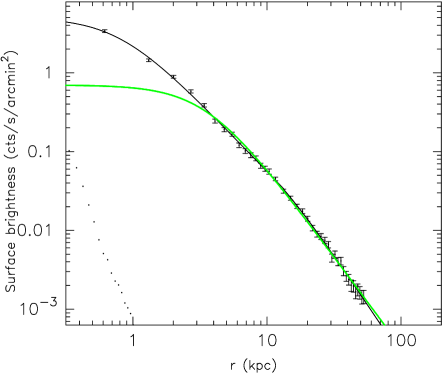
Thus we used a double model where an isothermal -model is fit separately to the inner and outer regions of the radial surface brightness distribution The surface brightness in this case is given by
| (3) |
The surface brightness, and its slope, from the above equations must be continuous at the cut radius, , which itself is chosen to minimise . In addition, the continuity of the gas density derivative must be met in order to derive a unique mass at . These constraints (Pratt & Arnaud, 2002) were directly applied while fitting the model in Sherpa.
The results from this fit are arcsec and with arcsec. For comparison, a ROSAT study of the system (Sanderson et al., 2003) gave a value =0.48, and a poorly constrained core radius of 13 arcsec. Fig. 4 shows the radial fit to the surface brightness profile from the double -model excluding the central point source. The gray profile represents the single -model fit to the surface brightness profile when the central 5 arcsec is excluded. The obvious improvement in the fit is also quantified by the reduced of 0.9.
The central gas density is required to fully describe the distribution of the gas distribution. This can be obtained from spectral analysis of a reasonably large region around the centre. The method is described in the following section and further by Maughan et al. (2003).
3.2 Spatially resolved spectroscopy
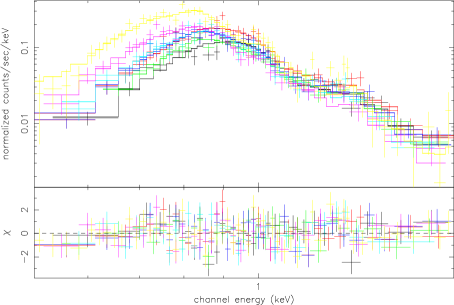
An absorbed hot plasma APEC model was fit to spectra extracted from 7 annuli extending to a radius of 150 arcsec. The annuli were chosen to contain 1000 to 1100 net counts, excluding point sources. The spectrum of each annulus was rebinned to contain a minimum of 20 counts per bin to increase the S/N. The Ancillary Response File (ARF), representing effective area as a function of photon energy, was calculated for each annulus since it varies across the chip. Due to the extra absorption introduced to the low energy band, because of the hydrocarbons built up on the CCDs since the telescope launch, an additional correction was needed. This correction was applied to each individual ARF. The Redistribution Matrix File (RMF), which is used to map the photon energy to pulse height, was also obtained for each annulus. Since the X-ray emission covers the entire chip, spectra of the background were extracted for each annulus from the same region of the blank sky observations.
The absorbed APEC model was fit to the extracted spectra from 7 annuli. APEC gave a better fit to the data compared to other hot plasma models such as MEKAL. The innermost region fitted with a relatively high reduced , and hence more complex models were investigated, as discussed in Section 3.2.2. With the current data we are not able to constrain the abundances even when a large region is chosen. Thus we assume a similar abundance for all the annuli resulting in a value of Z= Z⊙ in XSPEC’s default, ANGR, system (Andres & Grevesse, 1989). Intrinsic absorption was again required in the fits.
To correct for the effect of projection, de-projection was performed in XSPEC using PROJCT model. The reduced from the fit to the 7 spectra simultaneously was found to be 1.01 with 248 degrees of freedom. The PROJCT model fit to the spectra from all annuli is shown in Fig. 5. Bolometric luminosities and intrinsic absorption of the shells are presented in Table 1. The intrinsic absorption is consistent with zero in the outermost annuli, as expected if it is associated with the galaxy.

In order to derive the central gas density, a circular region with a radius of arcsec was chosen and an APEC model was fit to the extracted spectrum. The APEC normalisation is defined as:
| (4) |
where is the angular distance to the source. With the -model fitted to the inner region we calculate the integral which is now written as the following:
| (5) |
where and assuming that . Knowing the APEC normalisation from the spectral fit, we found the central hydrogen nummber density, cm-3. The value of cm-3 (see equations 3) was then obtained from the continuity of the density at arcsec.
The above calculations are based on the assumption that the emissivity of the gas simply scales as density squared. Given the steep temperature gradient, this is not obviously justified. However, at these temperatures, emissivity is not a strong function of temperature. In order to estimate the effect of temperature variations on the value of electron density, we calculate the electron number density directly from the emission of each shell (section 3.3) and compare with the model 3D electron number density obtained from the double -model fit. Fig 6 shows that the measured electron density is in reasonable agreement with that obtained from the -model analysis.
3.2.1 Temperature profile
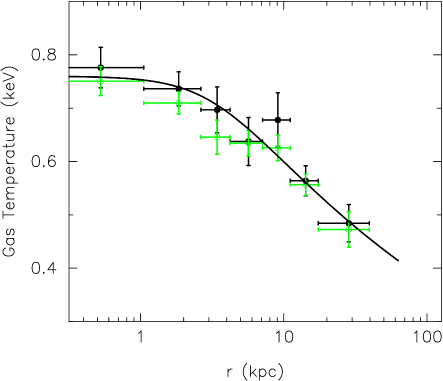
Fig. 7 shows the annular and de-projected temperature profiles out to 150 arcsec. The temperature profile shows a drop outward reaching 0.63 of its central value at a mean radius of 29 kpc. It is useful to have an analytical temperature profile, which can be used to derive the entropy profile. We adopt a polytropic model:
| (6) |
where and are the same parameters as one obtains from a -model to the surface brightness profile. We fixed at an average value of 0.53, from the inner and outer regions, and fitted the polytropic temperature profile, equation 6, with the core radius and exponent as free parameters. We found and arcsec. The profile is presented in Fig 7.
3.2.2 Central annulus and the point source
The innermost region gave a poor spectral fit. Here we investigate two possible causes. The temperature profile shows no sign of cooler gas in the central region, contrary to many X-ray groups of similar mass (Helsdon & Ponman, 2000a; Sun et al., 2003; Mushotzky et al., 2003). Since the point source detection routine found a point source at the centre of the galaxy in both low and high energy bands, we suspected that it might contain an active galactic nucleus (AGN). There is further motivation for this in the literature – Goudfrooij et al. (1994) found an flux of erg cm-2 s-1 in the core of NGC 6482.
To check whether a central point source could be contaminating our spectral fit in the innermost region, which extends to arcsec, we excluded the central 2 arcsec, which encompasses most of the point spread function of Chandra , and monitored the fit quality. We found no significant improvement in the fit compared to the original reduced of 1.12. The limited number of counts from the central point source does not permit any further analysis of a possible AGN component. An upper limit for the X-ray emission from the point source is estimated assuming a canonical AGN contribution (a power law spectral model with photon index=1.7) in the spectrum of the innermost region. The spectrum is consistent with a maximum AGN luminosity of ergs/s within 90% confidence interval (i.e. =2.71).
A second possibility is that gas in the high density core is cooling out. We therefore included a cooling flow component, and fitted the central annulus with an absorbed APEC+CFLOW model. This fitted with M⊙ yr-1 and a slightly increased intrinsic column of cm-2, giving an improved reduced of 1.03 with 30 degrees of freedom. The implications of this are discussed later in the paper.
| Annulus | mean radius | temperature | intrinsic | |
|---|---|---|---|---|
| (kpc) | (keV) | ergs/s | cm-2 | |
| 1 | 0.54 | 0.64 | ||
| 2 | 1.88 | 0.88 | ||
| 3 | 3.48 | 0.62 | ||
| 4 | 5.76 | 0.71 | ||
| 5 | 9.25 | 0.65 | ||
| 6 | 14.47 | 0.65 | ||
| 7 | 28.94 | 1.05 |
3.3 Entropy
The entropy of the X-ray emitting gas is defined here as:
| (7) |
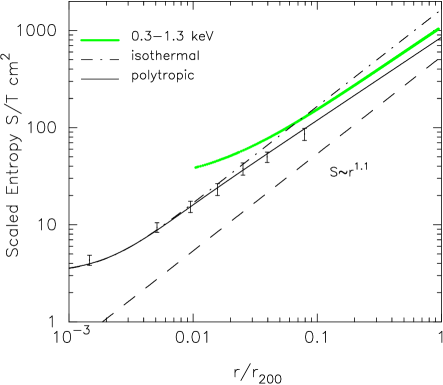
where is the electron density. The polytropic model described above was used to obtain the temperature at a given radius. Similarly the electron density was obtained from the the -model gas density profile. The resulting parameterised entropy profile, scaled by (where 0.66 keV is the mean temperature) to facilitate comparison with other groups and clusters, is shown in Fig 8 as the solid line.
For comparison with other systems, it is also useful to scale such profiles to the virial radius, defined here as the radius, , within which the mean total density of the system is 200 times the critical density of the Universe at the present time. In section 4.1 below, we will derive the value of from the present Chandra data, by extrapolating fitted models for gas density and temperature to derive a total mass profile. However, this involves an extrapolation of these models by a factor of in radius, beyond the extent of the Chandra spectral data which we fit. We therefore prefer (except in section 4.1) to use the value kpc, derived by Sanderson et al. (2003) from ROSAT spectral imaging data extending to a radius of 100 kpc, which has been derived excluding a large region at the centre, and this has been used to scale the x-axis in Fig 8.
To estimate the average entropy in each shell directly from the data, the density was obtained in the following way. The de-projected luminosity of each 3D shell was combined with the model emissivity at the shell temperature (and in the same energy band, 0.3-2.5 keV) and the shell volume , via:
| (8) |
to derive the electron density. This was then combined with the deprojected temperature, to give a spot value for the entropy. The resulting entropy values and their associated errors are presented in Fig 8, and agree well with the analytical curve. The dot-dash line shows the entropy profile assuming an isothermal model, and clearly overestimates the entropy outside the innermost regions, which is reduced by the steep decline in temperature.
Under the assumption of self-similarity of cluster properties, profiles should scale as , so we can compare directly with scaled models from simulations of rich clusters. Such simulations, as well as analytical models of spherical accretion onto clusters (Tozzi & Norman, 2001), predict entropy profiles with slope , outside a central region in which the profile may flatten. The dashed line in Fig 8 shows such a profile, normalised using simulations by Scott Kay (private communication) including only gravitational processes and shock heating. Clearly the entropy of the gas in NGC 6482 is substantially higher than would be expected from such self-similar scaling, as seems to be the case in all groups (Ponman et al., 2003).
The mean profile derived for a set of cool (0.3-1.3 keV) systems by Ponman et al. (2003) is also shown in Fig 8, and lies somewhat above the profile seen in NGC 6482. However, as has been pointed out by Sun et al. (2003) and Mushotzky et al. (2003), a large amount of scatter is seen in the entropy within galaxy groups. Comparison with other entropy profiles of poor groups based on data from XMM-Newton and Chandra , is instructive. Converting where necessary to km s-1 Mpc-1, the result for (0.1) reported for NGC 1550 ( keV) by Sun et al. (2003) is 120 keV cm2, whilst Mushotzky et al. (2003) find values of 107 keV cm2 and 250 keV cm2 respectively in NGC 4325 ( keV) and NGC 2563 ( keV). The entropy of NGC 6482 at the same normalised radius is keV cm2, which is lower than any of the above.
However NGC 6482 is cooler than these other groups. Ponman et al. (2003) find that the entropy scaling law in groups and clusters is well represented, on average, by , rather than the self-similar relation . Applying a scaling to the four groups discussed above, we find that NGC 6482 has a scaled entropy well below that of NGC 2563, but slightly higher than NGC 1550 and NGC 4325.
A striking feature of the profile in Fig 8, compared to the entropy profiles seen in most simulations, or in the averaged observational profiles derived by Ponman et al. (2003), is the absence of any significant core to the entropy distribution. The entropy appears to drop all the way into the centre, to the limit of the resolution of our Chandra data, corresponding to r200. Similar behaviour was reported in NGC 1550 by Sun et al. (2003), however, in NGC 1550 the temperature drops inside 0.05r200, so that the continuing entropy decline could be due to the effects of radiative cooling, whilst in NGC 6482 the temperature rises continously into the centre.

3.4 Gas cooling time
The cooling time of the gas was calculated by dividing the total thermal energy of each shell by the associated de-projected luminosity. The resulting profile is presented in Fig. 9. The cooling time of the entire core, within 0.1, is less than a Hubble time, and it drops to years within the region resolved by Chandra .
4 Gas and total mass profiles
We use the gas density profile and temperature profile to derive the gas and total gravitational mass of the system assuming hydrostatic equilibrium and spherical symmetry. The total mass is given by:
| (9) |
where G and are the gravitational constant and proton mass and .
It is straightforward to derive an analytical description of the mass distribution using our analytical expressions for density and temperature. However estimating the error in the mass for the data points is not similarly simple, since there are contributions from uncertainties in both temperature and density, and the constraints of physical validity should ideally be taken into account.
Neumann & Böhringer (1995) have suggested a Monte-Carlo method to derive the empirical mass profile and the associated errors. The gravitational mass consists of two parts. One is the variation in gas density, and the other is that of the temperature, . For the latter we have generated 1000 physical temperature profiles with a temperature window of 0.05 keV and step size of 8 arcsec within the observed temperature range. A physical temperature is one which guarantees a monotonically increasing mass with radius. In this simulation the density profile parameters were fixed at the values from the -model fit. In order to estimate the contribution of the density variation () to the mass error, the surface brightness profile at the location of each data point was fitted with as the free parameter instead of . The error was estimated at the 68% confidence level using the error matrix provided by the fitting program. We checked the results by monitoring the variation. In this experiment the values of other parameters were optimised. The total error in the mass at each data point was then derived by adding the two uncertainties quadratically.
4.1 NFW mass profile and concentration
Motivated by the results of numerous cosmological N-body simulations, we attempt to fit a NFW profile (Navarro et al., 1995)
| (10) |
to the total gravitational mass density. We can then obtain the following integrated mass profile for a spherical mass distribution,
| (11) |
where is the density at . The mass concentration parameter can then be defined as . By definition, is the radius at which the mean gravitational mass density is 200 times the critical density, . For our assumed cosmology (=0.3, =0), the critical density is .
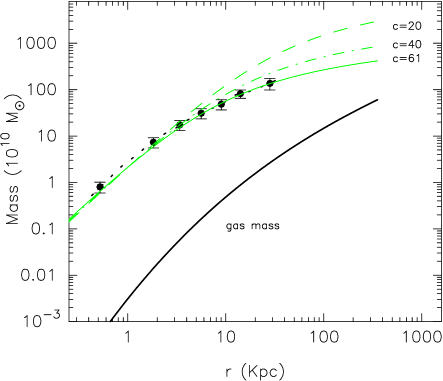
We fit the NFW mass profile, equation 11, to the data presented in Fig 10 to obtain and derive the the mean density profile. The best fit profile has kpc, and is shown in Fig 10 as a thin solid line. is then calculated by extrapolating the profile to 200 . This gives kpc, which is consistent within errors with the value of kpc derived from ROSAT data by Sanderson et al. (2003), and used elsewhere in the present paper. The extrapolated total mass at is M⊙.
This best fit profile therefore has a concentration parameter , which is remarkably high. For comparison, Fig 10 also shows NFW mass profiles with concentration parameters of 40 and 20. These are clearly inconsistent with our data.
4.2 Gas fraction
The integrated gas mass can be simply derived by integrating the gas density (equation 2), and the result is shown in Fig 10. The most reliable measure of the gas mass fraction is that within a radius of , since the temperature profile and hence total gravitational mass is limited to this radius. We found . A similar gas fraction is seen in NGC 1550 (Sun et al., 2003) and NGC 4325, but is significantly higher than that found in NGC 2563 (Mushotzky et al., 2003). Extrapolating implies a gas fraction which rises to 0.05 at 0.3, approximately double the typical value derived at this radius for cool systems by Sanderson et al. (2003).
If we make a major extrapolation (factor of five for our surface brightness data, which primarily determines the gas density, and factor 10 for our spectral data, which are required to constrain total mass) of our models to , we derive a total gas mass , and infer a gas fraction . The latter is at least as large as that seen in rich clusters, and certainly considerably higher than that normally reported for galaxy groups.

4.3 Mass to light ratio profile
With the high spatial resolution of the Chandra data, it is possible to derive the mass-to-light ratio profile in the core of the system. We analysed archived R-band CCD imaging data from the 0.9m JKT to model the cumulative luminosity profile of the brightest group galaxy. The photometric accuracy, based on calibration using five nearby stars in the field, was 0.1 mag.
Fig 11 shows the cumulative mass-to-light ratio profile within . To obtain a continuous profile (the solid curve), we divided the fitted NFW mass profile by a numerical model fitted to the R-band luminosity of the galaxy.
The profile shows a rapid rise in mass-to-light ratio with radius in the central 5 kpc. Taking into account the luminosity of the other known group members, the mass-to-light ratio in the R band at rises to . This is equivalent to 8615 in the B band, assuming colours of a typical elliptical. This value is within the scatter of the mass-to-light ratios found by Sanderson & Ponman (2003) for groups and clusters, and is significantly smaller than the R-band mass-to-light ratios of 250-450 found by Vikhlinin et al. (1999) for similar systems. The Vikhlinin et al. (1999) mass measurements were based partly on temperature estimates from an relation, and are thus less reliable than our mass measurements based on an accurate temperature profile.
5 Scaling relations
The X-ray scaling relations of groups differ from those of clusters. Here we investigate whether this fossil group follows the scaling relations of groups, or whether it supports the suggestion of Jones et al. (2003), that there are significant differences between fossil groups and normal groups.
5.1 X-ray luminosity
From the spectral analysis we find the total X-ray luminosity, 0.5-8.0 keV, to be ergs/sec within . Beyond this the total X-ray luminosity of the group has been estimated by extrapolating the surface brightness profile from the -model fit to . We find ergs s-1 within .
5.2 The relation
The brightest group galaxy has a total R-band luminosity of , based on our analysis of the archived JKT observation. This means that NGC6482 follows the same trend as the six other fossil groups studied in Jones et al. (2003), in having an X-ray luminosity significantly higher than normal groups of the same optical luminosity.
The high X-ray luminosity in NGC 6482 is clearly due to the high gas density and is not a result of a high mass-to-light ratio. The central density of 0.150.06 cm-3 is higher than that in any group or cluster in the compilation of Sanderson et al. (2003).
5.3 The relation
Jones et al. (2003) found that two of their fossil groups were overluminous compared to the expectations from the cluster relation, in contrast to the majority of groups which may be underluminous compared to the cluster relation. With an overall temperature of 0.7 keV the NGC 6482 system falls within the scatter of previous measurements of the group - relation (Mulchaey & Zabludoff, 1998; Helsdon & Ponman, 2000b) and is not significantly offset. Thus not all fossil groups are offset from the - relation. A possible explanation may be that the NGC 6482 system was essentially optically selected, whereas the Jones et al. (2003) systems were X-ray selected, and their study may therefore have preferentially selected high fossil groups.
6 Discussion and Conclusions
In this section we first give a summary of the results from this detailed study of the nearest fossil group using high resolution Chandra data and discuss some of them in detail:
-
•
The system has extended X-ray emission similar to bright X-ray groups but the optical light is dominated by the central giant elliptical galaxy.
-
•
The uniform and circularly symmetric distribution of the hardness ratio suggests that the system is relatively relaxed with no sign of recent violent perturbation.
-
•
This is the first Chandra resolution observation of a relaxed system in which the temperature decreases continually outwards despite a central cooling time of only years.
-
•
In agreement with recent studies of low temperature systems, the entropy profile shows no flat core.
-
•
The Mass-to-light ratio is (R-band) at .
-
•
The mass concentration parameter has a remarkably high value of , suggesting an early epoch of formation.
The proximity of NGC 6482, coupled with the high angular resolution of Chandra , has allowed us to resolve the X-ray structure of the system in a way never previously achieved with any fossil group. We find that the high value of , in this fossil group at least, results from a very high central gas density (0.15 cm-3), whilst the mass-to-light ratio, measured accurately here, is not exceptional.
The internal absorption may be due to the substantial gas and dust inferred from optical data (Goudfrooij et al., 1994). We estimate a hydrogen column density of cm-2 based on the optical extinction, well below the absorption derived from our X-ray spectra. A plausible explanation may be the presence of a diffuse ‘hot dust’ component in the central few kpc, as suggested by IRAS & ISO data in many ellipticals (Goudfrooij & de Jong, 1995; Ferrari et al., 2002). The small size dust grains of such a component would be undetected using optical extinction measurements.
The centrally-concentrated gas density profile, coupled with a profile which rises continuously into the centre of the group, implies a remarkably centrally-concentrated total density profile, with an NFW concentration parameter . This suggests that the system was formed at an early epoch, has been relatively undisturbed since, and thus reflects the high density conditions of the early Universe. Although N-body simulations involving cold dark matter predict that low mass systems such as NGC 6482 (we measure a total mass of about M⊙) should form before rich clusters, and hence have higher concentration parameters, the properties of NGC 6482 seem altogether exceptional. For example, Wechsler et al. (2002) identified a total of 14,000 halos in a cosmological simulation, and studied their properties. They found strong correlations between halo mass, formation epoch and concentration parameter, in the sense that lower mass halos tend to form earlier, and have higher . However, the highest values of for halos from their simulation, in the mass range 3- M⊙, was . Such halos formed (according to their definition of ‘formation time’, based on the rate of fractional mass growth) at a redshift 5.
How are we to understand the extremely high concentration of NGC 6482? It is possible that this is pointing to some deficiency in cosmological simulations. Some previous authors have reported surprisingly high values of , compared to those expected from simulations. For example David et al. (2001) found in the moderately rich cluster A780, which is three times greater than the expected value assuming a cosmology, and would require an abnormally early redshift of formation of . Pratt & Arnaud (2002) found a mass concentration of in their study of A1413 by fitting an NFW profile. Similarly they obtained for A1983 (Pratt & Arnaud, 2003). In the present case, at least, it is worth reflecting that the scale radius of 5.1 kpc lies well within the central galaxy, in a region where (c.f. Fig. 11) the stellar mass is the dominant component. Hence the scale radius, and the concentration parameter calculated from it, may be significantly affected by dissipative processes taking place in the baryonic component of the system. Such processes are known to be poorly modelled in cosmological simulations, where they are included at all. For example, it is quite conceivable that inflow of gas into the centre of NGC 6482, such as is believed to take place during galaxy mergers, could deposit large quantities of cooling gas in the inner regions of the galaxy, triggering a nuclear starburst and steepening the central mass density profile. Such processes may well have raised the value of subtantially, however the radius of the galaxy is only kpc, so we can have some confidence that the primordial scale radius must have been no larger than this, and therefore that the concentration parameter must have been high (20), indicating an early formation epoch for the system.
Thus the NGC 6482 system is an old group, giving sufficient time for dynamical friction to act on the most massive galaxies within the group, causing them to migrate to the centre, and merge to produce the giant elliptical galaxy NGC 6482, leaving no other luminous galaxies within 2 mag of the dominant galaxy.
As we have seen, the entropy of NGC 6482 at appears to be lower than the average for groups, but not outstandingly so, considering its low mean temperature. The most interesting feature is the way in which the entropy drops all the way into the central 1/2 kpc of the galaxy, where our observations become limited by the spatial resolution of Chandra . This conflicts directly with the expectations of simple preheating models (Evrard & Henry, 1991; Kasiser, 1991; Cavaliere et al., 1997; Balogh et al., 1999; Valageas & Silk, 1999; Tozzi & Norman, 2001) in which gas is placed on a high adiabat before the formation of the system, setting a lower limit (argued by Ponman et al. (1999) to be keV cm2) below which its entropy cannot drop, in the absence of significant cooling. Similar results have been reported recently by a number of authors (Ponman et al., 2003; Pratt & Arnaud, 2003; Sun et al., 2003; Mushotzky et al., 2003), however, in the case of NGC 6482, the behaviour is all the more striking, given that the temperature of the IGM rises continuously inward, so that the low central entropy cannot be attributed to the effects of cooling. It appears that simple global preheating models are no longer tenable, though this does not prohibit models in which local heating, either inside or outside forming groups and clusters, is responsible for breaking the similarity scaling between galaxy systems of different mass. Even NGC 6482 has an entropy profile which lies well above that expected from self-similar scaling of clusters.
Despite the fact that the entire core shows a cooling time less than the Hubble time, and in the innermost regions resolved by Chandra it drops to years, there is no evidence for any cooler gas at the centre of the galaxy. As a result of recent studies with XMM-Newton and Chandra (Peterson et al., 2001; Bohringer et al., 2002; Sakelliou et al., 2002; Peterson et al., 2003) it is now well-established that gas in the cores of most clusters does not appear to be cooling at the rates often inferred in the past. The reasons for this are still a topic of lively debate (Fabian et al., 2001). Despite the general lack of really cool gas, a decline by up to a factor -3 in temperature is commonly seen in the cores of clusters and groups. The lack of any decline at all in NGC 6482, immediately eliminates one suggested mechanism for counteracting central cooling. Thermal conduction (Voigt et al., 2002) cannot act to transport energy into the core against the temperature gradient, and so is ruled out. A highly inhomogeneous metallicity distribution (Morris & Fabian, 2003) can lead to a lack of lines from cool gas phases, and hence limit the apparent temperature drop in the central cooling regions, but it cannot suppress the signature of cooler gas altogether. Heating by cluster merging (Kempner et al., 2003; Gómez et al., 2002) can disrupt cooling gas, and inject energy which may suppress cooling for some time (Knight & Ponman, 1997), however it seems most unlikely that this could explain the situation seen in such an apparently old, relaxed system as NGC 6482, given the symmetric hardness ratio map.
Three sources of heating remain, which might help to offset the observed radiative energy losses ( erg s-1 from within the central 10 kpc). These are PdV work, supernovae and AGN. Given the highly peaked nature of the total density profile, gas will be subject to considerable work as it flows inward through the core of the system. To explore the effects of this, we seek a steady state cooling flow solution by solving the energy conservation equation (Fabian et al., 1984),
(12) where is the specific enthalpy and is the gravitational potential, coupled with mass conservation
(13) for the observed gas density (equation 2) and the gravitational potential inferred from our data, to calculate the temperature profile.
We fix the gas properties at the outer edge of our analysis (where the cooling time is approximately equal to the Hubble time) to match our observations, and seek for a value of which produces a profile matching that which we observe (Fig. 12), using the integral equation
(14) where kpc is the mean radius of the outermost shell and the constant of integration C is chosen to normalise the temperature profiles to the value observed at . A good match to our profile is obtained (Fig. 12) with M⊙ yr-1. Lower mass accretion rates, , result in a nearly isothermal core, whilst higher rates give too steep a profile. Under this steady state cooling flow model, the gas is heated by the gravitational work done on it as it flows inward, before cooling and dropping out at the centre of the galaxy. The spectral results shown discussed above in Section 3.2.2, do not disallow such a cooling component in the centre of the system – in fact, as we have seen, it actually improves the spectral fits.

Figure 12: Model temperature using the observed mass and gas density profiles for different mass accretion rates. The data point are the de-projected temperatures in Fig 7. Steady-state cooling flow models have fallen out of favour in recent years, as discussed above, and it is, of course, possible that some processes other than work are responsible for maintaining the steep temperature profile. Any steady-state solution other than that which we have derived above would have to involve distributed heating, since the gas must be prevented from cooling throughout the region we have analysed.
An obvious source of heating is supernovae (SN), which could be of type I and/or II. To estimate the contribution of SNIa, we use a total SN I rate of () per century per and an energy production of erg per supernovae (Cappellaro et al., 1999). This corresponds to erg s-1 L after correcting for the value of used in this study, giving an SNIa contribution of erg s-1. Hence SNIa could contribute a significant fraction of the erg s-1 radiated by the region under study.
Using the luminosity (Goudfrooij et al., 1994) and associated star formation rate, SFR(M⊙/yr-1)= LHα (erg s-1) (Cardiel et al., 2003), we estimate the SNII contribution assuming a SN rate times the star formation rate (Kawata, 2001), and an energy of erg per SN. This corresponds to a heat injection of erg , which is much smaller than the power required to replace the radiative losses.
The final source of heating which might play a role is injection of energy from an AGN. AGN heating is achievable either by Compton heating, mechanical heating or viscous dissipation of pressure waves generated by AGN (Ruszkowski et al. 2003). Binney & Tabor (1995) have argued that the last heating mechanism is most efficient. These authors, and several others, have shown that even a small fraction of AGN mechanical energy transferred to the ISM is sufficient to balance the radiative loss of energy via X-ray radiation. The bubbles and jets released from AGN are responsible for distributed heating, but it is important to note that in reality such processes take place in a non-steady fashion.
A key feature of our observations is the negative temperature gradient with radius. Heated cooling flow models are able to reproduce such a negative temperature gradient (e.g. Brighenti & Mathews (2002), but a detailed comparison is required before more definitive conclusions can be drawn. Thus a non-steady state solution remains a possibility. However for a steady state solution, we have shown that PdV work alone could generate a temperature profile similar to that observed in NGC 6482.
Acknowledgments
We would like to thank Ben Maughan and Andy Read for their advice during the data analysis, and Mark Voit and Scott Kay for results and insights relating to the scaling of entropy profiles from simulations. We are also grateful to Ewan O’Sullivan and Alastair Sanderson for their contributions to the early stages of this project. The authors thank the anonymous referee for suggestions that improved the presentation of the paper. We thank the Chandra observatory team. This research has made use of the NASA/IPAC Extragalactic Database (NED) which is operated by the Jet Propulsion Laboratory, Caltech, under contract with the National Aeronautics and Space Administration. The optical images have been retrieved from the Digitized Sky Survey.
References
- Andres & Grevesse (1989) Andres E. & Grevesse N., 1989, Geochimica et Cosmochimica Acta 53, 197
- Balogh et al. (1999) Balogh M. L., Babul A., Patton D. R., 1999, MNRAS, 307, 463
- Barnes (1989) Barnes J. E., 1989, Nature, 338, 123
- Binney & Tabor (1995) Binney J. & Tabor G., 1995, MNRAS, 276, 663
- Bohringer et al. (2002) Böhringer H., Matsushita K., Churazov E., Ikebe Y., Chen Y, 2002, A&A, 382, 804
- Brighenti & Mathews (2002) Brighenti F. & Mathews W. G. , 2002, ApJ, 573, 542
- Cardiel et al. (2003) Cardiel N., Elbaz D., Schiavon R. P., Willmer C. N. A., Koo D. C., Phillips A. C., Gallego J. 2003, ApJ, 584, 76
- Cappellaro et al. (1999) Cappellaro E., Evans R., Turatto M., 1999, A&A, 351, 459
- Cavaliere et al. (1997) Cavaliere A., Menci N., Tozzi P., 1997, ApJ, 484, L21
- David et al. (2001) David L. P. et al. , 2001, ApJ, 557, 546
- Evrard & Henry (1991) Evrard A. E.& Henry J. P., 1991, ApJ, 383, 95
- Fabian et al. (1984) Fabian A. C., Nulsen P. E. J., Canizares C.R., 1984, Nature, 310, 733
- Fabian et al. (2001) Fabian A. C., Mushotzky R. F., Nulsen P. E. J., Peterson J. R., 2001, MNRAS, 321, L20
- Ferrari et al. (2002) Ferrari F., Pastoriza M. G., Macchetto F. D., Bonatto C., Panagia N., Sparks W. B., 2002, A&A, 389, 355
- Gómez et al. (2002) Gómez P. L., Loken C., Roettiger K., Burns, J. O., 2002, ApJ, 569, 122
- Goudfrooij et al. (1994) Goudfrooij P., Hansen L., Jorgensen H. E., Norgaard-Nielsen H.U., de Jong T., van den Hoeck L. B., 1994, A&AS, 105, 341
- Goudfrooij & de Jong (1995) Goudfrooij P., de Jong T., 1995, A&A, 298, 784
- Hausman & Ostriker (1978) Hausman M. A., Ostriker J. P., 1978, ApJ, 224, 320
- Helsdon & Ponman (2000a) Helsdon S. F., Ponman T. J., 2000a, 315, 356
- Helsdon & Ponman (2000b) Helsdon S. F., Ponman T. J., 2000b, 319, 933
- Jones et al. (2003) Jones L. R., Ponman T. J., Horton A., Babul A., Ebeling H., Burke D. J., 2003, MNRAS, 343, 627
- Jones et al. (2000) Jones L. R., Ponman T. J., Forbes D.A., 2000, MNRAS, 312, 139
- Kawata (2001) Kawata D., 2001, ApJ, 558, 598
- Kasiser (1991) Kaiser N., 1991, ApJ, 383, 104
- Kempner et al. (2003) Kempner J. C., Sarazin C. L., Markevitch M. 2003, ApJ, 593, 291
- Knight & Ponman (1997) Knight, P. A., Ponman T. J., 1997, MNRAS, 289, 955
- Matsushita (2001) Matsushita K., 2001, ApJ, 547, 693
- Maughan et al. (2003) Maughan B. J., Jones L. R, Ebeling H., Perlman E., Rosati P., Frye C., Mullis C. R., 2003, ApJ, 587, 589
- Morris & Fabian (2003) Morris R. G., Fabian A. C., 2003, MNRAS, 338, 824
- Mulchaey & Zabludoff (1998) Mulchaey J. S., Zabludoff A. I., 1998, ApJ, 496, 73
- Mulchaey & Zabludoff (1999) Mulchaey J. S., Zabludoff A. I., 1999, ApJ, 514, 133
- Mushotzky et al. (2003) Mushotzky R., Figueroa-Feliciano E., Loewmnstein M., Snowden S. L., 2003, astro-ph/0302267
- Navarro et al. (1995) Navarro J. F., Frenk C.S., White S. D. M., 1995, MNRAS, 275, 56
- Neumann & Böhringer (1995) Neumann D. M., Böhringer H., 1995, A&A, 301, 865
- Peterson et al. (2001) Peterson J. R. et al. , 2001, A&A, 365, L104
- Peterson et al. (2003) Peterson J. R. et al. , 2003, ApJ, 590, 207
- Ponman et al. (1994) Ponman T. J., Allan D. J., Jones L. R., Merrifield M., MacHardy I. M., 1994, Nature, 369, 462
- Ponman et al. (1999) Ponman T. J., Cannon D. B., Navarro J. F., 1999, Nature, 397, 135
- Ponman et al. (2003) Ponman T. J., Sanderson A. J., Finoguenov A., 2003, MNRAS, 343, 331
- Pratt & Arnaud (2002) Pratt G. W., Arnaud M., 2002, A&A, 394, 375
- Pratt & Arnaud (2003) Pratt G. W., Arnaud M., 2003, A&A, 2003, 408, 1
- Romer et al. (2000) Romer A. K. et al. , 2000, ApJS, 126, 209
- Ruszkowski etal (2003) Ruszkowski M., Bruggen M., Begelmanetal M., 2003, astro-ph/0310760
- Sakelliou et al. (2002) Sakelliou I. et al. , 2002, A&A, 391, 903
- Sanderson et al. (2003) Sanderson A. J., Ponman T. J., Finoguenov A., Lloyd-Davies E. J., Markevitch M., 2003, MNRAS, 340, 989
- Sanderson & Ponman (2003) Sanderson A. J.& Ponman T. J., 2003, MNRAS, 345, 1241
- Smith et al. (2001) Smith R. K., Brickhouse N. S., Liedahl D. A., Raymond J. C., 2001, ApJ, 556, L91
- Sun et al. (2003) Sun M., Forman W., Vikhlinin A., Hornstrup A., Jones C., Murray S. S., 2003, ApJ, 598, 250
- Tozzi & Norman (2001) Tozzi P., Norman C., 2001, ApJ, 546, 63
- Valageas & Silk (1999) Valageas P. & Silk J., 1999, A&A, 347, 1
- Vikhlinin et al. (1999) Vikhlinin A., McNamara B. R., Hornstrup A., Quintana H., Forman W., Jones C., Way M. 1999, ApJ, 520, 1
- Voigt et al. (2002) Voigt L. M., Schmidt R. W., Fabian A. C., Allen S. W., Johnstone R. M., 2002, MNRAS, 335, L7
- Wechsler et al. (2002) Wechsler R. H., Bullock J. S., Primack J. R., Kravtsov A. V., Dekel A., 2002, ApJ, 568, 52