2003
Previously Claimed(/Unclaimed) X-ray Emission Lines in High Resolution Afterglow Spectra
Abstract
We review the significance determination for emission lines in the Chandra HETGS spectrum for GRB 020813, and we report on a search for additional lines in high resolution Chandra spectra. No previously unclaimed features are found. We also discuss the significance of lines sets reportedly discovered using XMM data for GRB 011211 and GRB 030227. We find that these features are likely of modest, though not negligible, significance.
1 I. Introduction
Multiple luminous X-ray lines have been claimed in spectra taken with XMM of 2 GRB afterglows. (GRB 011211, Reeves et al. (2002); GRB 030227, Watson et al. (2003)) The statistical significance of the GRB 011211 lines has been called into question by Rutledge & Sako (2003), and we address this question in Section IV. In Butler et al. (2003), we discuss high resolution spectra from Chandra for the X-ray afterglows to GRB 020813 and GRB 021004, and we report the discovery of moderately low significance spectral lines in the case of GRB 020813. Our detection (with an independent instrument) supports the claimed multiple line detections in XMM data, and the high spectral resolution facilitates a clearer determination of the line significances (see Section II). There are 3 additional bursts with high resolution Chandra spectra (GRB 991216, GRB 020405, and GRB 030328), which we have analyzed to search for discrete spectral features. Only the data for GRB 991216 yielded a claimed line detection in the literature (Piro et al., 2000). My collaborators and I analyzed the GRB 030328 data (Butler et al., 2003f; Ford et al., 2003; Butler et al., 2003g) and reported no line detections. Null detections for GRB 020405 are reported by Mirabal et al. (2002).
2 II. S and Si lines for GRB 020813?
In Butler et al. (2003), we describe our data reduction and continuum fits for the Chandra HETGS observation of GRB 020813 (and GRB 021004). We also describe our emission line search method which involves successively binning the spectral data by factors of 2 in order uncover deviations from the continuum fit. This procedure is sensitive to resolved emission lines. It allows for quick and easy determination of line significances, easily verified by Monte Carlo. One prominent emission line was found for GRB 020813. Considering the number of wavelength bins searched, we estimate a multiple-trial (i.e. blind search) significance for the line of . If the line is identified with the K transition in H-like S, a low significance line possibly due to the K transition in H-like Si can be identified. The significance of the pair turns out to be modestly better () than the significance of the S line alone (Butler et al., 2003).
Our S line significance determination agrees with the estimate made using the deprecated likelihood ratio test (see, e.g., Protassov et al., 2002). To check whether this fact is statistically meaningful, we apply Monte Carlo integration to establish the true distribution for the log-likelihood. We form simulated data sets using power-law model parameters (with Galactic absorption) drawn from the posteriori distribution (the distribution of model parameters given the observed data). Each data set is then fitted with this model, then with this model plus a Gaussian emission line. The number of iterations yielding larger improvements in than the observed value ( =15.5 for 3 additional degrees of freedom) is recorded. To ensure that the parameter space for the emission line is adequately explored in each Monte Carlo iteration, we use FFTs to determine the most significant line-like residual on a fine line centroid wavelength grid (Å) and line width grid (dyadic intervals from Å to Å). We find that 13 of runs yield a larger than the observed value, consistent with the significance estimates quoted above. We find consistent results independent of whether uniform or delta function priors are assumed on the power-law model parameters, indicating that the parameters are well constrained by the data.
3 III. Lines in Other High Resolution Chandra Spectra
| Afterglow Source | Lines Detected | Significance | ||
|---|---|---|---|---|
| GRB 991216 | Fe (I–XXVI) | 1 | ||
| GRB 020405 | Ar XVIII, Mg XI, Mg XII | 0.695 | ||
| GRB 030328 | Mg XI | 1.52 |
We apply the methods which led to the discovery of the lines for GRB 020813 to the 4 other high resolution spectra taken with Chandra of GRB X-ray afterglows (GRB 991216, GRB 020405, GRB 021004, and GRB 030328). We reduce the data as described in Butler et al. (2003), with the exception that we jointly fit the gratings data along with the 0th-order data, instead of fitting the gratings data alone, in order to best determine the continuum fits. The continuum fits and the line searches in the gratings data are described in detail in Nat Butler’s Ph.D. thesis (Butler, 2003). The results are shown in Table 1. No highly significant, previously unreported lines are detected, and the Fe line reported by Piro et al. (2000) is robustly detected with a multiple trials significance (conservatively) better than . This line is apparent in each of the 4 independent 1st-order HETGS spectra, and it is also seen in the 0th-order data. It is, in our opinion, the best case for an emission line in a GRB X-ray afterglow to date.
4 IV. The Significance of the XMM Multiple Lines
We reduce the EPIC-pn data for GRB 011211 following Reeves et al. (2002b), finding 537 net counts in the first 5 ksec of the observation. To search for emission lines, we employ the “matched filter” technique described in Rutledge & Sako (2003). We correct a number of minor errors in that work: (1) Rutledge & Sako (2003) base their significance estimates on model continua determined using fits of sparsely binned ( counts/bin) data. We find that the grouped data bin boundaries are not robust and that modest shifting can arise due to minor changes in the source and background selection regions. This shifting is sufficient to occasionally wash out the indication of line emission. We choose to fit continuum models to the unbinned spectrum. (2) Rutledge & Sako (2003) uniformly sample from a number of possible continuum models rather than sampling according to the posteriori distribution of possible models given the observed data. For example, in the case of fitting, our approach would suggest sampling from a model A in frequency relative to a model B as , assuming uniform priors on the model parameters. (3) Rutledge & Sako (2003) also unjustifiably increase the normalizations on their continuum models (relative to the best fit values) in order to force each to yield the total number of observed source counts.
We model the continuum emission as an absorbed power-law, with the absorption fixed at the Galactic value as in Reeves et al. (2002b). We apply the Markov Chain Monte Carlo (MCMC) algorithm described in Appendix B of van Dyke et al. (2001) to determine the distribution of null model parameters given the data in raw PI bins. The background is modelled using a broken power-law with a break at 1.35 keV as in Rutledge & Sako (2003). We consider a uniform (i.e. totally non-informative) prior distribution on each model parameter for the source and background counts. From models generated in the fashion, we simulate spectra and apply the matched filter of Rutledge & Sako (2003) to each.
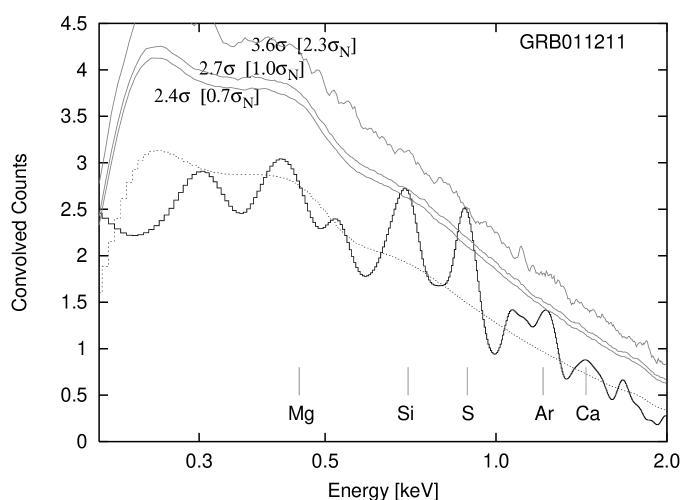
The first panel in Figure 1 shows the result of applying this filter to the observed data (dark line). The mean result from the simulated spectra is plotted as a dotted line. At the locations of the reported S, Si, and Ar emission lines (see, Reeves et al., 2002), the solid dark curve in the first panel of Figure 1 deviates from the mean at significance. The significance contour reached by each feature is plotted, and the individual (single-trial) significances of the lines are , , and . Generating an additional model sample parameters and reapplying the matched filter to the simulated spectra for each model, we count the number of times that a simulated model breaks through each significance contour between 0.2 and 2.0 keV. This allows us to determine that the multiple trials significances ( values in Figure 1) for the emission lines are , , and . The significance of the line set can then be estimated as 5 times the product of these probabilities (i.e. ), where the factor of 5 takes into account that the data have been analyzed in 5 time regions. This is higher than the value determined by Rutledge & Sako (2003), and it is lower than the initially suggested by Reeves et al. (2002).
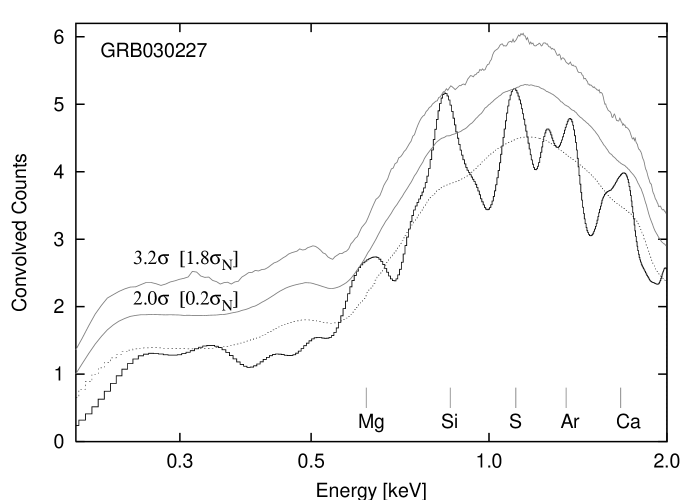
Recently, Watson et al. (2003) have claimed the detection of a line set in GRB 030227, remarkably similar to the detections claimed for GRB 011211 by Reeves et al. (2002). Watson et al. (2003) quote a significance determined solely via the likelihood ratio test (, depending on the number of degrees of freedom). We reduce the EPIC-pn data for GRB 030227 following Watson et al. (2003), finding 1593 source counts in the final 10 ksec of the observation. In our MCMC analysis, we describe the background counts as a power-law. The source counts are modelled as an absorbed power-law as in Watson et al. (2003). All model parameter prior distributions are taken as uniform. As displayed in the second panel of Figure 1, the claimed Mg, Si, and S lines have significances (single-trial). This data set is the last of 4 time slices within the observation. Performing the multi-trial significance calculation as above, we find the the significance of the line set is . Thus, we find that the line emission for GRB 030227 is less significant than that for GRB 011211. We stress that this significance estimate, like that made for GRB 011211 above, is a lower bound on the significance of the line emission. If the line centroids can be argued to be constrained by the physics, as argued in Watson et al. (2003), then the significance would increase.
5 V. Conclusions
We conservatively estimate the significances for line emission in GRB 991216 (Chandra), GRB 020813 (Chandra), GRB 011211 (XMM), and GRB 030227 (XMM) as , , , and , respectively. We do not find the line emission for GRB 011211 (which has galvanized many GRB researchers) to be entirely insignificant, as claimed by Rutledge & Sako (2003). However, we find none of the observations to be highly significant. Hopefully, early observations with Swift in the coming few years will decide conclusively whether this emission is real.
References
- (1)
- Butler et al. (2003) Butler, N., et al. 2003a, ApJ, 597
- Butler (2003) Butler, N., 2003, Ph.D. Thesis, MIT.
- Butler et al. (2003f) Butler, N. R. et al. 2003b, GCN, 2007
- Butler et al. (2003g) Butler, N. R. et al. 2003c, GCN, 2076
- Ford et al. (2003) Ford, P. G., et al. 2003, GCN, 2027
- Mirabal et al. (2002) Mirabal, N., et al. 2002, ApJ, 587, 128
- Piro et al. (2000) Piro, L., et al. 2000, Science, 290, 955
- Protassov et al. (2002) Protassov, R., et al. 2002, ApJ, 571, 545
- Reeves et al. (2002) Reeves, J. N., et al. 2002, Nature, 415, 512
- Reeves et al. (2002b) Reeves, J. N., et al. 2003, A&A, 403, 463
- Rutledge & Sako (2003) Rutledge, S., & Sako, M. 2003, MNRAS, 339, 600
- van Dyke et al. (2001) van Dyke, D., et al. 2001, ApJ, 548, 224
- Watson et al. (2003) Watson, D., et al. 2003, ApJ, 595, L29