2004 \SetConfTitleCompact Binaries in the Galaxy and Beyond \suppressfulladdresses \addkeywordStars: binaries: eclipsing \addkeywordStars: common envelope \addkeywordStars: evolution \addkeywordStars: individual: AA Dor \addkeywordStars: low-mass, brown dwarfs
AA Dor — An Eclipsing Subdwarf – Brown Dwarf Binary
AA Dor is an eclipsing, close, post common-envelope binary (PCEB) consisting of a sdOB primary star and an unseen secondary with an extraordinary small mass () – formally a brown dwarf (see Rauch 2004 for details). In a spectral analysis of AA Dor, Rauch (2000) determined kK and (cgs). The determination of the components’ masses by comparison of these results with evolutionary models of Driebe et al. (1998) shows a discrepancy to masses derived from radial-velocity and the eclipse curves (Hilditch et al. 2003) – would be necessary in order to achieve an intersection at .
Possible reasons for this discrepancy may be too optimistic error ranges in Rauch (2000) or in the analysis of light curve and radial-velocity curve, or that the evolutionary models of Driebe et al. (1998) are not appropriate in the case of AA Dor since these are post-RGB models for non-CE stars.
Since the decrement of the hydrogen Balmer series is a sensitive indicator for , 107 high-resolution échelle spectra with short exposure times (180 sec) have been taken in Jan 2001 with UVES (UV-visual échelle spectrograph) attached to the ESO VLT. Additional medium-resolution longslit spectra have been taken at the 2.3m telescope at SSO in Sept 2003 with the DBS (double beam spectrograph). However, the analysis of both, the UVES spectra (Rauch & Werner 2003) and the DBS spectra, shows that a higher than 5.2 results in a worse fit to the observation.
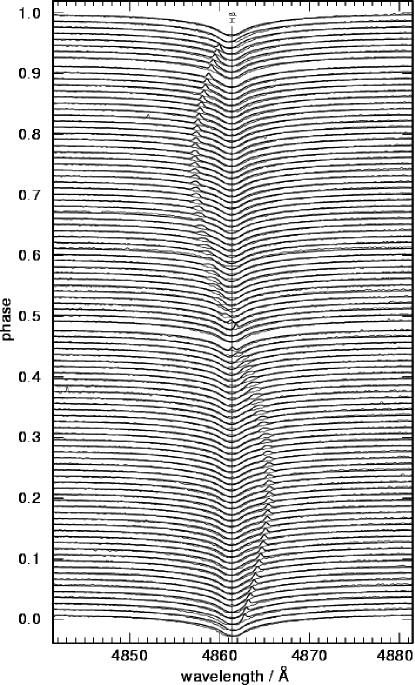
Since the secondary is heated by irradiation of the primary up to , one can expect a weak H emission in the UVES spectra. However, we do not find any signature of the secondary. The emission in the line core of H (Fig. 1) comes clearly from the primary, its phase dependence is likely due to an irradiation effect of the heated secondary on the primary which increases its by , i.e. the primary – taken as an isolated star – would have only , resulting in a % smaller mass. A phase-dependent spectral analysis is presently performed in order to investigate on this effect. It appears possible that this is one of the main reasons for the disagreement in the mass-radius relation described above.
References
- (1) Driebe, T., Schönberner, D., Blöcker, T., & Herwig, F. 1998, A&A, 339, 129
- (2) Hilditch, R.W., Kilkenny, D., & Lynas-Gray, A.E., Hill, G. 2003, MNRAS, 344, 644
- (3) Rauch, T. 2000, A&A, 356, 665
- (4) Rauch, T. 2004, Ap&SS, in press
- (5) Rauch, T., & Werner, K. 2003, A&A, 400, 271