FUSE Observations of Galactic and Intrinsic Absorption in the Spectrum of the Seyfert 1 Galaxy 2MASX J21362313-6224008111Based on observations made with the NASA-CNES-CSA Far Ultraviolet Spectroscopic Explorer. FUSE is operated for NASA by the Johns Hopkins University under NASA contract NAS5-32985.
Abstract
We present the far-ultraviolet spectrum of the Seyfert 1 galaxy 2MASX J21362313-6224008 obtained with the Far Ultraviolet Spectroscopic Explorer (FUSE). The spectrum features absorption from Galactic O VI at two velocities and redshifted H I Lyman and , C II, C III, and O VI. The redshifted absorption features represent a single kinematic component blueshifted by km s-1 relative to the AGN. We use photoionization models to derive constraints on the physical parameters of the absorbing gas. An alternative interpretation for the absorption lines is also proposed, whereby the absorbing gas is associated with an intervening galaxy cluster.
1 INTRODUCTION
A large fraction of Seyfert 1 galaxies exhibits intrinsic UV absorption associated with the active galactic nucleus (AGN). The absorption lines are commonly blueshifted with respect to the source, indicating that the absorbing material undergoes a net radial outflow (e.g., Crenshaw et al. 1999). The absorbing material is interpreted as photoionized gas with ionization parameter and total hydrogen column density cm-2 (Kriss et al. 2000, 2003; Romano et al. 2002).
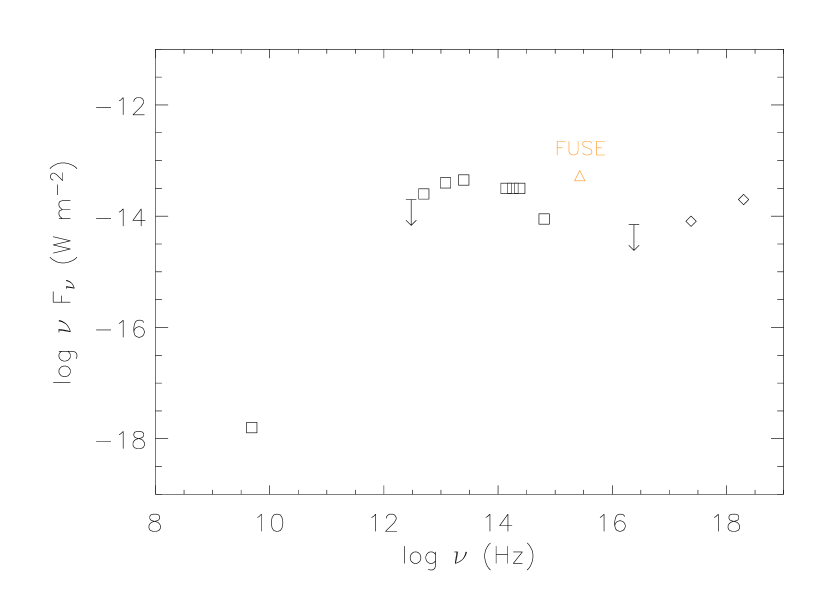
In this paper we present the results of a 37 ks observation of 2MASX J21362313-6224008, a Seyfert 1 galaxy with a measured redshift (Hewitt & Burbidge 1991) and visual magnitude V=15.2 mag (Remillard et al. 1986), with the Far Ultraviolet Spectroscopic Explorer (FUSE). The available X-ray HEAO-1 data of the source (also identified as 1H2129-624 and H2132-626) were analyzed by Remillard et al. (1986), who derive a luminosity erg s-1, which is on the bright end of the quasar luminosity function (George et al. 2000). The object was observed in soft X-rays by ROSAT; the ROSAT All-Sky Bright Source Catalogue (Voges et al. 1999) and the ROSAT Bright Survey (Schwope et al. 2000) detect a strong X-ray source at the location of our target, which is identified as 1RXS J213623.1-622400. (Its quoted X-ray flux may be contaminated by up to 10% by the faint source 1RXS J213530.1-623005 approximately 12 arcmin to the southwest.) EUVE observed the source during its All-Sky Survey, but the short exposure time resulted only in an upper limit (Marshall et al. 1995). The spectral energy distribution (SED) of 2MASX J21362313-6224008 is shown in Fig. 1.
2 OBSERVATIONS AND DATA REDUCTION
FUSE consists of four separate optical systems. Two employ LiF coatings and are sensitive to wavelengths from 990 to 1187 Å, while the other two use SiC coatings, which provide reflectivity to wavelengths as short as 905 Å. The four channels overlap between 990 and 1070 Å. For a complete description of the instrument, see Moos et al. (2000) and Sahnow et al. (2000).
The FUSE spectrum of 2MASX J21362313-6224008 (data set D9030401) was obtained in 10 separate exposures on 2003 May 25-26. The total integration time was 37 ks, of which 12 ks were obtained during orbital night. All observations were made through the 30″ 30″ (LWRS) aperture. The data were reduced using version 2.4 of the CalFUSE calibration software pipeline, described in The CalFUSE Pipeline Reference Guide222The CalFUSE Pipeline Reference Guide is available at http://fuse.pha.jhu.edu/analysis/pipeline_reference.html. (Dixon et al. 2003), but with the following modification: The first half of the pipeline, which corrects for time-dependent effects (such as spacecraft jitter) was run separately on each exposure. The resulting position-corrected photon-event lists were combined, using the program TTAG_COMBINE, into a single data file. The second half of the pipeline, which performs background subtraction and spectral extraction (among other tasks), was run on the combined data file. By thus using the entire data set to scale the background model, we optimize its fidelity, an important consideration for faint continuum sources.
The FUSE flux calibration, based on theoretical models of white-dwarf stellar atmospheres, is believed accurate to about 10% (Sahnow et al. 2000). Error bars are assigned to the data assuming Gaussian statistics. To increase their signal-to-noise ratio, we bin the spectra by four detector pixels, about half of a resolution element. The FUV spectrum of 2MASX J21362313-6224008 (2) shows a power-law continuum with a broad O VI emission feature at the redshift of the AGN. Selected spectral regions showing redshifted absorption features are presented in 3.
3 SPECTRAL ANALYSIS
Because the four channels are essentially independent spectrographs, they have different line-spread functions, and their data cannot be safely combined into a single spectrum. Instead, we use only the spectrum from the channel with the highest sensitivity at the wavelength of interest. We identify statistically-significant absorption features with a simple routine that bins each spectrum to the instrument resolution and flags regions whose flux lies more than three standard deviations below the local median. Most of these features are due to the interstellar medium (ISM) of our Galaxy, but a handful share the redshift of the AGN: Ly , C III , Ly , O VI , and C II (3).
Absorption-line profiles are modeled with the interstellar line-fitting package written by M. Hurwitz and V. Saba. Wavelengths, oscillator strengths, and other atomic data are taken from Morton (1991). Given a column density and Doppler broadening parameter, the program computes a Voigt profile for each absorption feature and produces a high-resolution (0.001 Å) spectrum of versus wavelength. The model spectra are convolved with a Gaussian of FHWM = 0.08 Å, roughly the spectral resolution of our data, and rebinned to 0.01 Å.
Model spectra are fit to the data using the nonlinear curve-fitting program SPECFIT (Kriss 1994), which runs in the IRAF333The Image Reduction and Analysis Facility (IRAF) is distributed by the National Optical Astronomy Observatories, which is operated by the Association of Universities for Research in Astronomy, Inc., (AURA) under cooperative agreement with the National Science Foundation. environment. SPECFIT performs a minimization of the model parameters. Error bars for a particular parameter are derived by fixing that parameter at the best-fit value, then raising it, allowing the other model parameters to vary freely, until is increased by 1, which corresponds to a 1 deviation for a single interesting parameter (Avni 1976).
We begin with the segment of the LiF 1A spectrum shown in the top panel of 3, which includes the redshifted Ly and C III lines and Galactic O VI absorption at two velocities. Comparison with data taken during orbital night (not shown) indicates that Ly is well separated from the geocoronal O I emission line. The redder O VI line is contaminated by =1 H2 absorption. Assuming a linear continuum over the wavelength region 1028.4–1038.6 Å, we model all nine species/velocity components labeled in 3. We constrain the depth of the H2 line by fitting two other =1 H2 lines in the 1049–1052 Å range simultaneously. Derived parameters for the Galactic O VI lines are presented in Table 1 and those for the redshifted features in Table 2.
To model the redshifted Ly feature, we use data from the SiC 1A channel (middle panel of 3), as the more sensitive LiF channels do not include this wavelength range. The Ly line falls between a pair of geocoronal emission features due to N II* . The pair of N II absorption features is interstellar. A comparison with the night-only spectrum (not shown) indicates that N II* does not contribute significantly to this spectrum and that the narrow peak on the blue shoulder of the N II* line is probably not geocoronal, but intrinsic to the target spectrum. Diffuse emission filling the LWRS aperture yields a line profile that is well approximated by a top-hat function with a width of km s-1. The N II* line is even broader, which also suggests that a second emission component is present. We model the region between 1081 and 1088 Å with a linear continuum, a pair of interstellar N II features, and a redshifted Ly line. We model the emission feature with a 106 km s-1 top hat and a narrow Gaussian. Derived parameters for the redshifted Ly line are presented in Table 2.
Finally, we turn to the redshifted O VI and C II features in the LiF 2A spectrum (bottom panel of 3). These features fall on the broad peak of the redshifted O VI emission feature, which is well fit by a linear continuum. The apparent absorption features at 1095.2 and 1098.5 Å are detector artifacts. The pair of Fe II lines represents absorption from two velocity components in the ISM of our Galaxy. This velocity structure is repeated in Fe II lines at longer wavelengths. As with the Galactic O VI lines, we fit both components of the O VI doublet simultaneously and quote a single set of derived parameters in Table 2.
If the absorbing cloud(s) cover only part of the emitting region, then our derived column densities are lower limits. Alternatively, if the absorption features that we have fit with a single velocity component are due to multiple unresolved clouds, then our derived column densities are upper limits. To investigate the importance of these effects, we calculate the covering fraction of the O VI-absorbing gas as a function of velocity by comparing the depths of the two components with their expected 2:1 ratio. Following the recipe given by Hamann (1997), we find that for the O VI-absorbing gas ranges from 0.5 to 1.0 across the line. Though the error bars are large, this range of values suggests that multiple velocity components are partially resolved in our data. A second velocity component fit to the O VI doublet is, however, significant at only the 2 level. We therefore assume a single velocity component with a covering fraction in the analysis that follows.
Misalignments among the four FUSE channels can lead to offsets in the wavelength scales of their spectra. To correct for such offsets, we measure the positions of ISM features in each spectrum and adjust their velocities to a common scale. Our standard is the LiF 1A spectrum, as data from this channel are used to guide the spacecraft. Specifically, we measure the Ar I lines in the LiF 1A spectrum, Ar I in SiC 1A, and Fe II in LiF 2A. Absolute velocities remain uncertain, however, because an offset in the position of the target relative to the center of the LWRS aperture can lead to a zero-point uncertainty in the FUSE wavelength scale of up to Å. This uncertainty is not included in our quoted error bars.
Though a detailed analysis of intrinsic emission in the spectrum of 2MASX J21362313-6224008 is beyond the scope of this paper, we can provide a brief description of the salient features. At long wavelengths, the continuum follows a power law of the form , where . There is a spectral break at the wavelength of Galactic Lyman , and the spectrum continues flat to the Lyman limit. The O VI feature that dominates 2 is well fit by a pair of broad O VI emission lines (FWHM = km s-1) and a pair of narrow O VI emission lines (FWHM = km s-1), where all lines are fit with Gaussian profiles. Our target is similar to NGC 3783 in that broad emission from Ly and higher-order Lyman lines is negligible (Gabel et al. 2003).
4 DISCUSSION
Derived parameters for the Galactic O VI lines are presented in Table 1, and those for the redshifted features in Table 2. The Lyman and lines yield consistent values for the redshifted H I column density and Doppler parameter . We adopt a value of H I cm-2 in our analysis.
4.1 Photoionization modeling
The redshifted H I, C II, C III, and O VI lines indicate the presence of ionized gas in the neighborhood of the AGN (e.g., Crenshaw et al. 1999) moving away from the central source with a speed of 310 km s-1 (Table 2). Photoionization models can be used to constrain the parameters of the absorbing gas. We use Cloudy v.94 (Ferland 1996) to calculate the fractional abundance of an element in a given ionization state, assuming the illuminating continuum described by the Cloudy “table agn” model, an absorbing gas with solar abundances and total hydrogen density H cm-3 and a grid of values for the total hydrogen column density 444The hydrogen density H) and column density include atomic and molecular hydrogen in all ionization stages, as defined in the Cloudy v.94 manual (Ferland 1996). In the present model, hydrogen is mostly in atomic form. and ionization parameter . The measured SED of 2MASX J21362313-6224008 (1) is consistent with the “table agn” model employed in the calculation; other studies (e.g., Romano et al. 2002) indicate that the use of other SEDs for the illuminating spectrum results in only minor changes to the derived values of and . We compare the column densities presented in Table 2 with the predictions of the photoionization model to constrain and in the absorbing gas.
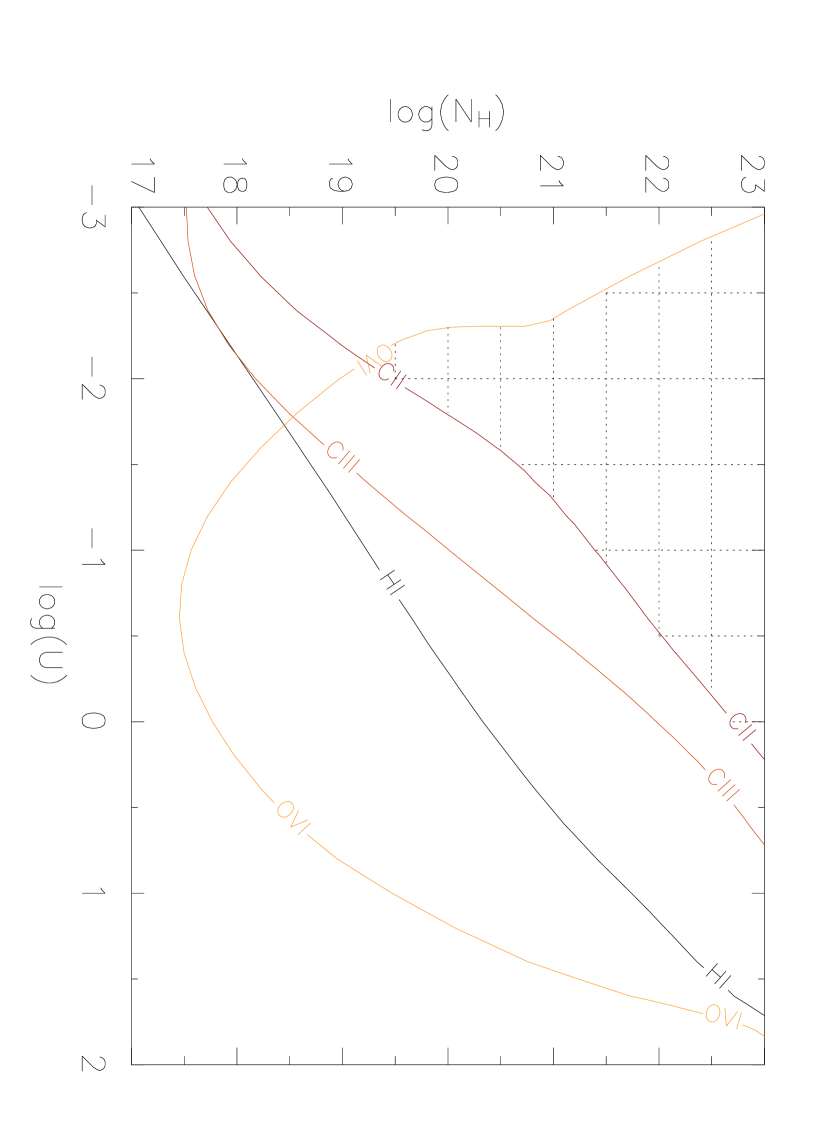
In Section 3, the covering fraction of the absorbing gas in 2MASX J21362313-6224008 was found to be , consistent with most other intrinsic UV absorbers in AGN (Crenshaw et al. 1999). Following Arav et al. (2001) and Romano et al. (2002), we plot curves of constant in the log()–log() plane in Fig. 4. If the absorbing gas covers only part of the emitting region, then is a lower limit and the allowed region of parameter space lies above all the curves in Fig. 4 (see Arav et al. 2001 for details). The total hydrogen column density of warm absorbers in Seyfert galaxies is usually lower than cm-2 (Kriss et al. 2000, 2003; Romano et al. 2002; Blustin et al. 2003). Given the constraints of Fig. 4, we tentatively place the UV absorber at , , keeping in mind that substantially higher column densities are not excluded by our data. Observations of other UV, optical, or X-ray lines are required to further constrain the state of the absorber in this AGN.
If the absorption is due to multiple velocity components, the assumption of a single, uniform cloud breaks down, and this model is not applicable.
4.2 Physical condition of the warm absorber
The ionization parameter is defined as , where is the number of ionizing photons ( 1 Ry), is the total hydrogen number density, is the speed of light, and is the distance of the illuminated face of the cloud from the central source. We use the measured 2-10 keV luminosity (3 erg s-1) in conjunction with the assumed “table agn” SED to derive a flux of s-1 ionizing photons for 2MASX J21362313-6224008.
Knowing , , and the density , one can derive the distance, size, and mass of the absorbing cloud. Our data provide no constraints on the density of the absorber — variability studies or other information such as imaging data are necessary to measure (e.g., Hamann et al. 1997; Crenshaw et al. 2002) — so we will continue to use the value H cm-3 assumed by the “table agn” model. Adopting the “best-guess” values of , derived above, we find that the illuminated face of the absorber lies pc from the central source. The size of the absorbing cloud is simply given by pc. Since for a wide range of hydrogen densities , the volume of the warm gas can be approximated as , and the mass of the warm absorber is .
4.3 An intergalactic origin for the absorption lines?
The line of sight to 2MASX J21362313-6224008 intersects several clusters of galaxies, two of which have measured redshifts: A3782 at and APMCC684 at . The difference in redshift between the measured absorption lines () and the two clusters is so small that an alternative interpretation of the absorption lines can be entertained, viz., the source shines through the foreground cluster(s), which cause the redshifted absorption lines.
The center of A3782 lies arcmin from 2MASX J21362313-6224008, which corresponds to approximately 1.8 Mpc (for a Hubble constant of km s-1 Mpc-1). The center of APMCC684 is 17.5 arcmin distant, which corresponds to 1.2 Mpc. Clusters of galaxies are known to host hot intergalactic gas ( K) – too hot to produce the observed absorption lines – and oftentimes a lower temperature phase ( K; Lieu et al. 1996a, b; Bonamente et al. 2002, 2003) that could contain substantial amounts of O VI, C II, C III, and neutral atomic hydrogen. This warm intergalactic gas has been observed in emission in several clusters (i.e., the “soft excess” phenomenon; Bonamente et al. 2002; Kaastra 2003; Nevalainen 2003), notably in the Coma cluster, where it extends some 2.6 Mpc from the cluster center (Bonamente et al. 2003). Detection of O VI absorption associated with the Local Group of galaxies has been recently reported by Nicastro (2003), and detection of an O VI absorption system associated with another galaxy group was reported by Tripp et al. (2000). Here we investigate the association of the detected absorption systems with the two galaxy clusters A3782 and APMCC684.
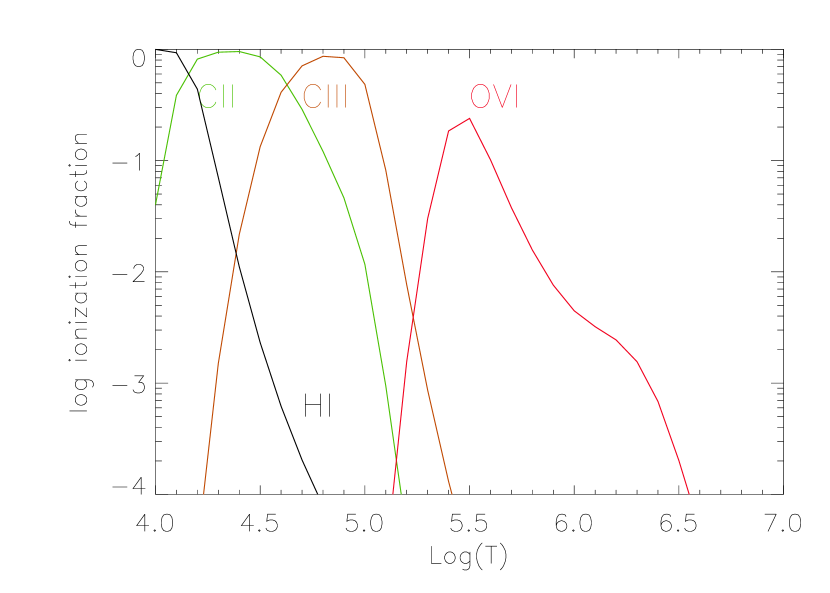
We use the soft excess measurements of Bonamente et al. (2003) for the Coma cluster to estimate the amount of low-ionization gas in clusters of galaxies. Several other clusters contain warm gas in amounts comparable (within a factor of a few) to those of the Coma cluster. The warm gas is generally more diffuse than the hot gas (Bonamente et al. 2002), and it could reside either inside the cluster (i.e., mixed with the hot gas) or in filamentary structures outside the cluster, as is often seen in hydrodynamical simulations (e.g., Cen & Ostriker 1999). If the warm gas is bound to the cluster, Bonamente et al. (2003) show that it must have a density of cm-3 throughout the cluster. Assuming a cluster radius of 3 Mpc, in agreement with current X-ray measurements, this density implies H I column densities of cm-2. The metal abundance of the warm gas is solar (Bonamente et al. 2003); this implies total carbon column densities of cm-2 and oxygen column densities of cm-2. Figure 5 shows the ionization fractions of the ions of concern as a function of temperature, assuming ionization equilibrium (Mazzotta et al. 1998). Column densities of H I, C II, C III, and O VI predicted by this scenario are therefore consistent, for a wide range of temperatures, with those detected toward 2MASX J21362313-6224008 (Table 2). The warm gas may alternatively reside in filamentary structures with densities of cm-3 (Davé et al. 2001). In this case, Bonamente et al. (2003) show that the filaments will extend for 10 Mpc outside the cluster, yielding similar ion column densities. In addition, the Doppler parameters of a warm gas at K are fully consistent with the values derived in Table 2 (Spitzer 1978), and similar to those of Tripp et al. (2000).
We conclude that the current data for 2MASX J21362313-6224008 are consistent with the redshifted absorption lines of Table 2 originating from warm gas associated with an intervening galaxy cluster.
5 CONCLUSIONS
We detect Galactic O VI absorption in the direction of 2MASX J21362313-6224008 and H I Lyman and , C II, C III, and O VI absorption at a redshift of . The redshifted absorption lines are consistent with a circumnuclear absorber outflowing with a relative velocity of km s-1. We derive constraints on its physical parameters through photoionization modeling. Alternatively, we suggest that the redshifted absorption may originate in or around a cluster of galaxies located along the line of sight.
References
- Avni (1976) Avni, Y. 1976, ApJ, 210, 642
- Arav et al. (2001) Arav, N., et al. 2001, ApJ, 561, 118
- Blustin et al. (2003) Blustin, A. J. et al. 2003, A&A, 403, 481
- Bonamente et al. (2002) Bonamente, M., Lieu, R., Joy, M. K., & Nevalainen, J. 2002, ApJ, 576, 688
- Bonamente et al. (2003) Bonamente, M., Joy, M. K., & Lieu, R. 2003, ApJ, 585, 722
- Cen & Ostriker (1999) Cen, R., & Ostriker, J. P. 1999, ApJ, 514, 1
- Crenshaw et al. (1999) Crenshaw, D. M., Kraemer, S. B., Boggess, A., Maran, S. P., Mushotzky, R. F., & Wu, C. 1999, ApJ, 516, 750
- Crenshaw et al. (2002) Crenshaw, D. M. et al. 2002, ApJ, 566, 187
- Davé et al. (2001) Davé, R. et al. 2001, ApJ, 552 163
- Dixon et al. (2003) Dixon, W. V., Kruk, J. W., & Murphy, E. M. 2003, The CalFUSE Pipeline Reference Guide
- Ferland (1996) Ferland, G. J. 1996, Hazy, a Brief Introduction to Cloudy, Univ. of Kentucky Dept. of Physics and Astronomy Internal Report
- Gabel et al. (2003) Gabel, J. R. et al. 2003, ApJ, 583, 178
- George et al. (2000) George, I. M., Turner, T. J., Yaqoob, T., Netzer, H., Laor, A., Mushotzky, R. F., Nandra, K., & Takahashi, T. 2000, ApJ, 531, 52
- Hamann et al. (1997) Hamann, F., Barlow, T. A., Junkkarinen, V., & Burbidge, E. M. 1997a, ApJ, 478, 80
- Hamann (1997) Hamann, F., Barlow, T. A. and Junkkarinen, V. 1997b, ApJ, 478, 87
- Hewitt & Burbidge (1991) Hewitt, A., & Burbidge, G. 1991, ApJS, 75, 297
- Kaastra (2003) Kaastra, J. S., Lieu, R., Tamura, T., Paerels, F. B. S. and den Herder, J. W. 2003, A&A, 397, 445
- Kriss (1994) Kriss, G. A. 1994, in ASP Conf. Ser. 61, Astronomical Data Analysis Software and Systems III, ed. D. R. Crabtree, R. J. Hanisch, & J. Barnes (San Francisco: ASP), 437
- Kriss et al. (2000) Kriss, G. A., et al. 2000, ApJ, 538, L17
- Kriss et al. (2003) Kriss, G. A., Blustin, A., Branduardi-Raymont, G., Green, R. F., Hutchings, J., & Kaiser, M. E. 2003, A&A, 403, 473
- Lieu et al. (1996a) Lieu, R., Mittaz, J. P. D., Bowyer, S., Breen, J. O., Lockman, F. J., Murphy, E. M., & Hwang, C.-Y. 1996, Science, 274, 1335
- Lieu et al. (1996b) Lieu, R., Mittaz, J. P. D., Bowyer, S., Lockman, F. J., Hwang, C., & Schmitt, J. H. M. M. 1996, ApJ, 458, L5
- Mazzotta et al. (1998) Mazzotta, P., Mazzitelli, G., Colafrancesco, S., & Vittorio, N. 1998, A&AS, 133, 403
- Mihalas & Binney (1981) Mihalis, D., & Binney, J. 1981, Galactic Astronomy: Structure and Kinematics, 2nd ed. (San Francisco: Freeman)
- Moos et al. (2000) Moos, H. W., et al. 2000, ApJ, 538, L1
- Marshall et al. (1995) Marshall, H.L., Fruscione, A., & Carone, T. E. 1995, ApJ, 439, 90
- Morton (1991) Morton, D. C. 1991, ApJS, 77, 119
- Nevalainen (2003) Nevalainen, J., Lieu, R., Bonamente, M. and Lumb, D. 2003, ApJ, 584, 716
- Nicastro (2003) Nicastro F. et al. 2003, Nature, 421, 719
- Remillard et al. (1986) Remillard, R. A., Bradt, H. V., Buckley, D. A. H., Roberts, W., Schwartz, D. A., Tuohy, I. R., & Wood, K. 1986, ApJ, 301, 742
- Romano et al. (2002) Romano, P., Mathur, S., Pogge, R. W., Peterson, B. M., & Kuraszkiewicz, J. 2002, ApJ, 578, 64
- Sahnow et al. (2000) Sahnow, D. J., et al. 2000, ApJ, 538, L7
- Schwope et al. (2000) Schwope, A., et al. 2000, Astron. Nach., 321, 1
- Spitzer (1978) Spitzer, L. 1978, Physical Processes in the Interstellar Medium (New York: John Wiley & Sons), 37
- Tripp et al. (2000) Tripp, T. M. and Savage, B. D. 2000, ApJ, 542, 42
- Voges et al. (1999) Voges, W., et al. 1999, A&A, 349, 389


| Velocity | Doppler Parameter | Column Density |
|---|---|---|
| (km s-1) | (km s-1) | (cm-2) |
Note. — Velocities are quoted relative to the local standard of rest (LSR; Mihalas & Binney 1981).
| Doppler | ||||
|---|---|---|---|---|
| Velocity | Parameter | Column Density | ||
| Feature | Redshift | (km s-1) | (km s-1) | (cm-2) |
| Lyman | 0.057760(7) | |||
| C III | 0.057783(5) | |||
| Lyman | 0.057770(15) | |||
| O VI | 0.057783(9) | |||
| C II | 0.057760(87) |
Note. — In column 2, the digits in parentheses represent the one-standard-deviation uncertainty in the final digits of the redshift. In column 3, velocities are quoted relative to the systemic velocity of 2MASX J21362313-6224008 ( km s-1).