Nucleosynthesis in The Oxygen-Rich Supernova Remnant G292.0+1.8 from Chandra X-Ray Spectroscopy
Abstract
We continue our analysis of the Galactic oxygen-rich supernova remnant (SNR) G292.0+1.8, which was observed with the Chandra X-ray Observatory. The high angular resolution Chandra data resolve metal-rich ejecta knots as well as the shocked circumstellar medium. X-ray emission from the ejecta material in G292.0+1.8 is dominated by highly ionized O, Ne and Mg. Measured abundance ratios suggest that this material was produced during the hydrostatic evolution of the massive progenitor star. In contrast to Cassiopeia A, there is little evidence for X-ray-emitting ejecta from explosive nucleosynthesis, i.e., material enriched in Si, S, and particularly, Fe. This limits the amount of mixing or overturning of deep ejecta material in G292.0+1.8 and suggests that the ejecta are strongly stratified by composition and that the reverse shock has not propagated to the Si/S or Fe-rich zones. On the other hand, the bright equatorial belt is dominated by X-ray emission with normal chemical composition, which supports shocked dense circumstellar material for its origin. We find that the thermal pressure in the SNR is much higher than the pressure in the pulsar wind nebula (PWN), indicating that the reverse shock has not yet begun to interact with the PWN.
1 INTRODUCTION
The Galactic supernova remnant (SNR) G292.0+1.8 (MSH 1154) is a source of strong oxygen and neon lines in the optical band and has been classified as an “oxygen-rich” SNR (Goss et al., 1979; Murdin & Clark, 1979). This abundance pattern is indicative of a core-collapse supernova (SN) from a massive progenitor. The small number of young O-rich SNRs, where the ejecta are not yet fully mixed with the ambient interstellar medium (ISM), may thus provide a rare opportunity for a detailed study of the SNR nucleosynthesis. For example, Hughes et al. (2000) have successfully performed such a study with a Galactic O-rich SNR Cassiopeia A, which revealed that explosive O- and Si-burning products from the deep interior of the massive progenitor dominate ejecta material in that SNR.
The unprecedented high angular resolution image of G292.0+1.8 obtained by the Advanced CCD Imaging Spectrometer (ACIS) on board the Chandra X-Ray Observatory has resolved the textbook-like structures in the SNR: the associated pulsar and its wind nebula (PWN), the metal-rich ejecta knots, the shocked circumstellar medium (CSM), and the blast wave shock front propagating into the ambient ISM (Hughes et al. 2001; Park et al. 2002, P02 hereafter). Earlier works (Hughes & Singh 1994; P02; Gonzalez & Safi-Harb 2003, G03 hereafter) have shown that G292.0+1.8 is dominated by O, Ne, and Mg line emission and identified a plausible mass for the progenitor star of 25 M⊙40 M⊙ based on either the integrated X-ray spectrum or spectra extracted over large emission regions. As a continuation of our previous image analysis (P02), we here report the results from our spectral analysis of G292.0+1.8. We take a different approach than the previous work by G03, in order to study several individual small-scale emission features which we demonstrate to be knots of pure or nearly pure SN ejecta. Comparisons of the abundance patterns in these knots to nucleosynthesis models allow us to trace their origin back to specific burning sites in the progenitor star, rather than global abundances averaged over the entire SNR. Although our investigation does not exhaustively present all emission features in the SNR, we do select a representative range of features based on the emission line equivalent width (EW) maps (P02). A description of the observation and the data reduction of the ACIS data can be found in P02.
2 Analysis
We corrected the ACIS data for charge transfer inefficiency (CTI; Townsley et al. [2000; 2002a]) and use detector response matrices generated by Townsley et al. (2002b) for the CTI-corrected data. The low energy ( 1 keV) quantum efficiency (QE) of the ACIS has degraded because of molecular contamination on the optical blocking filter. We corrected this time-dependent QE degradation by modifying the ancillary response function for each extracted spectrum, utilizing the IDL ACISABS software111For the discussion on this instrumental issue, see http://cxc.harvard.edu/cal/Acis/Cal_prods/qeDeg/index.html. The software was developed by George Chartas and is available at http://www.astro.psu.edu/users/chartas/xcontdir/xcont.html..
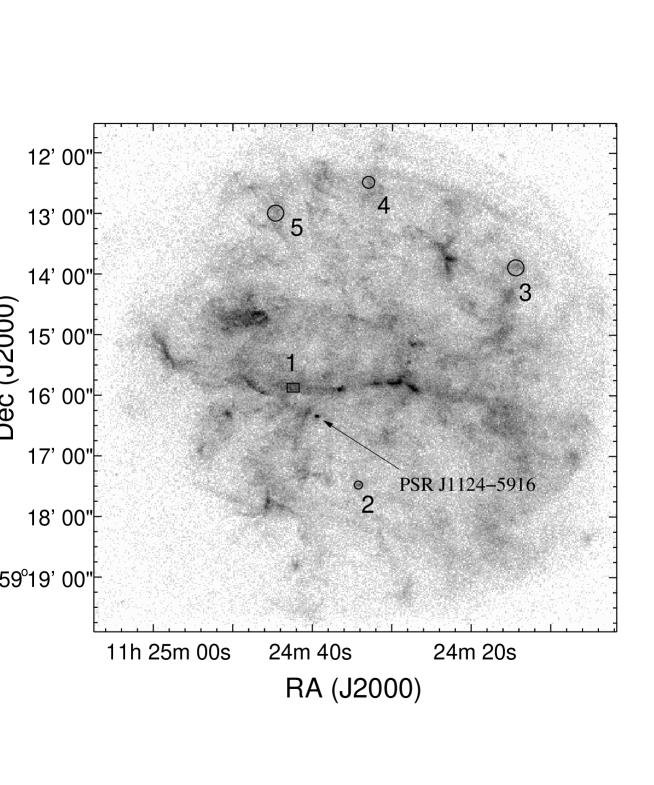
Based on the preliminary results from the color image and EW analysis by P02, we perform spectral analysis of small angular size features (typically 10′′ scales) across the SNR. We find that several regional spectra (Figure 1) represent the range of spectral characteristics seen in the SNR (P02). These selected regions are also morphologically well-defined in both the color image and the EW images and contain comparable photon statistics. We subtracted background spectra from source free regions of the detector. Each spectrum was binned to contain at least 20 counts per channel and fitted in the 0.5 4 keV band. We fixed the abundances for elemental species He, C, N, and Ni at solar (Anders & Grevesse, 1989), because contributions from these elements to the X-ray spectrum in the fitted bandpass are small. We allow other elemental abundances to vary freely. In the spectral fits described below, we use a non-equilibrium ionization (NEI) plane-parallel shock model (Borkowski et al., 2001) unless otherwise noted.
The bright equatorial belt of G292.0+1.8 appears to be dominated by X-ray emission from dense CSM produced by stellar winds from the massive progenitor as heated by the blast wave (P02). A typical spectrum of this bright central belt-like feature is represented by that of region 1. This regional spectrum contains 8500 photons and is best fitted with an NEI shock with electron temperature 0.7 keV (Figure 2; Table 1). The near-solar fitted abundances (Table 1) are consistent with the proposed circumstellar origin, rather than metal-rich ejecta.
On the other hand, the spectrum from region 2 shows remarkably different features (Figure 2). The region 2 spectrum contains 2000 photons, and is dominated by emission from the highly ionized Ly lines of Ne ( 1.05 keV) and Mg ( 1.48 keV), which unambiguously indicate emission from metal-rich ejecta. The strong Ne Ly and Mg Ly line emission indicates a high electron temperature and/or an advanced ionization state. In fact, the spectrum of region 2 can be described by a thermal plasma model in collisional ionization equilibrium (CIE) with an electron temperature of 0.8 keV. An NEI model can also fit the data with a higher electron temperature ( 5 keV; 1.5 1011 cm-3 s). With the current photon statistics, we cannot discriminate between these models. Nonetheless, strong enhancements in the O, Ne, and Mg abundances are present in either case. Although the statistical uncertainties are relatively large, O, Ne, and Mg abundances are evidently enhanced whereas Si, S, and Fe abundances are low (Table 1). The well-defined, compact morphology of this feature (angular size of 8′′ in diameter, physical size of 0.2 pc for a distance of = 6 kpc for G292.0+1.8 as recently determined by Gaensler & Wallace [2003]) allows us to employ a local background subtraction. We then find that this regional spectrum can be described with emission from only O, Ne, Mg, and Si with no contribution from underlying continuum other than that contributed by these species. This is likely a knot of pure metal ejecta.
The northern boundary of the SNR has a few knots of emission which appear to be clumpy ejecta material embedded in fainter diffuse emission (see Figure 1 in P02). These features are also strong in the EW images (P02). Spectra from these knots can be characteristically represented by those from regions 3, 4, and 5 (Figure 1). Regions 3 and 4 contain 6200 and 3700 photons, respectively, and are best fitted with a high temperature ( 3 5 keV) NEI plasma (Figure 3a; Figure 3b; Table 1). The metal abundances are highly enhanced, confirming that these knots are ejecta. Table 2 presents the abundances of O, Ne, and Mg relative to Si; these abundance ratios are much higher than solar ratios and are comparable to those in region 2. The region 5 spectrum is described with a low electron temperature of 0.6 keV (Figure 3c; Table 1), which is similar to that of region 1. The ionization timescale is significantly larger than those for regions 3 and 4. The best-fit abundances for all fitted elements are a few times higher than solar, but, unlike regions 2, 3, and 4, the abundance ratios with respect to Si are less enhanced (Table 2). Region 5 thus appears to be ejecta material that is relatively more enhanced in Si and S than other portions of the SNR.
3 DISCUSSION
X-ray spectra from regions 2, 3, and 4 unambiguously demonstrate characteristics of metal-rich ejecta, which are dominated by emission from highly ionized O, Ne, and Mg. Low-Z elements typically dominate the ejecta throughout the SNR, and we find little evidence of enriched heavier elements such as Si, S, and Fe. This is in striking contrast to the features discovered in Cas A in which strongly enhanced Si, S, and Fe abundances are present (Hughes et al., 2000). We have found only marginal evidence of Si- and S-rich ejecta in G292.0+1.8 (e.g., region 5). In core-collapse nucleosynthesis models, low-Z elements are primarily produced in the outer layers of the unprocessed (i.e., hydrostatic He-burning) C-core while high-Z species are synthesized by explosive Ne-, O- and/or Si-burning in the deep interior of the massive progenitor star (e.g., Thielemann et al. 1996). Our results thus suggest that extensive mixing or overturning of the explosive nucleosynthesis products has not occurred in G292.0+1.8 and furthermore that the reverse shock in the remnant has not propagated to the Si/S or Fe-rich zones. The alternate possibility, that no Fe or Si/S ejecta were produced, seems unlikely.
Ne appears to be considerably more abundant in G292.0+1.8 than predicted by standard core-collapse models in which O is invariably overabundant relative to Ne. For instance, assuming 9 (where is the electron density and is the Ne ion density) for the mean ionization state implied by the observed spectrum of region 2, 2 cm-3 and so a Ne ejecta mass of 8 10-4 can be derived (we assumed a spherical geometry with an apparent angular radius of 4′′ and a distance of 6 kpc). Similarily, an O ejecta mass of 11 10-4 is derived. This indicates that the O and Ne ejecta masses are nearly comparable, whereas models typically predict a several times larger mass of O than that of Ne (e.g., Thielemann et al. 1996). This Ne overabundance is thus difficult to understand in terms of standard core-collapse nucleosynthesis models. An extensive study of nucleosynthesis models for various conditions of stellar structure and burning processes may be necessary in order to interpret this anomaly, which is beyond the scope of this Letter.
We compared the measured abundance ratios of O:Si, Ne:Si, and Mg:Si with available core-collapse nucleosynthesis models. The O:Si abundance ratios (in number) are larger than solar by a factor of 5 for regions 2, 3, and 4. Ne:Si and Mg:Si ratios are also large, 4 15 times higher than solar. Assuming 16O, 20Ne, 24Mg, and 28Si to be the dominant isotopes, we derive elemental mass ratios in each region (Table 2). We compare these mass ratios with the mass fraction ratios from model nucleosynthesis of specific burning sites interior to a 20 (Thielemann et al, 1996) and a 25 (Woosley & Weaver, 1995) progenitor. The observed O:Si, Ne:Si, and Mg:Si mass ratios for regions 2, 3, and 4 appear to be roughly consistent with those of nucleosynthesis model products of unprocessed C-core material from the hydrostatic evolution of the massive progenitor and are not a good match to abundances from the explosive Ne-burning regardless of the nucleosynthesis models (Table 2). With only the abundances of hydrostatic burning products available, it is difficult to constrain the mass of the progenitor star. Reliable progenitor masses may be determined by comparing both the hydrostatic and the explosive nucleosynthesis products between the observations and the models. Previous studies of G292.0+1.8 (e.g., Hughes & Singh 1994; G03) derived progenitor masses by assuming that the entire ejecta was emitting X-rays so that the measured abundances could be directly compared to integrated model yields. This assumption now appears to be invalid based on our results.
We estimate the volume of region 1 using a simple slab-like cylindrical geometry with an apparent angular size of 116 86 (0.34 0.25 pc) and a depth of 0.15 pc along the line of sight. This, plus the overall spectral normalization, results in a value for the postshock electron density of 40 cm-3. Similarly high density values are found among the other bright filaments of the equatorial belt. These density values are larger than the ambient density of the blast wave measured at the outer boundary of the SNR ( 0.2 0.5 cm-3; G03), by nearly two orders of magnitudes. These results are supportive of the proposed dense, asymetric CSM origin for the equatorial belt of G292.0+1.8. Our results indicate a high thermal pressure ( 8 10-8 ergs cm-3) for the shocked CSM which is more than an order of magnitude higher than that of the PWN ( 10-9 ergs cm-3; Hughes et al. 2003). The large difference in pressures gives strong support to the idea that the reverse shock has not reached the PWN, further reinforcing our earlier suggestion that the reverse shock has not propagated into the heavy element dominated central portions of the ejecta.
We conclude by summarizing our view of the nature and evolutionary state of G292.0+1.8. We find that the compact ejecta knots in the SNR are dominated by the species O, Ne, and Mg, and show a wide range of temperatures and ionization timescales. The relative abundances are best described by the hydrostatic burning products from a massive progenitor, although Ne appears to be relatively more enhanced than the nucleosynthesis models predict. There are a number of bright dense filaments of normal solar-type composition near the remnant’s center as well as fainter, lower density shocked matter near the outer edge. The former are believed to represent dense stellar wind material, while the latter is probably the ambient interstellar medium. The wide variety of densities and temperatures, as our analysis reveals, indicates that the two-temperature picture of G03 for G292.0+1.8 is grossly oversimplified. From our spectral fits we measure thermal pressures in the shocked gas that are much higher than the pressure in the PWN. This argues that the reverse shock in G292.0+1.8 has not yet propagated deeply enough into the ejecta to encounter the PWN. Thus there should be a reservoir of cold unshocked ejecta between the PWN and the reverse shock. It is plausible to conclude that this is where the Si/S and Fe rich ejecta are in G292.0+1.8, since these species are missing in the optical and X-ray–emitting ejecta. In contrast to Cas A, the ejecta in G292.0+1.8 appear not to have undergone extensive mixing and overturning, but have largely retained their original compositional stratification.
References
- Anders & Grevesse (1989) Anders, E., & Grevesse, N. 1989, Geochimica et Cosmochimica Acta, 53, 197
- Borkowski et al. (2001) Borkowski, K. J., Lyerly, W. J., & Reynolds, S. P. 2001, ApJ, 548, 820
- Gaensler & Wallace (2003) Gaensler, B. M., & Wallace, B. J. 2003, ApJ, in press
- Gonzalez & Safi-Harb (2003) Gonzalez, M., & Safi-Harb, S. 2003, ApJ, 583L, 91, (G03)
- Goss et al. (1979) Goss, W. M., et al. 1979, MNRAS, 188, 357
- Hughes & Singh (1994) Hughes, J. P., & Singh, K. P. 1994, ApJ, 422, 126
- Hughes et al. (2000) Hughes, J. P., Rakowski, C. E., Burrows, D. N. et al. 2000, ApJ, 528, L109
- Hughes et al. (2001) Hughes, J. P., Slane, P. O., Burrows, D. N. et al. 2001, ApJ, 559, L53
- Hughes et al. (2003) Hughes, J. P., Slane, P. O., Park, S. et al. 2003, ApJ, 591, L139
- Murdin & Clark (1979) Murdin, P., & Clark, D. H. 1979, MNRAS, 189, 501
- Park et al. (2002) Park, S., Roming, P. W. A., Hughes, J. P. et al. 2002, ApJ, 564, L39, (P02)
- Thielemann et al (1996) Thielemann, F-. K., Nomoto, K., & Hashimoto, M. 1996, ApJ, 460, 408
- Townsley et al. (2000) Townsley, L. K. et al. 2000, ApJ, 534, L139
- (14) Townsley, L. K., Broos, P. S., Nousek, J. A. 2002a, Nucl Inst & Methods in Phys Res Sec A, 486, 751
- (15) Townsley, L. K., Broos, P. S., Chartas, G. et al. 2002b, Nucl Inst & Methods in Phys Res Sec A, 486, 716
- Woosley & Weaver (1995) Woosley, S. E., & Weaver, T. A. 1995, ApJS, 101, 181
| Region | bbThe errors have been obtained after fixing and at the best-fit values. | O | Ne | Mg | Si | S | Fe | |||
|---|---|---|---|---|---|---|---|---|---|---|
| (keV) | (1021 cm-2) | (1011 cm-3 s) | ||||||||
| 1 | 0.66 | 3.8 | 7.2 | 1.1 | 0.6 | 0.4 | 0.4 | 1.0 | 0.4 | 93.1/85 |
| 2ccBest-fit parameters from a CIE model is presented for the region 2 spectrum. | 0.82 | 4.4 | - | 4.7 | 15.4 | 8.1 | 1.0 | 0.6 | 0.1 | 61.7/51 |
| 3 | 5.31 | 7.7 | 0.8 | 57 | 129 | 72 | 8.9 | 5.1 | 1.0 | 90.8/61 |
| 4 | 3.09 | 6.4 | 0.5 | 13.0 | 21.9 | 12.4 | 2.4 | 0.6 | 2.2 | 76.3/50 |
| 5 | 0.59 | 3.0 | 80.1 | 5.3 | 7.0 | 2.8 | 4.0 | 5.5 | 0.4 | 124.4/87 |
| Elements | Region | Region | Region | Region | C-CorebbNucleosynthesis models are based on Thielemann et al. (1996) for the 20 , Woosley & Weaver (1995) for the 25 progenitors. C-Core indicates abundances for the carbon-core region; Ex Ne indicates abundances from explosive Ne burning. The solar ratios are from Anders & Grevesse (1989). | C-Core | Ex NebbNucleosynthesis models are based on Thielemann et al. (1996) for the 20 , Woosley & Weaver (1995) for the 25 progenitors. C-Core indicates abundances for the carbon-core region; Ex Ne indicates abundances from explosive Ne burning. The solar ratios are from Anders & Grevesse (1989). | Ex Ne | SolarbbNucleosynthesis models are based on Thielemann et al. (1996) for the 20 , Woosley & Weaver (1995) for the 25 progenitors. C-Core indicates abundances for the carbon-core region; Ex Ne indicates abundances from explosive Ne burning. The solar ratios are from Anders & Grevesse (1989). |
|---|---|---|---|---|---|---|---|---|---|
| 2 | 3 | 4 | 5 | 20 | 25 | 20 | 25 | ||
| O/Si | 64.4 | 88.2 | 74.2 | 18.2 | 36 | 110 | 10 | 2 | 13.7 |
| Ne/Si | 38.1 | 36.1 | 22.6 | 4.4 | 6.5 | 27 | 0.5 | 0.01 | 2.5 |
| Mg/Si | 7.5 | 7.4 | 4.7 | 0.6 | 4.5 | 5.3 | 1 | 0.002 | 0.9 |