Displacement of X-Ray Sources from Star Clusters in Starburst Galaxies
Abstract
We examine the spatial offsets between X-ray point sources and star clusters in three starburst galaxies. We find that the X-ray sources are preferentially located near the star clusters. Because the star clusters are very good tracers of the star formation activity in the galaxies, this indicates that the X-ray sources are young objects associated with current star formation. We find significant displacements of the X-ray sources from the clusters. These displacements are likely due to motion of the X-ray sources and indicates that they are X-ray binaries. We find that brighter X-ray sources preferentially occur closer to clusters. The absence of very bright sources at large displacements from clusters may help constrain models of the sources.
keywords:
black hole physics – galaxies: individual: M82, NGC 1569, NGC 5253 – galaxies: starburst – galaxies: stellar content – X-rays: galaxies1 Introduction
Starburst galaxies contain prominent populations of X-ray sources [Fabbiano 1989] including unusually luminous ones [Kaaret et al. 2001, Zezas & Fabbiano 2002]. The young stellar ages within starbursts suggest that the associated X-ray sources are likely to be young objects [Kilgard et al. 2002]. Strong X-ray variability in many sources further suggests those sources are accreting compact objects [Makishima et al. 2000, Kaaret et al. 2001, Fabbiano et al. 2003].
In starburst galaxies, a substantial fraction of young stars are found in compact, luminous star clusters [Meurer et al. 1995]. Indeed, Tremonti et al. (2001) and Harris et al. (2001) find evidence that most high mass stars in starbursts could form in dense clusters which quickly dissolve to feed the surrounding field. Consistent with this, the young compact cluster R136a contains a rich population of massive stars, evidently following a standard Salpeter-like upper initial mass function [Massey & Hunter 1998]. However, there also are indications that some compact young massive clusters have either a flatter than normal upper mass function or a cutoff at low mass [Sternberg 1998, Smith & Gallagher 2001, McCrady, Gilbert, & Graham 2003]. The current data are insufficient to distinguish between these two possibilities [Mengel et al. 2002]. In either case, the clusters would contain relatively more massive stars, and thus potentially more massive X-ray binaries.
Star clusters in starburst regions usually are centrally concentrated, with as much as of stars within a half light radius of a few parsecs (e.g. Ho & Filippenko 1996a,b). Stellar encounters in such dense clusters may enhance the production of X-ray binaries [Portegies Zwart et al. 1999]. Interactions of binaries in clusters [Phinney & Sigurdsson 1991] and binary recoil following supernovae leading to compact object formation [Nelemans, Tauris, & van den Heuvel 1999] can lead to ejection of X-ray binaries from their point of origin. Therefore, if the X-ray sources are X-ray binaries, then they may be expected to be spread over a larger spatial area than the star clusters.
Here, we study the spatial offsets between X-ray point sources and star clusters in three starburst galaxies with dense clusters and deep, high-resolution X-ray observations. We describe our sample, the observations, and our analysis in § 2, the results in § 3, and discuss the implications in § 4.
2 Data
Our selected galaxies are: M82, NGC 1569, and NGC 5253. All three are relatively nearby, within 4 Mpc. Hence, relatively dim X-ray sources can be detected with modest exposures. NGC 5253 is a dwarf galaxy which has been undergoing a starburst for no more than 10 Myr [Beck et al. 1996] and the young star clusters have ages between 1 Myr and 8 Myr [Calzetti et al. 1997, Tremonti et al. 2001]. M82 is the prototypical starburst galaxy. The nuclear star burst has been active for roughly 10 Myr [Satyapal et al. 1997] and may consist of two events with ages of 5 Myr and 10 Myr [McCrady, Gilbert, & Graham 2003]. There is also a more spatially extended “fossil” starburst which occurred 0.6–1 Gyr ago [de Grijs, O’Connell, & Gallagher 2001, de Grijs, Bastian, & Lamers 2003]. NGC 1569 is a dwarf irregular galaxy which has been in a starburst phase for 10-20 Myr [Hunter et al. 2000].
2.1 Star clusters
For each galaxy, we require the positions of the star clusters. For NGC 1569, we used the list of star clusters compiled by Hunter et al. (2000) based on HST observations in the optical band. Because this galaxy has a relatively low gas/dust content and therefore low internal extinction, the optical data should provide a complete cluster list.
M82 is a larger galaxy and has high obscuration near its core, where most of the star clusters are located [McLeod et al. 1993]. Comparison of optical and IR images shows that many clusters are missed in the optical due to the high obscuration. We chose to derive a cluster list from IR observations obtained with NICMOS on HST. The observations and reduction of data to images are described in Alonso-Herrero et al. (2003). We used a sliding cell algorithm to detect compact sources within the images from the NIC2 camera using the F160W filter with a central wavelength 1.6 m and covering a wavelength range of 1.4-1.8 m, and the NIC3 camera using the F166N filter with a central wavelength 1.66 m and a 1% bandpass (images in the F160W filter were not available with NIC3). The NIC2 images are higher resolution (75 mas pixels) and cover the inner regions of the galaxy. The NIC3 images extend the imaged field at lower resolution (200 mas pixels).
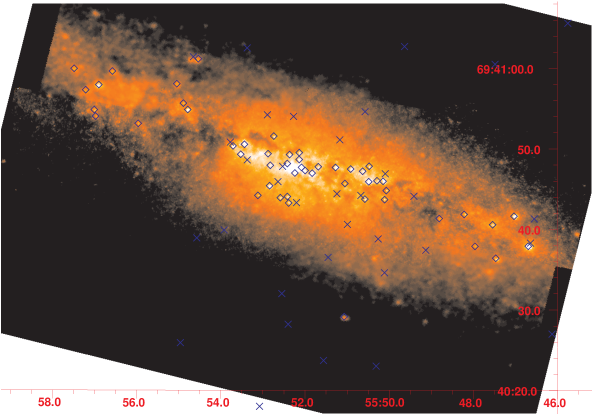
We found clusters in each image. Clusters found in multiple images were used to align the relative positions of the various NICMOS images. We determined the absolute astrometry of the NICMOS images using the positions of four clusters detected in the 2MASS survey which lie well outside the crowded central region of the galaxy. After applying one global shift to the NICMOS coordinates, the positions of all four clusters agree within with the 2MASS source positions. A mosaic of the NICMOS data is shown in Fig. 1.
For NGC 5253, we also used NICMOS observations taken using the NIC2 camera and the F160W filter. The details of these observations, the analysis, and the cluster list will be presented elsewhere (Alonso-Herrero et al., in preparation). The NICMOS field of view is and covers the central region of the galaxy. The astrometry was set using the accurate position for the dominant 1.3 cm radio source [Turner, Beck, & Ho 2000] which is coincident with one of the IR clusters. Due to the small field of view, the roll angle uncertainty from the HST aspect solution leads to only small uncertainties in the cluster positions.
2.2 X-ray sources
We extracted the longest available observation of each galaxy from the Chandra X-Ray Observatory data archive. All observations employed the Advanced CCD Imaging Spectrometer and the High-Resolution Mirror Assembly. The data for M82 [Griffiths et al. 2000] and NGC 1569 [Martin, Kobulnicky, Heckman 2002] have been published previously. We reanalyzed the data to have consistent results for all three galaxies.
For each galaxy, we extracted an image of X-rays in the 0.3–8 keV band. We calculated an exposure map for an assumed powerlaw spectrum with interstellar absorption. The powerlaw photon index was fixed to 1.8 in all cases, and the absorption column density set to the Galactic line-of-sight value for each galaxy. We detected sources using the routine wavdetect in CIAO version 2.3 requiring a source significance of . We compared the resulting source list with optical images from the POSS2 to remove foreground stars and with the NED extragalactic object database to remove background AGN. We used X-ray sources with either AGN or optical star counterparts (from the USNO B catalog) to check the astrometry. The absolute X-ray source positions should be accurate to better than .
Because spectral fitting is not feasible except for the few brightest sources, we calculated an X-ray flux using the same spectrum assumed for the exposure map and correcting only for interstellar absorption within our Galaxy. If the sources have intrinsic absorption or there is absorption within the host galaxy, the true fluxes may be higher. We calculated a luminosity for each X-ray source assuming that it is at the distance to the corresponding galaxy which we take to be 3.6 Mpc for M82, 2.2 Mpc for NGC 1569, and 3.3 Mpc for NGC 5253 [Gibson et al. 2000]. Note that we calculate luminosities assuming isotropic emission. If the X-rays are beamed, then the luminosities would be lower. The luminosities are calculated for the 0.3–8 keV band. The weakest detected sources are for M82, for NGC 1569, and for NGC 5253.
While some of the X-ray sources may be supernova remnants (SNRs) or young supernovae, the fraction of such sources is likely to be small. Martin et al. (2002) identify only one Chandra X-ray source in NGC 1569 as a possible SNR. Griffiths et al. (2000) report three close coincidences (within ) of Chandra X-ray sources with radio SNRs in M82. However, the sources have hard X-ray spectra rather the soft spectra which are found for SNRs [Prestwich et al. 2003] and young supernovae [Kaaret 2001].

| Galaxy | X-ray | Clusters | Displacement (pc) | |
|---|---|---|---|---|
| Sources | Average | Median | ||
| M82 | 42 | 50 | 201 37 | 118 |
| NGC 1569 | 14 | 58 | 218 95 | 34 |
| NGC 5253 | 10 | 13 | 239 106 | 90 |
The Table contains for each galaxy: the galaxy name, the number of X-ray sources within 1 kpc of a star cluster, the number of star clusters, and the average and median of the displacements of X-ray sources from star clusters.
3 Results
To investigate the relation between star clusters and X-ray sources, we found the nearest star cluster to each X-ray source. For X-ray sources born in clusters, this provides a lower bound on the displacement of the source from its parent cluster. The uncertainty in the relative alignment of the X-ray source and star cluster positions is or less, corresponding to uncertainties in the displacements of about 10 pc. Displacements smaller than 10 pc have been set to 10 pc. Displacements smaller than about 20 pc should be considered as upper bounds. We examine only sources within 1 kpc of a star cluster. The distributions of the spatial displacements are shown in Fig. 2 and some statistics of the distributions are shown in Table 1.
Our cluster lists contains all of the most luminous clusters for each galaxy, but may be incomplete at low luminosities. To determine if our results are sensitive to the completeness of the sample, we varied the detection threshold for the clusters in M82 and found the distributions of the spatial displacements of X-ray sources from the clusters for the various cluster lists. We found no significant changes in the distribution for reasonable changes in the threshold. This may be because the lower luminosity clusters tend to be located near brighter clusters already in the list. Thus, the displacements are decreased only slightly.
To determine if the clustering of the X-ray sources near the star clusters is statistically significant, we generated random sets of uniformly distributed sources and found the spatial displacements from the star clusters following the same procedures used for the actual X-ray sources. The displacement distributions of the X-ray sources are inconsistent with that expected for a uniform distribution of sources. The probabilities of chance occurrence from a uniform distribution are for M82, for NGC 1569, and for NGC 5253. For each galaxy, the average displacement of X-ray sources from star clusters is significantly smaller than for the random source distribution, indicating that the X-ray sources are preferentially located near the star clusters.
The distributions of the spatial displacements are similar in all three galaxies, see Fig. 2. We compared the various distributions using a Kolmogorov-Smirnov (KS) test and also by calculating the average source displacement. We applied both tests to both the full data sample and also restricting the source luminosities to the range . In all cases, the distributions of the spatial displacements for the X-ray sources in the three galaxies are consistent with being drawn from the same distribution. The median displacement for NGC 1569 appears somewhat smaller than for the other galaxies, but the difference is not statistically significant. The 90% confidence level error intervals for the median overlap for all three galaxies.

Fig. 3 shows the luminosity of each X-ray source plotted versus its spatial displacement from the nearest star cluster. The striking feature of the plot is that there are no high luminosity sources at large displacements from star clusters. Furthermore, there is an apparent trend of decreasing luminosity with increasing displacement from the nearest star cluster.
To evaluate if this trend is statistically significant, we performed a ‘boot-strap’ analysis. We used the set of displacements and luminosities shown in Fig. 3 and then randomly re-arranged the pairings. This corresponds to the null hypothesis in which luminosity and displacement are unrelated. In trials, we found 1920 cases in which no sources lay in the same region of the luminosity-displacement plot which is empty in Fig. 3. This corresponds to a chance probability of occurrence of .
For M82 there is also an absence of dim sources at small displacements. This is likely due to the high level of diffuse X-ray emission in the central 200 pc of M82 [Griffiths et al. 2000] which precludes detection of dim sources in the central regions of M82. Dim sources are detected very near star clusters in NGC 1569.
4 Discussion
We have shown that X-ray sources in these three starburst galaxies are preferentially located near star clusters. Because the star clusters are very good tracers of current star formation activity in the galaxies, this confirms that the X-ray binaries are young objects associated with current star formation.
We also found significant displacements of the X-ray sources from the clusters. Because X-ray binaries, unlike other bright X-ray sources such as young supernovae, can exhibit high velocities, this suggests that much of the X-ray source population consists of X-ray binaries. Several mechanisms can put a binary in motion. For neutron star binaries, a ‘kick’ due to an asymmetric explosion in the formation of the neutron star can lead to high velocities [Lyne & Lorimer 1994]. Even in the absence of ‘kicks’ from supernova explosions, momentum conservation following a symmetric ejection of matter in the formation of the neutron star or black hole in a binary with a high mass companion can produce a runaway speed of ; the ejected matter continues to move with the instantaneous orbital velocity of the compact object at the moment of ejection and the binary must move in the opposite direction to conserve momentum [Nelemans, Tauris, & van den Heuvel 1999, van den Heuvel et al. 2000]. For binaries in clusters, interactions with other stars and binaries in the cluster can eject the binary from the cluster [Phinney & Sigurdsson 1991, Kulkarni, Hut, & McMillian 1993, Sigurdsson & Hernquist 1993]. In young, dense star clusters such interactions can occur on time scales of a few Myr [Portegies Zwart et al. 1999]. Objects ejected via dynamical interactions tend to escape with close to the minimum energy needed to escape [Joshi, Nave, & Rasio 2001]. The runaway velocities (at infinity) should be of the same magnitude as the stellar velocity dispersions of the clusters, which are typically in these galaxies [Smith & Gallagher 2001, McCrady, Gilbert, & Graham 2003]. The displacements we observe in the starburst galaxies are likely due to motion of the X-ray sources caused by one or more of these mechanisms.
Furthermore, we found that there is an absence of bright X-ray sources with large displacements. This suggests that there is some correlation between the maximum possible brightness of an X-ray source and its motion. This correlation appears to hold only for (isotropic equivalent) luminosities above . The excluded region appears to be bounded by a linear relation between (isotropic equivalent) source luminosity and source displacement from the nearest star cluster , .
In discussing this correlation, we first consider the case where the X-ray sources emit isotropically. In this case, the systems producing such high luminosities likely contain black holes accreting via Roche lobe overflow because such high luminosities would be difficult to achieve in a wind accretor due to the low efficiency of wind capture and black holes and needed to not violate the Eddington limit [Blondin, Stevens, & Kallman 1991, Petterson 1978].
If the X-ray sources are ejected from the star clusters with speeds which are roughly independent of mass, then the inverse correlation between maximum X-ray source luminosity and displacement from the nearest star cluster would arise if the source lifetime varies inversely with luminosity. An upper bound on the source lifetime can be obtained from the time required to fully accrete the stellar companion. For a companion mass and an efficiency for the conversion of mass lost by the companion to luminosity of , the source lifetime must be where is the average luminosity and is the speed of light. For sources traveling with a speed perpendicular to the line of sight, the displacement from the point of origin will then be . If the companion mass is independent of the compact object mass, then this would reproduce the required dependence of source lifetime on luminosity.
Given a typical runaway velocity , we must have to match the line plotted in Fig. 3 which bounds the region where X-ray sources are found. If Roche lobe overflow is occurring, then accretion onto the compact object may be efficient with little mass loss giving . In this case, the companion mass would be . Such intermediate mass companions could be captured via dynamical interactions in the cluster. However, the capture must be directly into a Roche-lobe filling orbit or the binary must hardened into a Roche-lobe filling orbit via successive interactions in order to begin accretion promptly, since the evolutionary time scale of the companion is long. A better understanding of the IMF and the dynamical interactions within the clusters is needed to determine if this scenario is viable. Even with accretion via Roche lobe overflow, the efficiency may be less than since outflows are often observed in X-ray binaries. Super-Eddington mass transfer would also produce . If , then a higher companion mass may be compatible with the data shown in Fig. 3.
If the X-ray sources have high-mass companions and maximum speeds near , then the absence of high luminosity source at large displacements implies a limit on the X-ray emitting lifetime of the sources. We find no sources at luminosities above at displacements larger than 200 pc. At , this would imply that the lifetimes of these luminous sources must be less than 4 Myr, corresponding to very massive stars. An alternative is that the luminosity of the sources decreases with age. This would require an evolutionary path for binaries which produces an accretion rate which decreases with age.
The X-ray binaries may also be beamed [King et al. 2001, Körding et al. 2002, Kaaret et al. 2003]. If the X-ray sources are high-mass systems with high velocities, then the observed correlation would imply that beaming only occurs when the binaries are quite young. King et al. (2001) suggest that the ULXs in starburst galaxies are high mass X-ray binaries with beamed X-ray emission in a phase of thermal-timescale mass transfer. The delay between the formation of the black hole (and, presumably, the start of the binary’s motion away from it point of origin) and the onset of the thermal-timescale mass transfer phase depends on the stellar evolution of the companion. The delay could be 20 Myr for a companion, which would imply that very bright X-ray sources should be visible out to 1 kpc. The data appear inconsistent with this, unless highly beamed X-ray emission occurs in the thermal-timescale mass transfer phase only for very massive companions. Large displacements of high flux sources, inconsistent with the data, also appear allowed in the relativistic beamed model of Kording et al. (2002).
Acknowledgments
We thank the Aspen Center for Physics for its hospitality during the workshop where this work was begun. PK acknowledges partial support from NASA grant NAG5-7405 and Chandra grant GO2-3102X. JSG thanks the University of Wisconsin-Madison for support of this research.
References
- [Alonso-Herrero et al. 2003] Alonso-Herrero A., Rieke G.H., Rieke M.J., Kelly D.M. 2003, AJ, 125, 1210
- [Beck et al. 1996] Beck S.C., Turner J.L., Ho P.T.P., Lacy J.H., Kelly D.M. 1996, ApJ, 457, 610
- [Blondin, Stevens, & Kallman 1991] Blondin J.M., Stevens I.R., Kallman, T.R. 1991, ApJ, 371, 684
- [Calzetti et al. 1997] Calzetti, D. et al. 1997, AJ, 114, 1834
- [de Grijs, O’Connell, & Gallagher 2001] de Grijs R., O’Connell R.W., Gallagher J.S. III 2001, AJ, 121, 768
- [de Grijs, Bastian, & Lamers 2003] de Grijs R., Bastian N., Lamers H.J.G.L.M. 2003, MNRAS, 340, 197
- [Fabbiano 1989] Fabbiano G. 1989, ARA&A, 27, 87
- [Fabbiano et al. 2003] Fabbiano G., Zezas A., King A.R., Ponman T.J., Rots A., Schweizer F. 2003, ApJ, 584, L5
- [Gibson et al. 2000] Gibson, B.K. et al. 2000, ApJ, 529, 723
- [Griffiths et al. 2000] Griffiths, R.E. et al. 2000, Science, 290, 1325
- [Hunter et al. 2000] Hunter D.A., O’Connell R.W., Gallagher J.S., Smecker-Hane T.A. 2000, ApJ, 120, 2383
- [Joshi, Nave, & Rasio 2001] Joshi K.J., Nave C.P., Rasio F.A. 2001, ApJ, 550, 691
- [Kaaret 2001] Kaaret P. 2001, ApJ, 560, 715
- [Kaaret et al. 2001] Kaaret P. et al. 2001, MNRAS, 321, L29
- [Kaaret et al. 2003] Kaaret P., Corbel S., Prestwich A.H., Zezas A. 2003, Science, 299, 365.
- [Kilgard et al. 2002] Kilgard R.E., Kaaret P., Krauss M.I., Prestwich A.H., Raley M.T., Zezas A. 2002, ApJ, 573, 138
- [King et al. 2001] King A.R., Davies M.B., Ward M.J., Fabbiano G., Elvis M. 2001, ApJ, 552, L109
- [Körding et al. 2002] Körding E., Falcke H., Markoff S. 2002, A&A, 382, L13
- [Kulkarni, Hut, & McMillian 1993] Kulkarni S.R., Hut P., McMillian S. 1993, Nature, 364, 421
- [Lyne & Lorimer 1994] Lyne A.G., Lorimer D.R. 1994, Nature, 369, 127
- [Makishima et al. 2000] Makishima K. et al. 2000, ApJ, 535, 632
- [Martin, Kobulnicky, Heckman 2002] Martin C.L., Kobulnicky H.A., Heckman T.M. 2002, ApJ, 574, 663
- [Massey & Hunter 1998] Massey P.M., Hunter D.A. 1998, ApJ, 493, 180
- [McCrady, Gilbert, & Graham 2003] McCrady N., Gilbert A.M., Graham J.R. 2003, ApJ, 596, 240
- [McLeod et al. 1993] McLeod K.K., Rieke G.H., Rieke M.J., Kelly D.M. 1993, ApJ, 412, 111
- [Mengel et al. 2002] Mengel S., Lehnert M.D., Thatte N., Genzel R. 2002, A&A, 383, 137
- [Meurer et al. 1995] Meurer, G., Heckman, T.M., Leitherer, C., Kinney, A., Robert, C., Garnett, D.R. 1995, AJ, 110, 2665
- [Nelemans, Tauris, & van den Heuvel 1999] Nelemans G., Tauris T.M., van den Heuvel E.P.J. 1999, A&A, 352, L87
- [Petterson 1978] Petterson J.A. 1978, ApJ, 224, 625
- [Phinney & Sigurdsson 1991] Phinney E.S., Sigurdsson S. 1991, Nature, 349, 220
- [Portegies Zwart et al. 1999] Portegies Zwart S.F., Makino J., McMillian S.L.W., Hut P. 1999, A&A, 348, 117
- [Prestwich et al. 2003] Prestwich A.H. et al. 2003, ApJ, 595, 719
- [Satyapal et al. 1997] Satyapal S. et al. 1997, ApJ, 483, 148
- [Smith & Gallagher 2001] Smith L.J., Gallagher J.S. III 2000, MNRAS, 326, 1027
- [Sigurdsson & Hernquist 1993] Sigurdsson S., Hernquist L. 1993, Nature, 364, 423
- [Sternberg 1998] Sternberg A. 1998, ApJ, 506, 721
- [Tremonti et al. 2001] Tremonti C.A., Calzetti, D., Leitherer, C., Heckman, T.M. 2001, ApJ, 555, 322
- [Turner, Beck, & Ho 2000] Turner J.L., Beck S.C., Ho P.T.P. 2000, ApJ, 532, L109
- [van den Heuvel et al. 2000] van den Heuvel E.P.J., Portegies Zwart S.F., Bhattacharya D., Kaper L. 2000, A&A, 364, 563
- [Zezas & Fabbiano 2002] Zezas A., Fabbiano G. 2002, ApJ, 577, 726